Comprehensive Guide to Matplotlib.axis.Tick.set_clip_path() Function in Python
Matplotlib.axis.Tick.set_clip_path() function in Python is a powerful tool for customizing the appearance of tick marks in Matplotlib plots. This function allows you to set a clipping path for individual tick marks, providing fine-grained control over their visibility and shape. In this comprehensive guide, we’ll explore the Matplotlib.axis.Tick.set_clip_path() function in detail, covering its usage, parameters, and various applications in data visualization.
Understanding the Basics of Matplotlib.axis.Tick.set_clip_path()
The Matplotlib.axis.Tick.set_clip_path() function is part of the Matplotlib library, which is widely used for creating static, animated, and interactive visualizations in Python. This particular function is specifically designed to work with tick marks on plot axes. Before we dive into the details of set_clip_path(), let’s first understand what tick marks are and why they’re important in data visualization.
Tick marks are the small lines that appear along the axes of a plot, indicating specific values or intervals. They play a crucial role in helping viewers interpret the scale and range of data represented in the plot. The Matplotlib.axis.Tick.set_clip_path() function allows you to define a clipping path for these tick marks, which can be useful for creating custom shapes or limiting their visibility to specific regions of the plot.
Here’s a basic example of how to use the Matplotlib.axis.Tick.set_clip_path() function:
import matplotlib.pyplot as plt
import numpy as np

# Create a simple plot
fig, ax = plt.subplots()
x = np.linspace(0, 10, 100)
y = np.sin(x)
ax.plot(x, y)

# Get the tick objects
xticks = ax.get_xticks()
yticks = ax.get_yticks()

# Create a circular clipping path
circle = plt.Circle((5, 0), 3, transform=ax.transData)

# Apply the clipping path to all x and y ticks
for tick in ax.xaxis.get_major_ticks():
    tick.set_clip_path(circle)
for tick in ax.yaxis.get_major_ticks():
    tick.set_clip_path(circle)

plt.title("Matplotlib.axis.Tick.set_clip_path() Example - how2matplotlib.com")
plt.show()
Output:
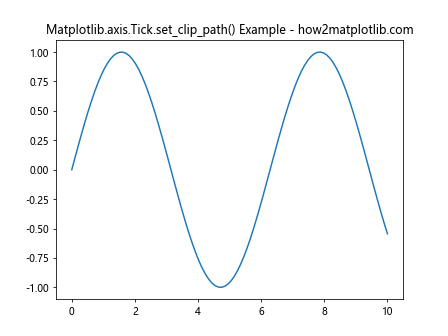
In this example, we create a simple sine wave plot and then apply a circular clipping path to all the tick marks using the Matplotlib.axis.Tick.set_clip_path() function. This results in tick marks only being visible within the circular region defined by the clipping path.
Parameters of Matplotlib.axis.Tick.set_clip_path()
The Matplotlib.axis.Tick.set_clip_path() function takes one main parameter:
path: This parameter specifies the clipping path to be applied to the tick mark. It can be a Patch object (e.g., Rectangle, Circle) or any other valid Path object.
Understanding how to use this parameter effectively is key to mastering the Matplotlib.axis.Tick.set_clip_path() function. Let’s explore some examples to illustrate different ways of using this parameter.
Example 1: Using a Rectangle as a Clipping Path
import matplotlib.pyplot as plt
import numpy as np

fig, ax = plt.subplots()
x = np.linspace(0, 10, 100)
y = np.cos(x)
ax.plot(x, y)

# Create a rectangular clipping path
rect = plt.Rectangle((2, -0.5), 6, 1, transform=ax.transData)

# Apply the clipping path to all x and y ticks
for tick in ax.xaxis.get_major_ticks() + ax.yaxis.get_major_ticks():
    tick.set_clip_path(rect)

plt.title("Rectangular Clip Path - how2matplotlib.com")
plt.show()
Output:
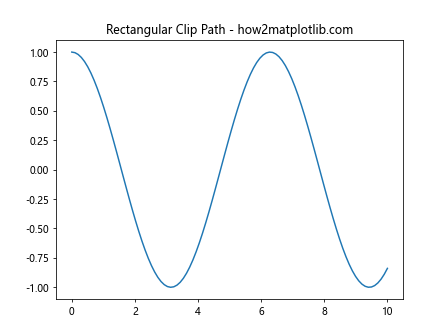
In this example, we use a rectangular clipping path to limit the visibility of tick marks to a specific region of the plot. The Matplotlib.axis.Tick.set_clip_path() function is applied to both x and y axis ticks.
Advanced Applications of Matplotlib.axis.Tick.set_clip_path()
Now that we’ve covered the basics, let’s explore some more advanced applications of the Matplotlib.axis.Tick.set_clip_path() function. These examples will showcase how this function can be used to create unique and visually appealing plots.
Example 2: Applying Different Clipping Paths to X and Y Axes
import matplotlib.pyplot as plt
import numpy as np

fig, ax = plt.subplots()
x = np.linspace(0, 10, 100)
y = np.sin(x) * np.cos(x)
ax.plot(x, y)

# Create different clipping paths for x and y axes
x_clip = plt.Rectangle((2, -1), 6, 2, transform=ax.transData)
y_clip = plt.Circle((5, 0), 0.5, transform=ax.transData)

# Apply clipping paths
for tick in ax.xaxis.get_major_ticks():
    tick.set_clip_path(x_clip)
for tick in ax.yaxis.get_major_ticks():
    tick.set_clip_path(y_clip)

plt.title("Different Clip Paths for X and Y Axes - how2matplotlib.com")
plt.show()
Output:
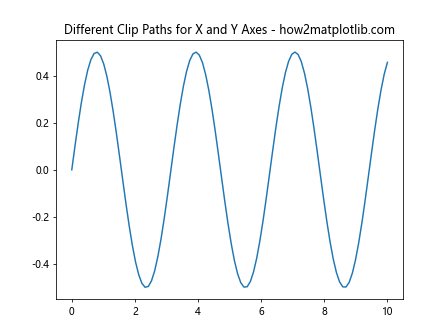
In this example, we apply different clipping paths to the x and y axes using the Matplotlib.axis.Tick.set_clip_path() function. This technique can be useful for emphasizing different aspects of your data or creating visually interesting plots.
Example 3: Animating Clipping Paths
import matplotlib.pyplot as plt
import numpy as np
from matplotlib.animation import FuncAnimation

fig, ax = plt.subplots()
x = np.linspace(0, 10, 100)
y = np.sin(x)
line, = ax.plot(x, y)

def animate(frame):
    # Create a moving circular clipping path
    circle = plt.Circle((frame, 0), 1, transform=ax.transData)

    # Apply the clipping path to all ticks
    for tick in ax.xaxis.get_major_ticks() + ax.yaxis.get_major_ticks():
        tick.set_clip_path(circle)

    return line,

anim = FuncAnimation(fig, animate, frames=np.linspace(0, 10, 100), interval=50, blit=True)

plt.title("Animated Clip Path - how2matplotlib.com")
plt.show()
Output:
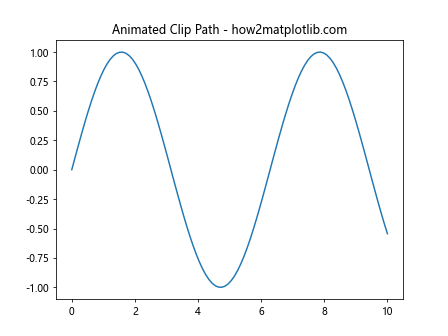
This example demonstrates how to create an animated clipping path using the Matplotlib.axis.Tick.set_clip_path() function. The clipping path moves across the plot, revealing different tick marks as it progresses.
Combining Matplotlib.axis.Tick.set_clip_path() with Other Tick Customizations
The Matplotlib.axis.Tick.set_clip_path() function can be combined with other tick customization techniques to create even more sophisticated visualizations. Let’s explore some examples that demonstrate this.
Example 4: Customizing Tick Labels and Applying Clipping Paths
import matplotlib.pyplot as plt
import numpy as np

fig, ax = plt.subplots()
x = np.linspace(0, 10, 100)
y = np.exp(-0.1 * x) * np.sin(x)
ax.plot(x, y)

# Customize tick labels
ax.set_xticks(np.arange(0, 11, 2))
ax.set_xticklabels(['A', 'B', 'C', 'D', 'E', 'F'], rotation=45)

# Create a triangular clipping path
triangle = plt.Polygon([(0, -1), (5, 1), (10, -1)], transform=ax.transData)

# Apply the clipping path to all ticks
for tick in ax.xaxis.get_major_ticks() + ax.yaxis.get_major_ticks():
    tick.set_clip_path(triangle)

plt.title("Custom Tick Labels with Clipping Path - how2matplotlib.com")
plt.show()
Output:
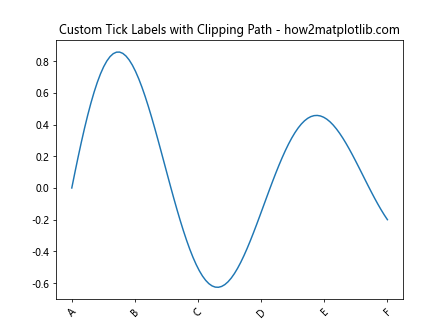
In this example, we customize the tick labels on the x-axis and then apply a triangular clipping path using the Matplotlib.axis.Tick.set_clip_path() function. This combination allows for both informative and visually interesting tick marks.
Practical Applications of Matplotlib.axis.Tick.set_clip_path()
Now that we’ve explored various ways to use the Matplotlib.axis.Tick.set_clip_path() function, let’s look at some practical applications in real-world data visualization scenarios.
Example 5: Highlighting Specific Data Ranges
import matplotlib.pyplot as plt
import numpy as np

fig, ax = plt.subplots()
x = np.linspace(0, 10, 100)
y = np.sin(x) + np.random.normal(0, 0.1, 100)
ax.scatter(x, y, alpha=0.5)

# Create a clipping path to highlight a specific range
highlight = plt.Rectangle((3, -1), 4, 2, transform=ax.transData, alpha=0.2, color='yellow')
ax.add_patch(highlight)

# Apply the clipping path to ticks within the highlighted range
for tick in ax.xaxis.get_major_ticks():
    if 3 <= tick.get_loc() <= 7:
        tick.set_clip_path(highlight)

plt.title("Highlighting Data Ranges - how2matplotlib.com")
plt.show()
Output:
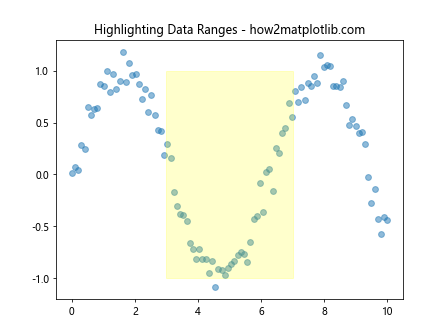
In this example, we use the Matplotlib.axis.Tick.set_clip_path() function to highlight a specific range of data by applying a clipping path only to the ticks within that range. This technique can be useful for drawing attention to particular sections of your data.
Best Practices and Tips for Using Matplotlib.axis.Tick.set_clip_path()
When working with the Matplotlib.axis.Tick.set_clip_path() function, there are several best practices and tips to keep in mind to ensure you're using it effectively:
- Consider the purpose: Before applying a clipping path, think about why you're doing it. Is it for aesthetic reasons, to highlight specific data, or to create a unique visual effect? Understanding your purpose will help guide your implementation.
Be mindful of readability: While creative use of clipping paths can enhance your plots, make sure it doesn't compromise the readability of your data. The primary goal should always be clear communication of information.
Coordinate with other plot elements: When using Matplotlib.axis.Tick.set_clip_path(), consider how it interacts with other elements of your plot, such as labels, legends, and the data itself.
Test different shapes: Experiment with various shapes for your clipping paths. The Matplotlib.axis.Tick.set_clip_path() function is flexible and can accept many types of Path objects.
Combine with other customizations: As we've seen in some examples, combining Matplotlib.axis.Tick.set_clip_path() with other tick customizations can lead to more sophisticated and informative visualizations.
Let's look at a few more examples that illustrate these best practices: