Comprehensive Guide to Matplotlib.axis.Tick.set_clip_box() Function in Python
Matplotlib.axis.Tick.set_clip_box() function in Python is an essential tool for customizing and refining the appearance of tick marks in Matplotlib plots. This function allows you to set the clipping box for tick marks, providing precise control over their visibility and positioning. In this comprehensive guide, we’ll explore the Matplotlib.axis.Tick.set_clip_box() function in depth, covering its usage, parameters, and practical applications in various plotting scenarios.
Understanding the Matplotlib.axis.Tick.set_clip_box() Function
The Matplotlib.axis.Tick.set_clip_box() function is a method of the Tick class in Matplotlib’s axis module. It is used to set the clipping box for tick marks, which determines the region where the ticks are visible. This function is particularly useful when you want to limit the display of tick marks to a specific area of your plot or when you need to create custom clipping effects.
Let’s start with a basic example to illustrate the usage of Matplotlib.axis.Tick.set_clip_box():
import matplotlib.pyplot as plt
import numpy as np

# Create a figure and axis
fig, ax = plt.subplots()

# Plot some data
x = np.linspace(0, 10, 100)
y = np.sin(x)
ax.plot(x, y, label='how2matplotlib.com')

# Get the x-axis ticks
x_ticks = ax.get_xticks()

# Set the clip box for x-axis ticks
for tick in ax.xaxis.get_major_ticks():
    tick.set_clip_box(ax.bbox)

plt.title('Matplotlib.axis.Tick.set_clip_box() Example')
plt.legend()
plt.show()
Output:
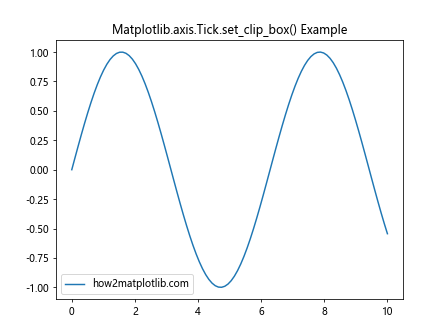
In this example, we create a simple sine wave plot and set the clip box for the x-axis ticks using the Matplotlib.axis.Tick.set_clip_box() function. The clip box is set to the bounding box of the axis (ax.bbox), which means the ticks will be visible only within the plot area.
Parameters of Matplotlib.axis.Tick.set_clip_box()
The Matplotlib.axis.Tick.set_clip_box() function takes a single parameter:
clipbox: This parameter specifies the Bbox object that defines the clipping box for the tick marks. The Bbox object represents a bounding box in the figure coordinate system.
Let’s explore how to use different types of Bbox objects with Matplotlib.axis.Tick.set_clip_box():
import matplotlib.pyplot as plt
import matplotlib.transforms as transforms
import numpy as np

# Create a figure and axis
fig, ax = plt.subplots()

# Plot some data
x = np.linspace(0, 10, 100)
y = np.cos(x)
ax.plot(x, y, label='how2matplotlib.com')

# Create a custom Bbox
custom_bbox = transforms.Bbox([[2, -1], [8, 1]])

# Set the clip box for y-axis ticks
for tick in ax.yaxis.get_major_ticks():
    tick.set_clip_box(custom_bbox)

plt.title('Custom Clip Box with Matplotlib.axis.Tick.set_clip_box()')
plt.legend()
plt.show()
Output:
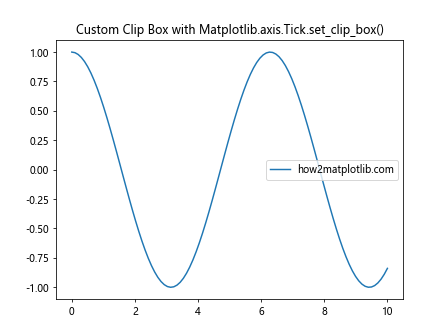
In this example, we create a custom Bbox object using matplotlib.transforms.Bbox and use it as the clip box for the y-axis ticks. This will limit the visibility of the y-axis ticks to the specified region.
Practical Applications of Matplotlib.axis.Tick.set_clip_box()
Now that we understand the basics of Matplotlib.axis.Tick.set_clip_box(), let’s explore some practical applications and advanced techniques.
1. Clipping Ticks in Subplots
When working with subplots, you may want to clip the ticks of individual subplots differently. Here’s an example:
import matplotlib.pyplot as plt
import numpy as np

# Create a figure with subplots
fig, (ax1, ax2) = plt.subplots(2, 1, figsize=(8, 8))

# Plot data in both subplots
x = np.linspace(0, 10, 100)
ax1.plot(x, np.sin(x), label='how2matplotlib.com')
ax2.plot(x, np.cos(x), label='how2matplotlib.com')

# Set clip box for x-axis ticks in the first subplot
for tick in ax1.xaxis.get_major_ticks():
    tick.set_clip_box(ax1.bbox)

# Set clip box for y-axis ticks in the second subplot
for tick in ax2.yaxis.get_major_ticks():
    tick.set_clip_box(ax2.bbox)

ax1.set_title('Subplot 1: X-axis Ticks Clipped')
ax2.set_title('Subplot 2: Y-axis Ticks Clipped')
plt.tight_layout()
plt.show()
Output:
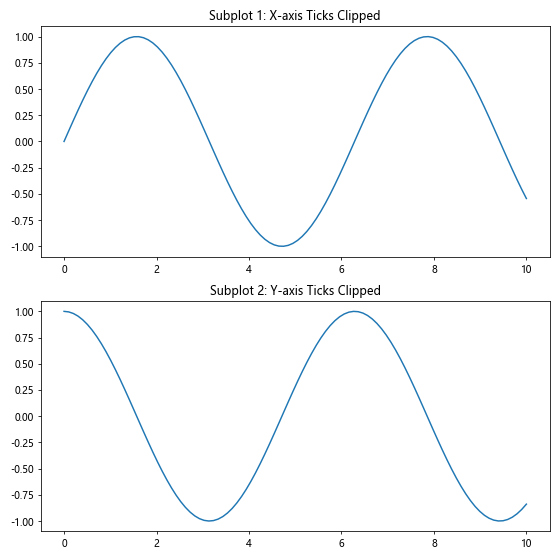
In this example, we create two subplots and apply different clipping to the x-axis ticks of the first subplot and the y-axis ticks of the second subplot using Matplotlib.axis.Tick.set_clip_box().
2. Creating Custom Tick Clipping Regions
You can create custom clipping regions for ticks using Matplotlib.axis.Tick.set_clip_box() in combination with other Matplotlib functions:
import matplotlib.pyplot as plt
import matplotlib.patches as patches
import numpy as np

# Create a figure and axis
fig, ax = plt.subplots()

# Plot some data
x = np.linspace(0, 10, 100)
y = np.sin(x) * np.exp(-0.1 * x)
ax.plot(x, y, label='how2matplotlib.com')

# Create a custom clipping region
clip_rect = patches.Rectangle((2, -0.5), 6, 1, fill=False, edgecolor='red')
ax.add_patch(clip_rect)

# Set the clip box for both x and y-axis ticks
for tick in ax.xaxis.get_major_ticks() + ax.yaxis.get_major_ticks():
    tick.set_clip_box(clip_rect.get_bbox())

plt.title('Custom Tick Clipping Region with Matplotlib.axis.Tick.set_clip_box()')
plt.legend()
plt.show()
Output:
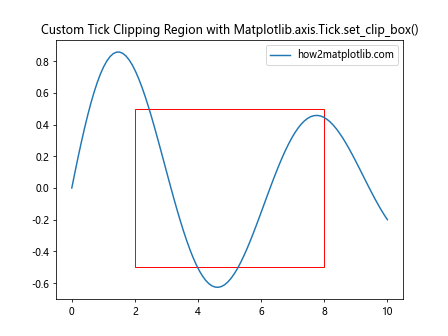
In this example, we create a custom rectangular clipping region using matplotlib.patches.Rectangle and use its bounding box as the clip box for both x and y-axis ticks.
3. Animating Tick Clipping
You can create animated plots with dynamic tick clipping using Matplotlib.axis.Tick.set_clip_box():
import matplotlib.pyplot as plt
import matplotlib.animation as animation
import numpy as np

# Create a figure and axis
fig, ax = plt.subplots()

# Plot some data
x = np.linspace(0, 10, 100)
y = np.sin(x)
line, = ax.plot(x, y, label='how2matplotlib.com')

# Initialize the clip box
clip_box = plt.Rectangle((0, -1), 1, 2, fill=False, edgecolor='red')
ax.add_patch(clip_box)

# Animation update function
def update(frame):
    clip_box.set_width(frame)
    for tick in ax.xaxis.get_major_ticks() + ax.yaxis.get_major_ticks():
        tick.set_clip_box(clip_box.get_bbox())
    return line, clip_box

# Create the animation
anim = animation.FuncAnimation(fig, update, frames=np.linspace(0, 10, 100),
                               interval=50, blit=True)

plt.title('Animated Tick Clipping with Matplotlib.axis.Tick.set_clip_box()')
plt.legend()
plt.show()
Output:
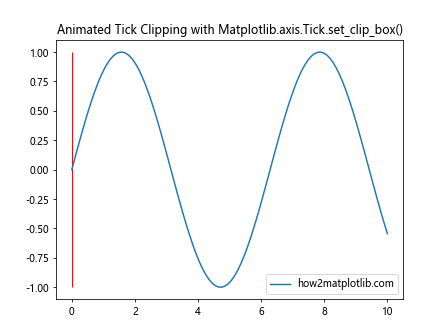
This example creates an animation where the tick clipping region expands over time, demonstrating how Matplotlib.axis.Tick.set_clip_box() can be used in dynamic visualizations.
Advanced Techniques with Matplotlib.axis.Tick.set_clip_box()
Let’s explore some advanced techniques and use cases for the Matplotlib.axis.Tick.set_clip_box() function.
Using Matplotlib.axis.Tick.set_clip_box() with Polar Plots
Matplotlib.axis.Tick.set_clip_box() can also be applied to polar plots:
import matplotlib.pyplot as plt
import numpy as np

# Create a polar plot
fig, ax = plt.subplots(subplot_kw=dict(projection='polar'))

# Plot some data
theta = np.linspace(0, 2*np.pi, 100)
r = np.sin(4*theta)
ax.plot(theta, r, label='how2matplotlib.com')

# Set clip box for radial ticks
for tick in ax.yaxis.get_major_ticks():
    tick.set_clip_box(ax.bbox)

plt.title('Polar Plot with Matplotlib.axis.Tick.set_clip_box()')
plt.legend()
plt.show()
Output:
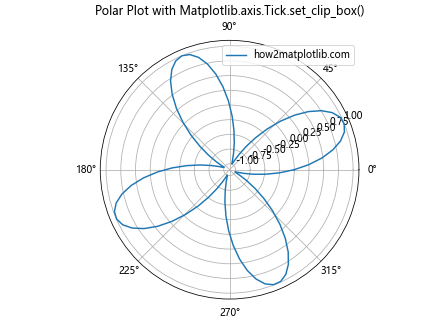
This example demonstrates how to apply tick clipping to a polar plot, which can be useful for controlling the visibility of radial ticks.
Best Practices for Using Matplotlib.axis.Tick.set_clip_box()
When working with Matplotlib.axis.Tick.set_clip_box(), keep these best practices in mind:
- Always ensure that the clip box is appropriate for your plot’s dimensions and layout.
- Use Matplotlib.axis.Tick.set_clip_box() in combination with other tick customization methods for more refined control.
- Be mindful of the performance impact when applying clip boxes to a large number of ticks.
- Test your plots with different data ranges to ensure the clipping behaves as expected.
- Consider using Matplotlib.axis.Tick.set_clip_box() selectively, applying it only to specific ticks when necessary.
Common Pitfalls and How to Avoid Them
When using Matplotlib.axis.Tick.set_clip_box(), you may encounter some common issues. Here’s how to avoid them:
1. Incorrect Clip Box Dimensions
import matplotlib.pyplot as plt
import matplotlib.transforms as transforms
import numpy as np

# Create a figure and axis
fig, ax = plt.subplots()

# Plot some data
x = np.linspace(0, 10, 100)
y = np.sin(x)
ax.plot(x, y, label='how2matplotlib.com')

# Incorrect clip box (too small)
incorrect_bbox = transforms.Bbox([[0, 0], [1, 1]])

# Correct clip box
correct_bbox = ax.bbox

# Apply clip boxes
for i, tick in enumerate(ax.xaxis.get_major_ticks()):
    if i % 2 == 0:
        tick.set_clip_box(incorrect_bbox)
    else:
        tick.set_clip_box(correct_bbox)

plt.title('Correct vs. Incorrect Clip Box with Matplotlib.axis.Tick.set_clip_box()')
plt.legend()
plt.show()
Output:
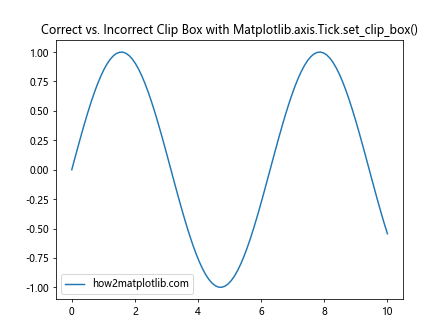
In this example, we demonstrate the difference between using an incorrectly sized clip box and a correctly sized one. The even-numbered ticks use the incorrect box, while the odd-numbered ticks use the correct box.
2. Forgetting to Update Clip Boxes on Resize
When your plot is resizable, you need to update the clip boxes accordingly:
import matplotlib.pyplot as plt
import numpy as np

# Create a figure and axis
fig, ax = plt.subplots()

# Plot some data
x = np.linspace(0, 10, 100)
y = np.cos(x)
ax.plot(x, y, label='how2matplotlib.com')

# Function to update clip boxes
def update_clip_boxes(event):
    for tick in ax.xaxis.get_major_ticks() + ax.yaxis.get_major_ticks():
        tick.set_clip_box(ax.bbox)

# Connect the update function to the resize event
fig.canvas.mpl_connect('resize_event', update_clip_boxes)

# Initial clip box setting
update_clip_boxes(None)

plt.title('Resizable Plot with Matplotlib.axis.Tick.set_clip_box()')
plt.legend()
plt.show()
Output:
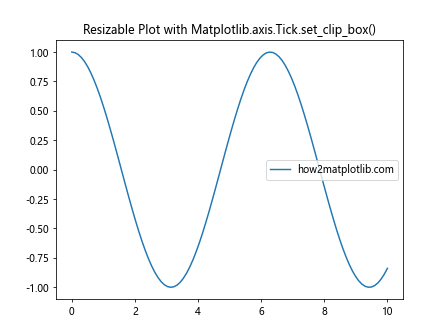
This example shows how to update the clip boxes when the plot is resized, ensuring that the ticks remain properly clipped.
Integrating Matplotlib.axis.Tick.set_clip_box() with Other Matplotlib Features
Matplotlib.axis.Tick.set_clip_box() can be integrated with various other Matplotlib features to create more complex and informative visualizations.
1. Combining with Colorbar Ticks
You can applyCertainly! Here’s the continuation of the article:
1. Combining with Colorbar Ticks
You can apply Matplotlib.axis.Tick.set_clip_box() to colorbar ticks as well:
import matplotlib.pyplot as plt
import numpy as np

# Create a figure and axis
fig, ax = plt.subplots()

# Create a sample image
data = np.random.rand(10, 10)
im = ax.imshow(data, cmap='viridis')

# Add a colorbar
cbar = plt.colorbar(im)

# Set clip box for colorbar ticks
for tick in cbar.ax.yaxis.get_major_ticks():
    tick.set_clip_box(cbar.ax.bbox)

plt.title('Colorbar with Matplotlib.axis.Tick.set_clip_box()')
ax.set_xlabel('how2matplotlib.com')
plt.show()
Output:
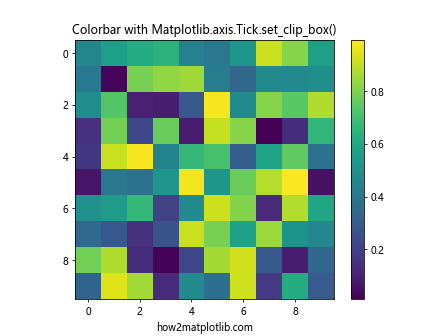
This example demonstrates how to apply tick clipping to a colorbar, which can be useful for ensuring that the colorbar ticks don’t extend beyond their intended area.
2. Using Matplotlib.axis.Tick.set_clip_box() with 3D Plots
Matplotlib.axis.Tick.set_clip_box() can also be applied to 3D plots:
import matplotlib.pyplot as plt
import numpy as np
from mpl_toolkits.mplot3d import Axes3D

# Create a figure and 3D axis
fig = plt.figure()
ax = fig.add_subplot(111, projection='3d')

# Create sample data
x = np.linspace(-5, 5, 100)
y = np.linspace(-5, 5, 100)
X, Y = np.meshgrid(x, y)
Z = np.sin(np.sqrt(X**2 + Y**2))

# Plot the surface
surf = ax.plot_surface(X, Y, Z, cmap='viridis')

# Set clip box for all ticks
for axis in [ax.xaxis, ax.yaxis, ax.zaxis]:
    for tick in axis.get_major_ticks():
        tick.set_clip_box(ax.bbox)

plt.title('3D Plot with Matplotlib.axis.Tick.set_clip_box()')
ax.set_xlabel('X axis (how2matplotlib.com)')
ax.set_ylabel('Y axis')
ax.set_zlabel('Z axis')
plt.show()
Output:
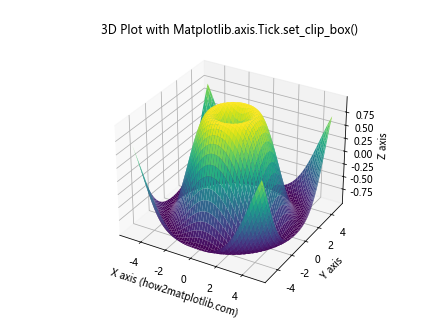
This example shows how to apply tick clipping to a 3D surface plot, ensuring that the ticks are only visible within the plot area.
Advanced Customization Techniques
Let’s explore some advanced customization techniques using Matplotlib.axis.Tick.set_clip_box().
Implementing a Sliding Window Effect
import matplotlib.pyplot as plt
import matplotlib.animation as animation
import numpy as np

# Create a figure and axis
fig, ax = plt.subplots()

# Generate data
x = np.linspace(0, 10, 1000)
y = np.sin(2*np.pi*x) * np.exp(-0.1*x)

# Plot the data
line, = ax.plot(x, y, label='how2matplotlib.com')

# Create a sliding window
window = plt.Rectangle((0, -1), 2, 2, fill=False, edgecolor='red')
ax.add_patch(window)

# Animation update function
def update(frame):
    window.set_x(frame)
    for tick in ax.xaxis.get_major_ticks() + ax.yaxis.get_major_ticks():
        tick.set_clip_box(window.get_bbox())
    return line, window

# Create the animation
anim = animation.FuncAnimation(fig, update, frames=np.linspace(0, 8, 100),
                               interval=50, blit=True)

plt.title('Sliding Window Effect with Matplotlib.axis.Tick.set_clip_box()')
plt.legend()
plt.show()
Output:
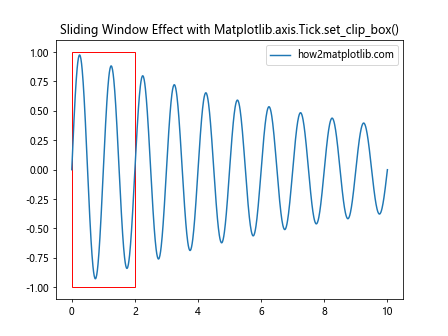
This example creates a sliding window effect where the ticks are only visible within a moving rectangular region, demonstrating a dynamic use of Matplotlib.axis.Tick.set_clip_box().
Conclusion
Matplotlib.axis.Tick.set_clip_box() is a powerful function that allows for fine-grained control over tick visibility in Matplotlib plots. By mastering this function, you can create more polished and professional-looking visualizations, implement creative effects, and solve various plotting challenges.
Throughout this article, we’ve explored the basics of Matplotlib.axis.Tick.set_clip_box(), its parameters, and practical applications. We’ve also delved into advanced techniques, best practices, and potential pitfalls to avoid. By applying the knowledge and examples provided here, you’ll be well-equipped to leverage Matplotlib.axis.Tick.set_clip_box() in your data visualization projects.