Comprehensive Guide to Matplotlib.axis.Tick.set_animated() Function in Python
Matplotlib.axis.Tick.set_animated() function in Python is a powerful tool for creating dynamic and interactive visualizations. This function is part of the Matplotlib library, which is widely used for creating static, animated, and interactive plots in Python. The set_animated() function specifically allows you to control the animation behavior of tick marks on plot axes. In this comprehensive guide, we’ll explore the Matplotlib.axis.Tick.set_animated() function in depth, covering its usage, parameters, and various applications in data visualization.
Understanding the Basics of Matplotlib.axis.Tick.set_animated()
The Matplotlib.axis.Tick.set_animated() function is a method of the Tick class in Matplotlib’s axis module. It is used to set the animated state of a tick mark. When a tick is set to be animated, it becomes part of the dynamic elements of a plot that can be updated efficiently during animations.
Let’s start with a simple example to illustrate the basic usage of Matplotlib.axis.Tick.set_animated():
import matplotlib.pyplot as plt
import numpy as np

# Create a figure and axis
fig, ax = plt.subplots()

# Plot some data
x = np.linspace(0, 10, 100)
y = np.sin(x)
line, = ax.plot(x, y)

# Get the x-axis ticks
xticks = ax.get_xticks()

# Set the animated state of each tick
for tick in ax.xaxis.get_major_ticks():
    tick.set_animated(True)

# Add a title with the website name
plt.title('Animated Ticks Example - how2matplotlib.com')

plt.show()
Output:
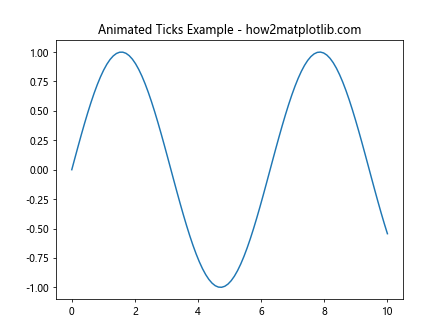
In this example, we create a simple sine wave plot and set all the x-axis ticks to be animated using the set_animated() function. This prepares the ticks for efficient updating during animations.
The Importance of Matplotlib.axis.Tick.set_animated() in Animations
The Matplotlib.axis.Tick.set_animated() function plays a crucial role in creating smooth and efficient animations in Matplotlib. When you set a tick to be animated, you’re telling Matplotlib that this element will be frequently updated during the animation process. This allows Matplotlib to optimize the rendering of these elements, resulting in better performance and smoother animations.
Here’s an example that demonstrates the importance of using set_animated() in an animation context:
import matplotlib.pyplot as plt
import matplotlib.animation as animation
import numpy as np

# Create a figure and axis
fig, ax = plt.subplots()

# Create initial plot
x = np.linspace(0, 2*np.pi, 100)
line, = ax.plot(x, np.sin(x))

# Set ticks to be animated
for tick in ax.xaxis.get_major_ticks() + ax.yaxis.get_major_ticks():
    tick.set_animated(True)

# Animation update function
def update(frame):
    line.set_ydata(np.sin(x + frame/10))
    return line,

# Create animation
ani = animation.FuncAnimation(fig, update, frames=100, interval=50, blit=True)

# Add a title with the website name
plt.title('Animated Sine Wave - how2matplotlib.com')

plt.show()
Output:
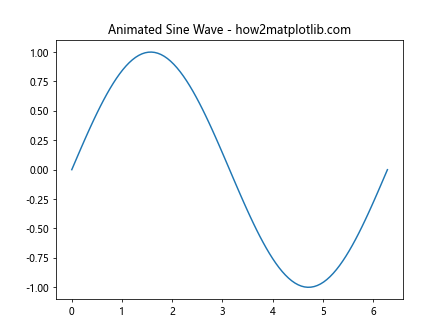
In this example, we create an animated sine wave. By setting the ticks to be animated, we ensure that they are efficiently updated along with the moving sine wave, resulting in a smoother animation.
Parameters of Matplotlib.axis.Tick.set_animated()
The Matplotlib.axis.Tick.set_animated() function has a single parameter:
b(bool): If True, the artist is set to be animated. If False, the artist is set to be static.
Let’s look at an example that demonstrates the use of this parameter:
import matplotlib.pyplot as plt
import numpy as np

# Create a figure and axis
fig, ax = plt.subplots()

# Plot some data
x = np.linspace(0, 10, 100)
y = np.sin(x)
line, = ax.plot(x, y)

# Set only even-indexed ticks to be animated
for i, tick in enumerate(ax.xaxis.get_major_ticks()):
    tick.set_animated(i % 2 == 0)

# Add a title with the website name
plt.title('Selectively Animated Ticks - how2matplotlib.com')

plt.show()
Output:
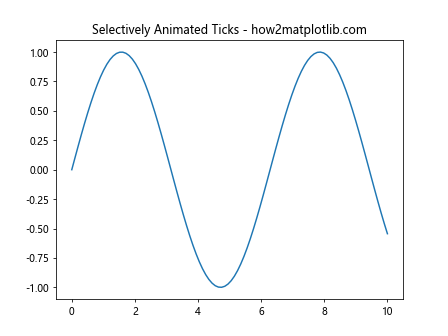
In this example, we set only the even-indexed ticks to be animated by passing True or False to set_animated() based on the tick’s index.
Using Matplotlib.axis.Tick.set_animated() in Multi-Axis Plots
The set_animated() function can be particularly useful in plots with multiple axes. Let’s look at an example:
import matplotlib.pyplot as plt
import numpy as np

# Create a figure with two subplots
fig, (ax1, ax2) = plt.subplots(2, 1, sharex=True)

# Plot data on both axes
x = np.linspace(0, 10, 100)
ax1.plot(x, np.sin(x))
ax2.plot(x, np.cos(x))

# Set ticks to be animated on both axes
for ax in [ax1, ax2]:
    for tick in ax.xaxis.get_major_ticks() + ax.yaxis.get_major_ticks():
        tick.set_animated(True)

# Add titles with the website name
ax1.set_title('Sine Wave - how2matplotlib.com')
ax2.set_title('Cosine Wave - how2matplotlib.com')

plt.tight_layout()
plt.show()
Output:
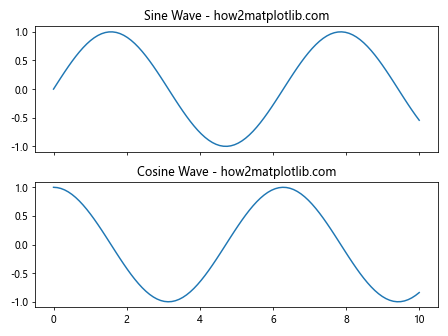
In this example, we create a plot with two subplots and set all ticks on both axes to be animated. This prepares the plot for efficient updating if we were to animate it.
Matplotlib.axis.Tick.set_animated() in 3D Plots
The set_animated() function can also be used with 3D plots in Matplotlib. Here’s an example:
import matplotlib.pyplot as plt
from mpl_toolkits.mplot3d import Axes3D
import numpy as np

# Create a 3D figure and axis
fig = plt.figure()
ax = fig.add_subplot(111, projection='3d')

# Create some 3D data
x = np.linspace(-5, 5, 100)
y = np.linspace(-5, 5, 100)
X, Y = np.meshgrid(x, y)
Z = np.sin(np.sqrt(X**2 + Y**2))

# Plot the surface
surf = ax.plot_surface(X, Y, Z)

# Set ticks to be animated
for axis in [ax.xaxis, ax.yaxis, ax.zaxis]:
    for tick in axis.get_major_ticks():
        tick.set_animated(True)

# Add a title with the website name
ax.set_title('3D Animated Ticks - how2matplotlib.com')

plt.show()
Output:
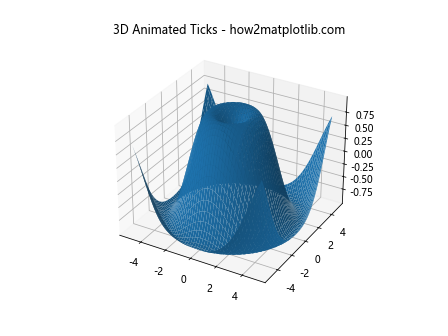
In this example, we create a 3D surface plot and set all ticks on all three axes to be animated.
Combining Matplotlib.axis.Tick.set_animated() with Custom Tick Formatters
The set_animated() function can be used alongside custom tick formatters to create more informative and dynamic plots. Here’s an example:
import matplotlib.pyplot as plt
import numpy as np

# Create a figure and axis
fig, ax = plt.subplots()

# Plot some data
x = np.linspace(0, 10, 100)
y = np.exp(x)
line, = ax.plot(x, y)

# Custom tick formatter function
def format_func(value, tick_number):
    return f"e^{value:.1f}"

# Set custom formatter and animate ticks
ax.xaxis.set_major_formatter(plt.FuncFormatter(format_func))
for tick in ax.xaxis.get_major_ticks():
    tick.set_animated(True)

# Add a title with the website name
plt.title('Exponential Plot with Custom Ticks - how2matplotlib.com')

plt.show()
Output:
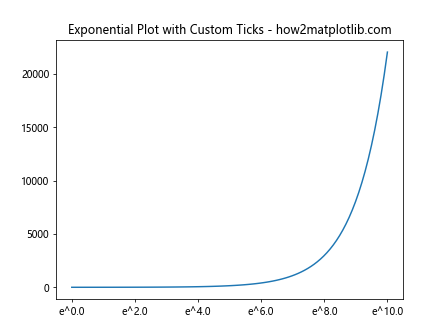
In this example, we use a custom formatter to display tick labels as exponential expressions, and set these custom ticks to be animated.
Using Matplotlib.axis.Tick.set_animated() with Logarithmic Scales
The set_animated() function can be particularly useful when working with logarithmic scales. Here’s an example:
import matplotlib.pyplot as plt
import numpy as np

# Create a figure and axis
fig, ax = plt.subplots()

# Create logarithmic data
x = np.logspace(0, 5, 100)
y = x**2

# Plot on log-log scale
line, = ax.loglog(x, y)

# Set ticks to be animated
for axis in [ax.xaxis, ax.yaxis]:
    for tick in axis.get_major_ticks():
        tick.set_animated(True)

# Add a title with the website name
plt.title('Log-Log Plot with Animated Ticks - how2matplotlib.com')

plt.show()
Output:
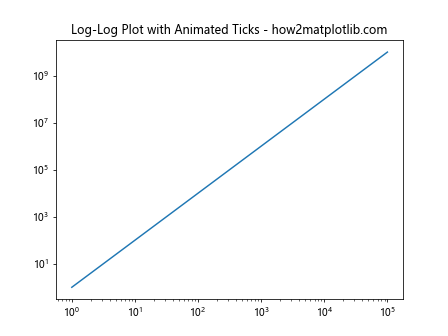
In this example, we create a log-log plot and set all ticks to be animated, which can be useful for efficiently updating the plot during animations on logarithmic scales.
Matplotlib.axis.Tick.set_animated() in Polar Plots
The set_animated() function can also be used with polar plots. Here’s an example:
import matplotlib.pyplot as plt
import numpy as np

# Create a polar plot
fig, ax = plt.subplots(subplot_kw=dict(projection='polar'))

# Create some data
r = np.linspace(0, 2, 100)
theta = 2 * np.pi * r

# Plot the data
ax.plot(theta, r)

# Set ticks to be animated
for tick in ax.xaxis.get_major_ticks() + ax.yaxis.get_major_ticks():
    tick.set_animated(True)

# Add a title with the website name
ax.set_title('Polar Plot with Animated Ticks - how2matplotlib.com')

plt.show()
Output:
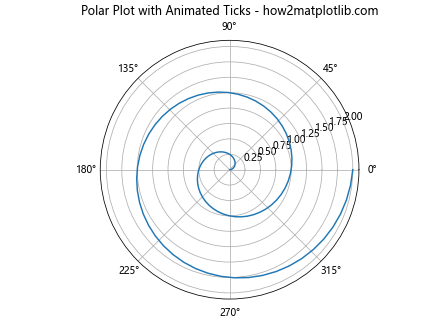
In this example, we create a polar plot and set all radial and angular ticks to be animated.
Combining Matplotlib.axis.Tick.set_animated() with Subplots
The set_animated() function can be used effectively with subplots to create complex, animated visualizations. Here’s an example:
import matplotlib.pyplot as plt
import numpy as np

# Create a figure with multiple subplots
fig, axs = plt.subplots(2, 2, figsize=(12, 10))

# Flatten the axes array for easy iteration
axs = axs.flatten()

# Create different plots in each subplot
x = np.linspace(0, 10, 100)
functions = [np.sin, np.cos, np.tan, np.exp]

for ax, func in zip(axs, functions):
    ax.plot(x, func(x))
    ax.set_title(f'{func.__name__}(x)')

    # Set ticks to be animated for each subplot
    for tick in ax.xaxis.get_major_ticks() + ax.yaxis.get_major_ticks():
        tick.set_animated(True)

# Add a main title with the website name
fig.suptitle('Multiple Plots with Animated Ticks - how2matplotlib.com', fontsize=16)

plt.tight_layout()
plt.show()
Output:
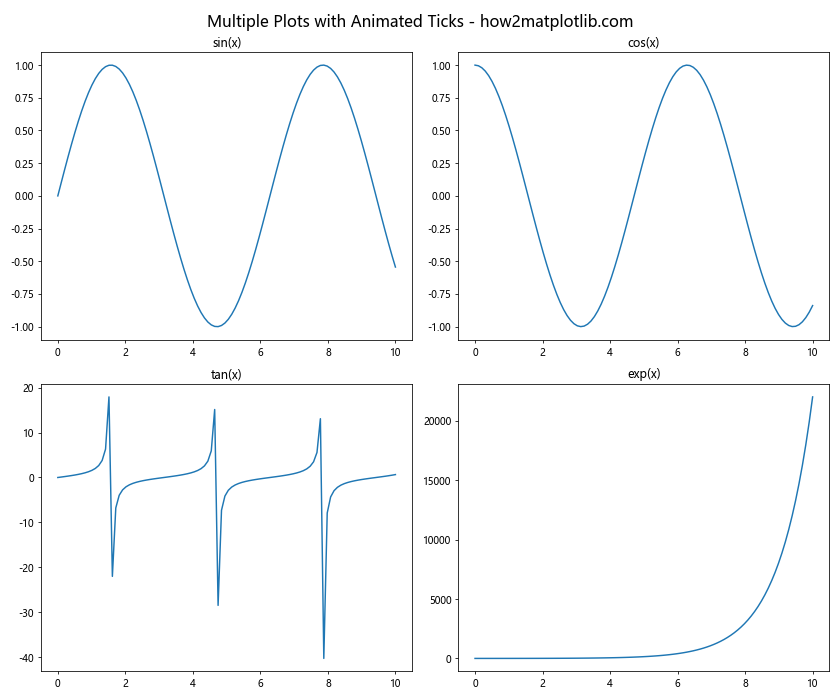
In this example, we create a 2×2 grid of subplots, each with a different mathematical function, and set all ticks in all subplots to be animated.
Using Matplotlib.axis.Tick.set_animated() with Colorbar Ticks
The set_animated() function can also be applied to colorbar ticks. Here’s an example:
import matplotlib.pyplot as plt
import numpy as np

# Create some data
x = np.linspace(-3, 3, 100)
y = np.linspace(-3, 3, 100)
X, Y = np.meshgrid(x, y)
Z = np.sin(X) * np.cos(Y)

# Create a figure and axis
fig, ax = plt.subplots()

# Create a contour plot
cs = ax.contourf(X, Y, Z)

# Add a colorbar
cbar = fig.colorbar(cs)

# Set main plot ticks to be animated
for tick in ax.xaxis.get_major_ticks() + ax.yaxis.get_major_ticks():
    tick.set_animated(True)

# Set colorbar ticks to be animated
for tick in cbar.ax.yaxis.get_major_ticks():
    tick.set_animated(True)

# Add a title with the website name
plt.title('Contour Plot with Animated Ticks - how2matplotlib.com')

plt.show()
Output:
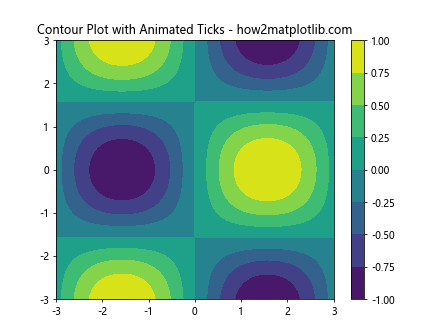
In this example, we create a contour plot with a colorbar and set all ticks, including those on the colorbar, to be animated.
Matplotlib.axis.Tick.set_animated() in Interactive Plots
The set_animated() function can be particularly useful in interactive plots. Here’s an example using Matplotlib’s widgets:
import matplotlib.pyplot as plt
from matplotlib.widgets import Slider
import numpy as np

# Create the figure and axis
fig, ax = plt.subplots()
plt.subplots_adjust(bottom=0.25)

# Create some data
t = np.linspace(0, 1, 1000)
a0 = 5
f0 = 3
s = a0 * np.sin(2 * np.pi * f0 * t)
line, = plt.plot(t, s)

# Create the slider
ax_freq = plt.axes([0.25, 0.1, 0.65, 0.03])
freq_slider = Slider(ax_freq, 'Freq', 0.1, 30.0, valinit=f0)

# Set ticks to be animated
for tick in ax.xaxis.get_major_ticks() + ax.yaxis.get_major_ticks():
    tick.set_animated(True)

# Update function for the slider
def update(val):
    f = freq_slider.val
    line.set_ydata(a0 * np.sin(2 * np.pi * f * t))
    fig.canvas.draw_idle()

freq_slider.on_changed(update)

# Add a title with the website name
plt.title('Interactive Plot with Animated Ticks - how2matplotlib.com')

plt.show()
Output:
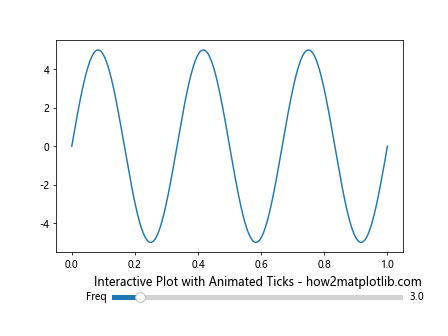
In this example, we create an interactive plot with a slider to control the frequency of a sine wave. By setting the ticks to be animated, we ensure smooth updates when the slider is moved.
Combining Matplotlib.axis.Tick.set_animated() with Custom Tick Locations
The set_animated() function can be used in conjunction with custom tick locations to create more specialized plots. Here’s an example:
import matplotlib.pyplot as plt
import numpy as np

# Create a figure and axis
fig, ax = plt.subplots()

# Plot some data
x = np.linspace(0, 10, 100)
y = np.sin(x)
line, = ax.plot(x, y)

# Set custom tick locations
custom_ticks = [0, np.pi/2, np.pi, 3*np.pi/2, 2*np.pi]
ax.set_xticks(custom_ticks)
ax.set_xticklabels(['0', 'π/2', 'π', '3π/2', '2π'])

# Set ticks to be animated
for tick in ax.xaxis.get_major_ticks() + ax.yaxis.get_major_ticks():
    tick.set_animated(True)

# Add a title with the website name
plt.title('Custom Tick Locations with Animation - how2matplotlib.com')

plt.show()
Output:
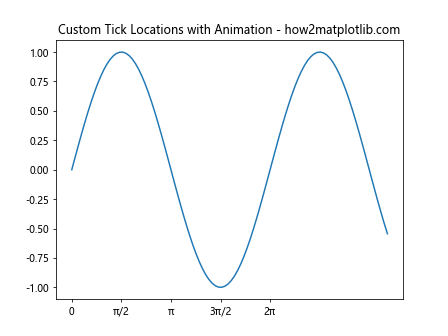
In this example, we set custom tick locations for a sine wave plot and then set these custom ticks to be animated.
Using Matplotlib.axis.Tick.set_animated() in Histogram Plots
The set_animated() function can be useful in histogram plots, especially when creating animated histograms. Here’s an example:
import matplotlib.pyplot as plt
import numpy as np

# Create some random data
data = np.random.randn(1000)

# Create a figure and axis
fig, ax = plt.subplots()

# Create the histogram
n, bins, patches = ax.hist(data, bins=30, edgecolor='black')

# Set ticks to be animated
for tick in ax.xaxis.get_major_ticks() + ax.yaxis.get_major_ticks():
    tick.set_animated(True)

# Add a title with the website name
plt.title('Histogram with Animated Ticks - how2matplotlib.com')

plt.show()
Output:
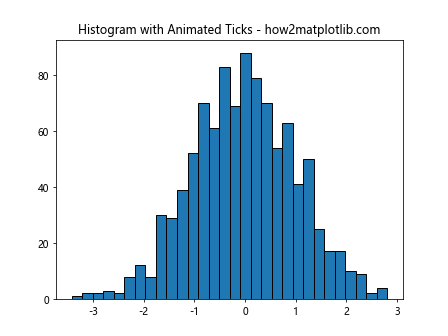
In this example, we create a histogram and set all ticks to be animated, which can be useful if we want to update the histogram dynamically.
Matplotlib.axis.Tick.set_animated() in Stacked Plots
The set_animated() function can be particularly useful in stacked plots. Here’s an example:
import matplotlib.pyplot as plt
import numpy as np

# Create some data
categories = ['A', 'B', 'C', 'D']
values1 = [1, 2, 3, 4]
values2 = [2, 3, 4, 5]
values3 = [3, 4, 5, 6]

# Create a figure and axis
fig, ax = plt.subplots()

# Create the stacked bar plot
ax.bar(categories, values1, label='Series 1')
ax.bar(categories, values2, bottom=values1, label='Series 2')
ax.bar(categories, values3, bottom=np.array(values1) + np.array(values2), label='Series 3')

# Set ticks to be animated
for tick in ax.xaxis.get_major_ticks() + ax.yaxis.get_major_ticks():
    tick.set_animated(True)

# Add legend and title
ax.legend()
plt.title('Stacked Plot with Animated Ticks - how2matplotlib.com')

plt.show()
Output:
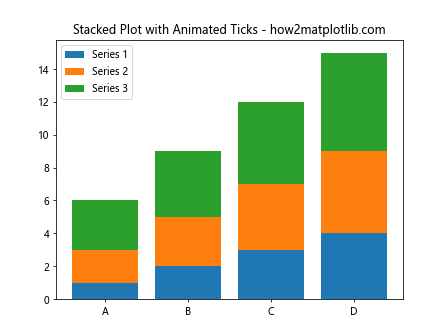
In this example, we create a stacked bar plot and set all ticks to be animated, which can be useful for efficiently updating the plot during animations.
Conclusion: Mastering Matplotlib.axis.Tick.set_animated() for Enhanced Visualizations
Throughout this comprehensive guide, we’ve explored the Matplotlib.axis.Tick.set_animated() function in Python, demonstrating its versatility and importance in creating dynamic and efficient visualizations. From basic usage to advanced applications in various types of plots, we’ve seen how this function can significantly enhance the performance of animated plots.
The Matplotlib.axis.Tick.set_animated() function is a powerful tool in the Matplotlib library, allowing for fine-grained control over the animation behavior of tick marks. By setting ticks to be animated, we can create smoother and more efficient animations, particularly in complex plots with multiple elements.