Comprehensive Guide to Matplotlib.axis.Tick.set_alpha() Function in Python
Matplotlib.axis.Tick.set_alpha() function in Python is a powerful tool for customizing the appearance of tick marks on plot axes. This function allows you to adjust the transparency of tick marks, providing greater control over the visual presentation of your plots. In this comprehensive guide, we’ll explore the Matplotlib.axis.Tick.set_alpha() function in depth, covering its usage, parameters, and various applications in data visualization.
Understanding the Matplotlib.axis.Tick.set_alpha() Function
The Matplotlib.axis.Tick.set_alpha() function is a method of the Tick class in Matplotlib’s axis module. It is used to set the alpha (transparency) value of tick marks on an axis. The alpha value ranges from 0 (completely transparent) to 1 (completely opaque). By adjusting this value, you can control how prominently the tick marks appear on your plot.
Let’s start with a simple example to demonstrate the basic usage of Matplotlib.axis.Tick.set_alpha():
import matplotlib.pyplot as plt

# Create a simple plot
fig, ax = plt.subplots()
ax.plot([1, 2, 3, 4], [1, 4, 2, 3])

# Set the alpha value for x-axis ticks
for tick in ax.xaxis.get_major_ticks():
    tick.set_alpha(0.5)

plt.title('How to use Matplotlib.axis.Tick.set_alpha() - how2matplotlib.com')
plt.show()
Output:
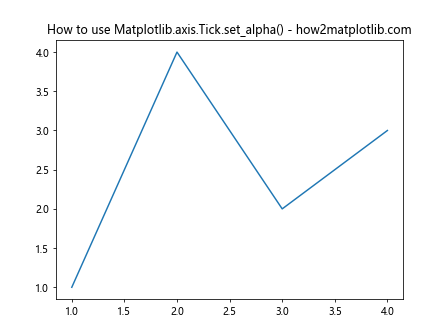
In this example, we create a simple line plot and then use Matplotlib.axis.Tick.set_alpha() to set the alpha value of the x-axis ticks to 0.5, making them semi-transparent.
Syntax and Parameters of Matplotlib.axis.Tick.set_alpha()
The syntax for the Matplotlib.axis.Tick.set_alpha() function is straightforward:
Tick.set_alpha(alpha)
The function takes a single parameter:
alpha: A float value between 0 and 1, representing the desired transparency level. 0 is completely transparent, and 1 is completely opaque.
It’s important to note that Matplotlib.axis.Tick.set_alpha() does not return any value. It modifies the tick object in place.
Applying Matplotlib.axis.Tick.set_alpha() to Different Axis Types
Matplotlib.axis.Tick.set_alpha() can be applied to both x-axis and y-axis ticks. Let’s see an example that demonstrates this:
import matplotlib.pyplot as plt

fig, ax = plt.subplots()
ax.plot([1, 2, 3, 4], [1, 4, 2, 3])

# Set alpha for x-axis ticks
for tick in ax.xaxis.get_major_ticks():
    tick.set_alpha(0.3)

# Set alpha for y-axis ticks
for tick in ax.yaxis.get_major_ticks():
    tick.set_alpha(0.7)

plt.title('Matplotlib.axis.Tick.set_alpha() on both axes - how2matplotlib.com')
plt.show()
Output:
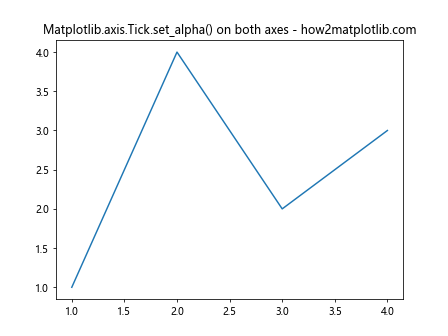
In this example, we set different alpha values for the x-axis and y-axis ticks, demonstrating how Matplotlib.axis.Tick.set_alpha() can be used to create visual hierarchy between different axis elements.
Using Matplotlib.axis.Tick.set_alpha() in Different Plot Types
Matplotlib.axis.Tick.set_alpha() can be applied to various types of plots. Let’s see how it works with different plot types:
Bar Plot
import matplotlib.pyplot as plt
import numpy as np

categories = ['A', 'B', 'C', 'D']
values = [3, 7, 2, 5]

fig, ax = plt.subplots()
ax.bar(categories, values)

for tick in ax.xaxis.get_major_ticks():
    tick.set_alpha(0.6)

plt.title('Matplotlib.axis.Tick.set_alpha() in Bar Plot - how2matplotlib.com')
plt.show()
Output:
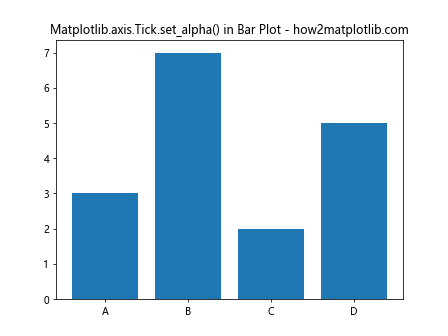
This example demonstrates how Matplotlib.axis.Tick.set_alpha() can be used to adjust the transparency of ticks in a bar plot.
Scatter Plot
import matplotlib.pyplot as plt
import numpy as np

x = np.random.rand(50)
y = np.random.rand(50)

fig, ax = plt.subplots()
ax.scatter(x, y)

for tick in ax.xaxis.get_major_ticks() + ax.yaxis.get_major_ticks():
    tick.set_alpha(0.4)

plt.title('Matplotlib.axis.Tick.set_alpha() in Scatter Plot - how2matplotlib.com')
plt.show()
Output:
Here, we apply Matplotlib.axis.Tick.set_alpha() to both x-axis and y-axis ticks in a scatter plot.
Advanced Applications of Matplotlib.axis.Tick.set_alpha()
Let’s explore some more advanced applications of the Matplotlib.axis.Tick.set_alpha() function:
Gradient Alpha Values
We can create a gradient effect by applying different alpha values to different ticks:
import matplotlib.pyplot as plt
import numpy as np

fig, ax = plt.subplots()
ax.plot(np.random.rand(10))

for i, tick in enumerate(ax.xaxis.get_major_ticks()):
    alpha = (i + 1) / len(ax.xaxis.get_major_ticks())
    tick.set_alpha(alpha)

plt.title('Gradient Alpha with Matplotlib.axis.Tick.set_alpha() - how2matplotlib.com')
plt.show()
Output:
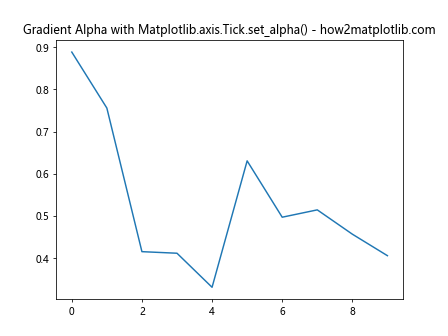
This example creates a gradient effect on the x-axis ticks, with the alpha value increasing from left to right.
Matplotlib.axis.Tick.set_alpha() in Subplots
Matplotlib.axis.Tick.set_alpha() can also be applied to individual subplots:
import matplotlib.pyplot as plt
import numpy as np

fig, (ax1, ax2) = plt.subplots(1, 2, figsize=(10, 5))

ax1.plot(np.random.rand(10))
ax2.plot(np.random.rand(10))

for tick in ax1.xaxis.get_major_ticks():
    tick.set_alpha(0.3)

for tick in ax2.xaxis.get_major_ticks():
    tick.set_alpha(0.7)

plt.suptitle('Matplotlib.axis.Tick.set_alpha() in Subplots - how2matplotlib.com')
plt.show()
Output:
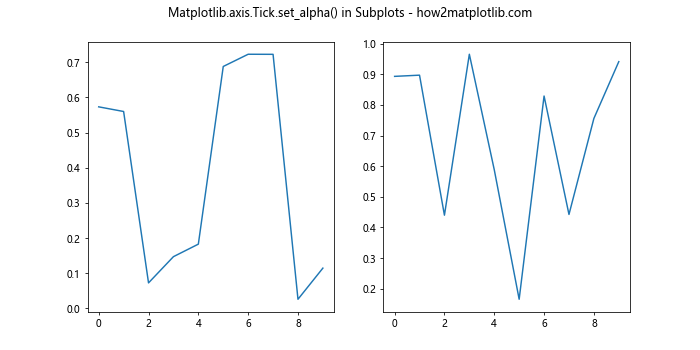
This example demonstrates how to apply different alpha values to ticks in different subplots.
Combining Matplotlib.axis.Tick.set_alpha() with Tick Locators
Matplotlib.axis.Tick.set_alpha() can be used in combination with tick locators to create more complex tick arrangements:
import matplotlib.pyplot as plt
import numpy as np
from matplotlib.ticker import MultipleLocator

fig, ax = plt.subplots()
ax.plot(np.random.rand(20))

ax.xaxis.set_major_locator(MultipleLocator(5))
ax.xaxis.set_minor_locator(MultipleLocator(1))

for tick in ax.xaxis.get_major_ticks():
    tick.set_alpha(1.0)

for tick in ax.xaxis.get_minor_ticks():
    tick.set_alpha(0.3)

plt.title('Matplotlib.axis.Tick.set_alpha() with Tick Locators - how2matplotlib.com')
plt.show()
Output:
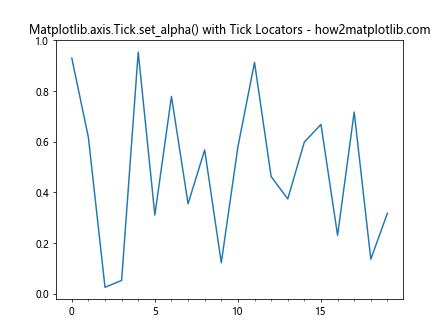
In this example, we use Matplotlib.axis.Tick.set_alpha() to differentiate between major and minor ticks, making the major ticks more prominent.
Matplotlib.axis.Tick.set_alpha() in 3D Plots
Matplotlib.axis.Tick.set_alpha() can also be applied to 3D plots:
import matplotlib.pyplot as plt
import numpy as np
from mpl_toolkits.mplot3d import Axes3D

fig = plt.figure()
ax = fig.add_subplot(111, projection='3d')

x = np.random.rand(100)
y = np.random.rand(100)
z = np.random.rand(100)
ax.scatter(x, y, z)

for axis in [ax.xaxis, ax.yaxis, ax.zaxis]:
    for tick in axis.get_major_ticks():
        tick.set_alpha(0.5)

plt.title('Matplotlib.axis.Tick.set_alpha() in 3D Plot - how2matplotlib.com')
plt.show()
Output:
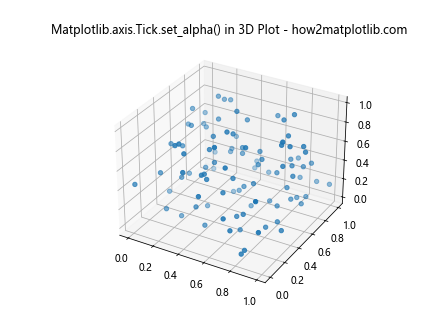
This example shows how to apply Matplotlib.axis.Tick.set_alpha() to all three axes in a 3D scatter plot.
Matplotlib.axis.Tick.set_alpha() in Polar Plots
Matplotlib.axis.Tick.set_alpha() can also be applied to polar plots:
import matplotlib.pyplot as plt
import numpy as np

fig, ax = plt.subplots(subplot_kw=dict(projection='polar'))
r = np.arange(0, 2, 0.01)
theta = 2 * np.pi * r
ax.plot(theta, r)

for tick in ax.xaxis.get_major_ticks():
    tick.set_alpha(0.5)

plt.title('Matplotlib.axis.Tick.set_alpha() in Polar Plot - how2matplotlib.com')
plt.show()
Output:
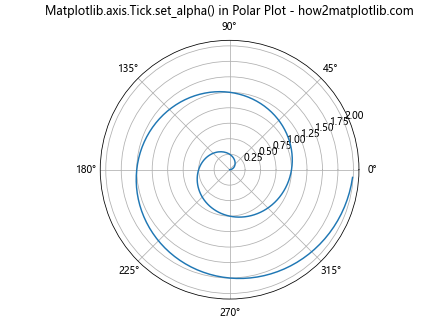
This example demonstrates how to apply Matplotlib.axis.Tick.set_alpha() to the radial ticks in a polar plot.
Combining Matplotlib.axis.Tick.set_alpha() with Custom Tick Formatters
We can use Matplotlib.axis.Tick.set_alpha() in combination with custom tick formatters:
import matplotlib.pyplot as plt
import numpy as np

def custom_formatter(x, pos):
    return f'{x:.2f}'

fig, ax = plt.subplots()
ax.plot(np.random.rand(10))

ax.xaxis.set_major_formatter(plt.FuncFormatter(custom_formatter))

for tick in ax.xaxis.get_major_ticks():
    tick.set_alpha(0.7)

plt.title('Matplotlib.axis.Tick.set_alpha() with Custom Formatter - how2matplotlib.com')
plt.show()
Output:
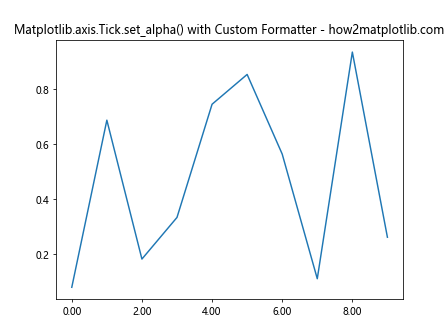
In this example, we use a custom formatter to display tick labels with two decimal places and then apply Matplotlib.axis.Tick.set_alpha() to adjust their transparency.
Matplotlib.axis.Tick.set_alpha() in Logarithmic Scales
Matplotlib.axis.Tick.set_alpha() can be used effectively with logarithmic scales:
import matplotlib.pyplot as plt
import numpy as np

fig, ax = plt.subplots()
ax.plot(np.logspace(0, 2, 100))
ax.set_xscale('log')

for tick in ax.xaxis.get_major_ticks():
    tick.set_alpha(0.8)

for tick in ax.xaxis.get_minor_ticks():
    tick.set_alpha(0.3)

plt.title('Matplotlib.axis.Tick.set_alpha() in Log Scale - how2matplotlib.com')
plt.show()
Output:
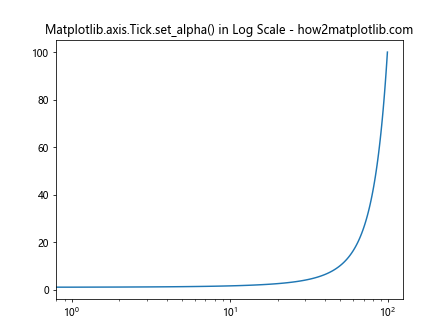
This example shows how to use Matplotlib.axis.Tick.set_alpha() to differentiate between major and minor ticks in a logarithmic scale.
Conclusion
The Matplotlib.axis.Tick.set_alpha() function is a versatile tool for customizing the appearance of tick marks in Matplotlib plots. By adjusting the transparency of ticks, you can create more visually appealing and informative visualizations. Whether you’re working with simple line plots, complex 3D visualizations, or animated graphs, Matplotlib.axis.Tick.set_alpha() provides a simple yet powerful way to enhance your plots.
Throughout this guide, we’ve explored various applications of Matplotlib.axis.Tick.set_alpha(), from basic usage to advanced techniques. We’ve seen how it can be combined with other Matplotlib functions to create sophisticated visual effects, and how it can be applied to different types of plots and axes.
Remember that the key to effective data visualization is finding the right balance between aesthetics and clarity. While Matplotlib.axis.Tick.set_alpha() allows for creative customization, it’s important to use it judiciously to ensure that your plots remain easy to read and interpret.