How to Create a Text Box with Line Wrapping in Matplotlib
Text box with line wrapping in Matplotlib is an essential feature for data visualization and annotation. This article will explore various aspects of creating and customizing text boxes with line wrapping in Matplotlib, providing detailed explanations and practical examples. We’ll cover everything from basic text box creation to advanced customization techniques, ensuring you have a thorough understanding of how to implement text boxes with line wrapping in your Matplotlib plots.
Understanding Text Boxes in Matplotlib
Text boxes with line wrapping in Matplotlib allow you to add annotations, labels, or explanatory text to your plots while automatically wrapping long lines of text. This feature is particularly useful when you need to include detailed information without cluttering your visualization or extending beyond the plot boundaries.
Let’s start with a basic example of creating a text box with line wrapping in Matplotlib:
import matplotlib.pyplot as plt

fig, ax = plt.subplots(figsize=(8, 6))

text = "This is a text box with line wrapping in Matplotlib. Visit how2matplotlib.com for more information on data visualization techniques."

ax.text(0.5, 0.5, text, ha='center', va='center', wrap=True, bbox=dict(facecolor='white', edgecolor='black'))

plt.title("Text Box with Line Wrapping in Matplotlib")
plt.axis('off')
plt.show()
Output:
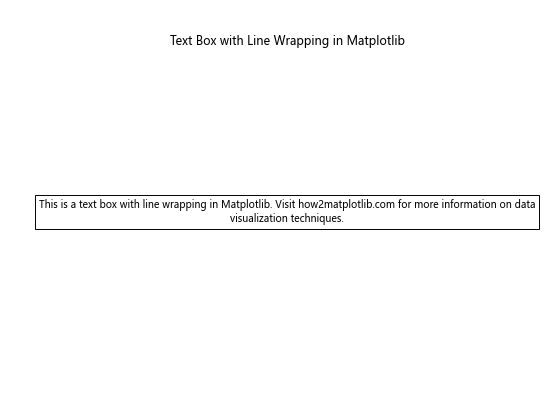
In this example, we create a simple plot and add a text box with line wrapping. The wrap=True parameter enables automatic line wrapping, while the bbox parameter adds a bounding box around the text.
Creating Text Boxes with Line Wrapping
To create a text box with line wrapping in Matplotlib, you can use the text() function and set the wrap parameter to True. Here’s an example demonstrating this technique:
import matplotlib.pyplot as plt

fig, ax = plt.subplots(figsize=(8, 6))

long_text = "This is a long text that will be wrapped automatically in Matplotlib. Learn more about text boxes with line wrapping at how2matplotlib.com."

ax.text(0.1, 0.5, long_text, wrap=True, fontsize=12, bbox=dict(facecolor='lightgray', edgecolor='black', alpha=0.7))

plt.title("Text Box with Automatic Line Wrapping")
plt.axis('off')
plt.show()
Output:
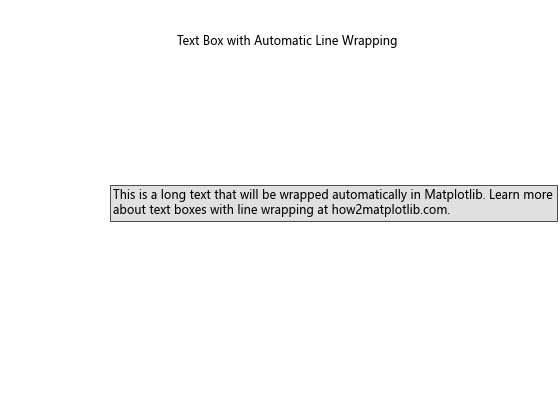
In this example, we create a text box with a long string of text. The wrap=True parameter ensures that the text is automatically wrapped to fit within the specified width.
Customizing Text Box Appearance
You can customize the appearance of text boxes with line wrapping in Matplotlib by adjusting various parameters. Let’s explore some customization options:
Changing Font Properties
import matplotlib.pyplot as plt

fig, ax = plt.subplots(figsize=(8, 6))

text = "Customize font properties of text boxes with line wrapping in Matplotlib. Visit how2matplotlib.com for more tips."

ax.text(0.5, 0.5, text, wrap=True, fontsize=14, fontweight='bold', fontfamily='serif', color='navy', ha='center', va='center')

plt.title("Customized Font Properties in Text Box")
plt.axis('off')
plt.show()
Output:
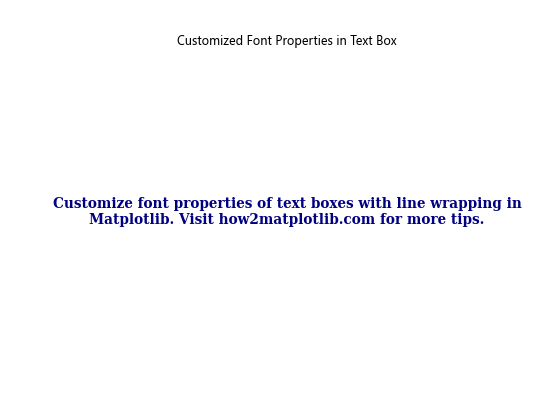
This example demonstrates how to change font properties such as size, weight, family, and color for the text in the text box.
Adjusting Box Style
import matplotlib.pyplot as plt

fig, ax = plt.subplots(figsize=(8, 6))

text = "Customize the box style of text boxes with line wrapping in Matplotlib. Learn more at how2matplotlib.com."

ax.text(0.5, 0.5, text, wrap=True, bbox=dict(facecolor='lightyellow', edgecolor='darkgreen', boxstyle='round,pad=0.5', alpha=0.8), ha='center', va='center')

plt.title("Customized Box Style in Text Box")
plt.axis('off')
plt.show()
Output:
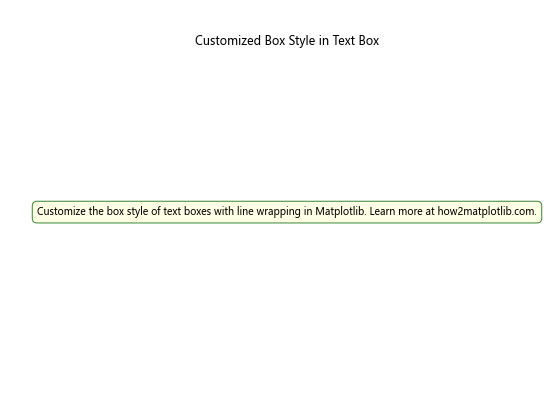
This example shows how to customize the box style, including background color, edge color, box style, and transparency.
Adding Multiple Text Boxes
You can add multiple text boxes with line wrapping to a single plot in Matplotlib. Here’s an example:
import matplotlib.pyplot as plt

fig, ax = plt.subplots(figsize=(10, 8))

text1 = "This is the first text box with line wrapping in Matplotlib. Visit how2matplotlib.com for more examples."
text2 = "This is the second text box with different styling. Customize text boxes to suit your needs."

ax.text(0.1, 0.8, text1, wrap=True, fontsize=12, bbox=dict(facecolor='lightgreen', edgecolor='green'))
ax.text(0.6, 0.3, text2, wrap=True, fontsize=12, bbox=dict(facecolor='lightpink', edgecolor='red'))

plt.title("Multiple Text Boxes with Line Wrapping")
plt.axis('off')
plt.show()
Output:
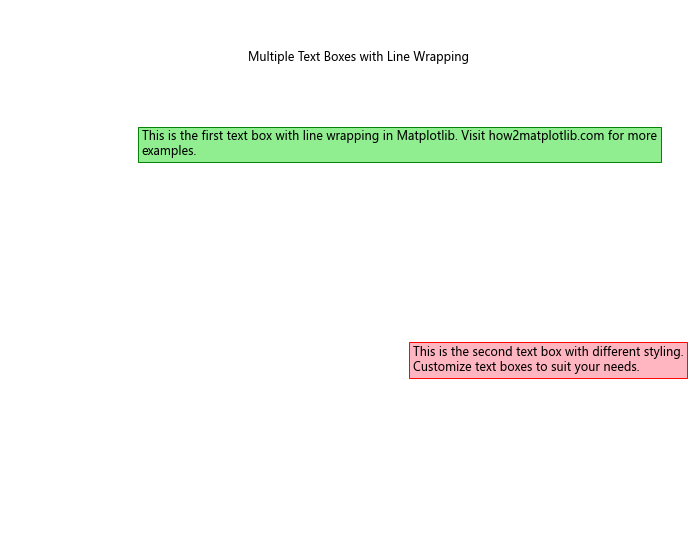
This example demonstrates how to add multiple text boxes with different styles and positions on the same plot.
Aligning Text in Text Boxes
You can control the alignment of text within text boxes using the ha (horizontal alignment) and va (vertical alignment) parameters. Here’s an example:
import matplotlib.pyplot as plt

fig, ax = plt.subplots(figsize=(8, 6))

text = "Align text within text boxes in Matplotlib. Adjust horizontal and vertical alignment for better presentation. Learn more at how2matplotlib.com."

ax.text(0.5, 0.5, text, wrap=True, ha='center', va='center', bbox=dict(facecolor='lightyellow', edgecolor='orange'))

plt.title("Text Alignment in Text Box")
plt.axis('off')
plt.show()
Output:
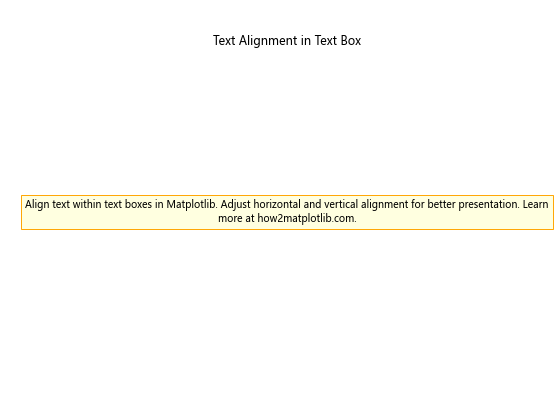
This example shows how to center-align the text both horizontally and vertically within the text box.
Using Text Boxes for Annotations
Text boxes with line wrapping are particularly useful for adding annotations to plots. Here’s an example:
import matplotlib.pyplot as plt
import numpy as np

fig, ax = plt.subplots(figsize=(10, 6))

x = np.linspace(0, 10, 100)
y = np.sin(x)

ax.plot(x, y)

annotation = "This plot shows a sine wave. Text boxes with line wrapping in Matplotlib are useful for adding detailed annotations. Visit how2matplotlib.com for more plotting techniques."

ax.text(5, 0.5, annotation, wrap=True, fontsize=10, bbox=dict(facecolor='white', edgecolor='black', alpha=0.7))

plt.title("Using Text Box for Plot Annotation")
plt.xlabel("X-axis")
plt.ylabel("Y-axis")
plt.show()
Output:
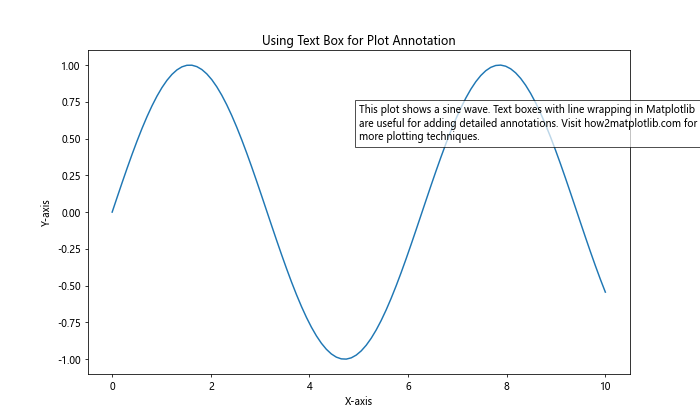
This example demonstrates how to use a text box with line wrapping to add a detailed annotation to a plot of a sine wave.
Rotating Text in Text Boxes
You can rotate text within text boxes using the rotation parameter. Here’s an example:
import matplotlib.pyplot as plt

fig, ax = plt.subplots(figsize=(8, 6))

text = "Rotate text in text boxes with line wrapping in Matplotlib. This can be useful for creating unique layouts. Learn more at how2matplotlib.com."

ax.text(0.5, 0.5, text, wrap=True, rotation=45, ha='center', va='center', bbox=dict(facecolor='lavender', edgecolor='purple'))

plt.title("Rotated Text in Text Box")
plt.axis('off')
plt.show()
Output:
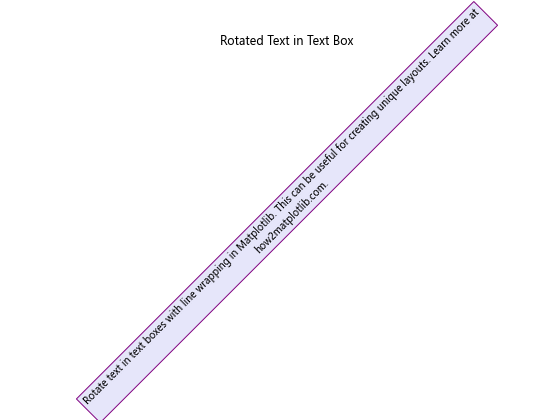
This example shows how to rotate the text within a text box by 45 degrees.
Adding Text Boxes to Subplots
You can add text boxes with line wrapping to individual subplots in Matplotlib. Here’s an example:
import matplotlib.pyplot as plt

fig, (ax1, ax2) = plt.subplots(1, 2, figsize=(12, 6))

text1 = "This is a text box in the first subplot. Text boxes with line wrapping in Matplotlib can be added to individual subplots. Visit how2matplotlib.com for more information."
text2 = "This is a text box in the second subplot. Customize each text box separately to suit your needs."

ax1.text(0.5, 0.5, text1, wrap=True, ha='center', va='center', bbox=dict(facecolor='lightcyan', edgecolor='blue'))
ax2.text(0.5, 0.5, text2, wrap=True, ha='center', va='center', bbox=dict(facecolor='mistyrose', edgecolor='red'))

ax1.set_title("Subplot 1")
ax2.set_title("Subplot 2")
ax1.axis('off')
ax2.axis('off')

plt.tight_layout()
plt.show()
Output:
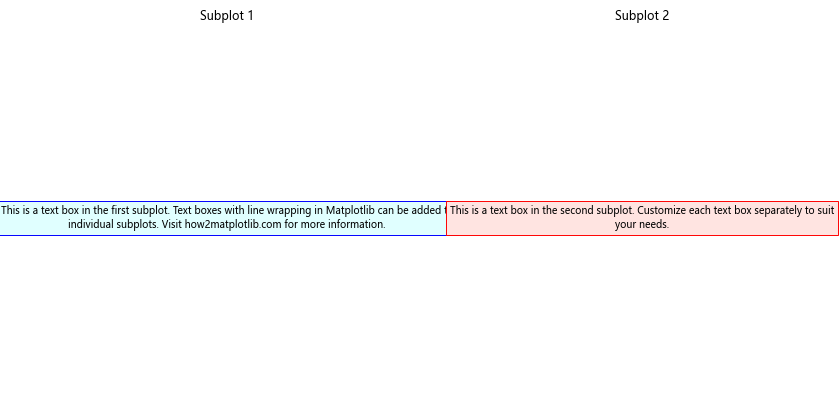
This example demonstrates how to add text boxes with line wrapping to two separate subplots.
Using Text Boxes for Legends
Text boxes with line wrapping can be used to create custom legends in Matplotlib. Here’s an example:
import matplotlib.pyplot as plt
import numpy as np

fig, ax = plt.subplots(figsize=(10, 6))

x = np.linspace(0, 10, 100)
y1 = np.sin(x)
y2 = np.cos(x)

ax.plot(x, y1, 'b-', label='Sine')
ax.plot(x, y2, 'r-', label='Cosine')

legend_text = "Blue line: Sine wave\nRed line: Cosine wave\n\nText boxes with line wrapping in Matplotlib can be used to create custom legends. Visit how2matplotlib.com for more plotting tips."

ax.text(1.05, 0.5, legend_text, transform=ax.transAxes, wrap=True, fontsize=10, bbox=dict(facecolor='white', edgecolor='gray'))

plt.title("Custom Legend Using Text Box")
plt.xlabel("X-axis")
plt.ylabel("Y-axis")
plt.tight_layout()
plt.show()
Output:
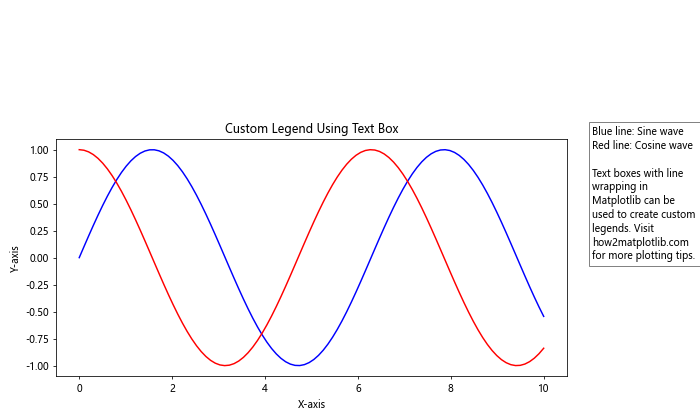
This example shows how to use a text box with line wrapping to create a custom legend for a plot with multiple lines.
Adjusting Text Box Position
You can adjust the position of text boxes with line wrapping using different coordinate systems. Here’s an example using axis coordinates:
import matplotlib.pyplot as plt

fig, ax = plt.subplots(figsize=(8, 6))

text = "Adjust the position of text boxes with line wrapping in Matplotlib using different coordinate systems. This example uses axis coordinates. Learn more at how2matplotlib.com."

ax.text(0.1, 0.9, text, wrap=True, transform=ax.transAxes, fontsize=12, bbox=dict(facecolor='lightyellow', edgecolor='orange'))

plt.title("Adjusting Text Box Position")
plt.axis('off')
plt.show()
Output:
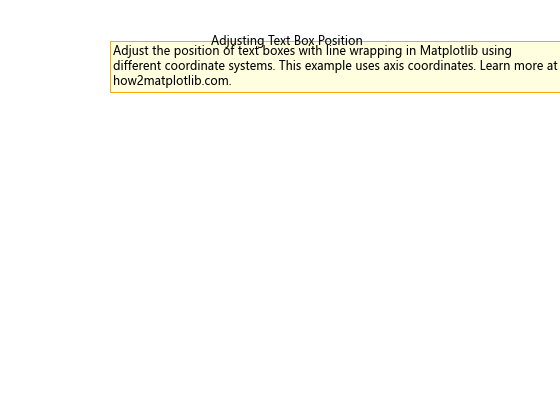
This example demonstrates how to position a text box in the upper-left corner of the plot using axis coordinates.
Creating Callouts with Text Boxes
Text boxes with line wrapping can be used to create callouts or speech bubbles in Matplotlib. Here’s an example:
import matplotlib.pyplot as plt
import numpy as np

fig, ax = plt.subplots(figsize=(10, 6))

x = np.linspace(0, 10, 100)
y = np.sin(x)

ax.plot(x, y)

callout_text = "This is a callout using a text box with line wrapping in Matplotlib. Use this technique to highlight specific points in your plot. Visit how2matplotlib.com for more visualization tips."

ax.annotate(callout_text, xy=(5, 0), xytext=(6, 0.5), wrap=True, fontsize=10,
            bbox=dict(boxstyle="round,pad=0.5", fc="white", ec="gray", alpha=0.8),
            arrowprops=dict(arrowstyle="->", connectionstyle="arc3,rad=0.3"))

plt.title("Callout Using Text Box with Line Wrapping")
plt.xlabel("X-axis")
plt.ylabel("Y-axis")
plt.show()
Output:
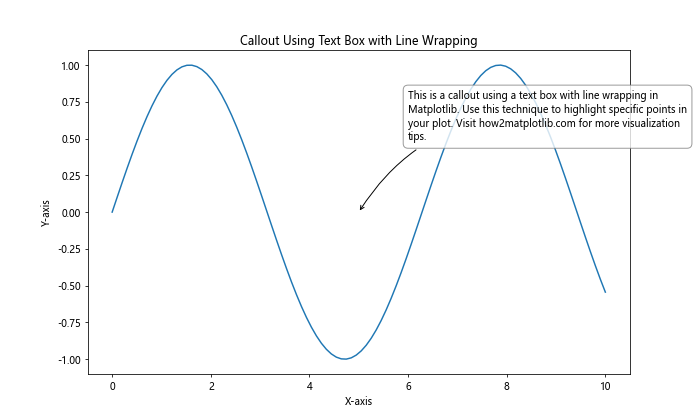
This example shows how to create a callout using a text box with line wrapping and an arrow pointing to a specific point on the plot.
Handling Long Words in Text Boxes
When dealing with very long words, you may need to adjust the text wrapping behavior. Here’s an example of how to handle long words in text boxes:
import matplotlib.pyplot as plt
import textwrap

fig, ax = plt.subplots(figsize=(8, 6))

long_word_text = "This text contains a verylongwordthatneedstobebroken. Text boxes with line wrapping in Matplotlib may need special handling for long words. Visit how2matplotlib.com for more information on text formatting."

wrapped_text = textwrap.fill(long_word_text, width=30, break_long_words=True)

ax.text(0.1, 0.5, wrapped_text, wrap=True, fontsize=12, bbox=dict(facecolor='lightgreen', edgecolor='green'))

plt.title("Handling Long Words in Text Boxes")
plt.axis('off')
plt.show()
Output:
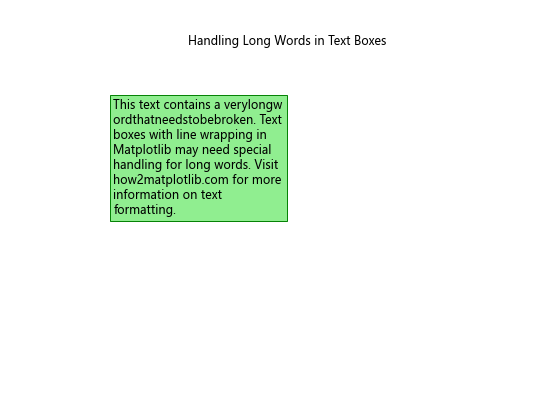
This example demonstrates how to use the textwrap module to handle very long words in text boxes with line wrapping.
Adding Hyperlinks to Text Boxes
You can add clickable hyperlinks to text boxes with line wrapping in Matplotlib. Here’s an example:
import matplotlib.pyplot as plt

fig, ax = plt.subplots(figsize=(8, 6))

text = "Text boxes with line wrapping in Matplotlib can include hyperlinks. Click here to visit how2matplotlib.com for more information on data visualization techniques."

ax.text(0.5, 0.5, text, wrap=True, fontsize=12, ha='center', va='center',
        bbox=dict(facecolor='lightblue', edgecolor='blue', alpha=0.8),
        url='http://how2matplotlib.com')

plt.title("Text Box with Hyperlink")
plt.axis('off')
plt.show()
Output:
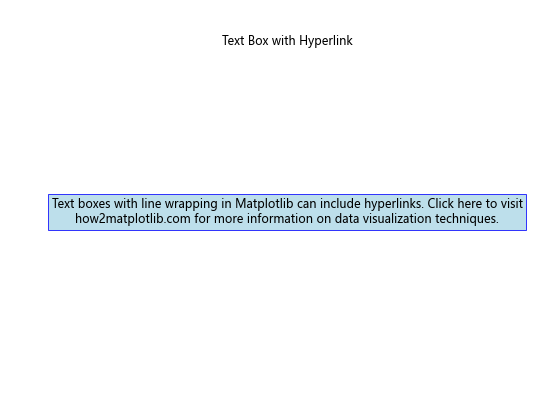
This example shows how to add a clickable hyperlink to a text box using the url parameter.
Conclusion
Text boxes with line wrapping in Matplotlib are versatile tools for adding annotations, explanations, and custom elements to your plots. By mastering the techniques covered in this article, you can create more informative and visually appealing visualizations. Remember to experiment with different styles, positions, and content to find the best way to present information in your plots.
Whether you’re creating simple annotations or complex custom legends, text boxes with line wrapping offer flexibility and control over how text is displayed in your Matplotlib figures. By combining the various techniques discussed here, you can create professional-looking plots that effectively communicate your data and insights.