How to Style Plots using Matplotlib
Style Plots using Matplotlib is an essential skill for data visualization in Python. Matplotlib offers a wide range of styling options to create visually appealing and informative plots. In this comprehensive guide, we’ll explore various techniques to style plots using Matplotlib, from basic customization to advanced styling methods. By the end of this article, you’ll have a thorough understanding of how to style plots using Matplotlib to create professional-looking visualizations.
Introduction to Styling Plots using Matplotlib
Matplotlib is a powerful plotting library in Python that allows users to create a wide variety of static, animated, and interactive visualizations. One of the key features of Matplotlib is its flexibility in styling plots. When you style plots using Matplotlib, you can customize almost every aspect of your visualization, including colors, fonts, line styles, markers, and more.
Before we dive into the specifics of how to style plots using Matplotlib, let’s start with a basic example to illustrate the importance of styling:
import matplotlib.pyplot as plt
import numpy as np

x = np.linspace(0, 10, 100)
y = np.sin(x)

plt.plot(x, y)
plt.title('How to Style Plots using Matplotlib - Basic Example')
plt.xlabel('X-axis')
plt.ylabel('Y-axis')
plt.text(5, 0.5, 'how2matplotlib.com', fontsize=12)
plt.show()
Output:
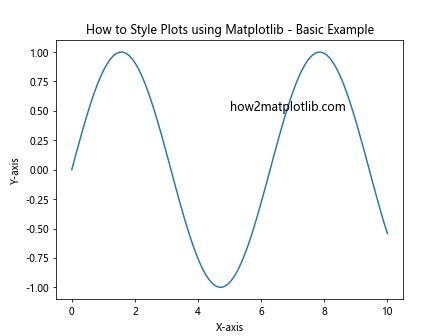
This code creates a simple sine wave plot without any custom styling. As we progress through this guide, we’ll learn how to style plots using Matplotlib to transform this basic plot into a visually appealing and informative visualization.
Basic Plot Styling using Matplotlib
When you start to style plots using Matplotlib, it’s essential to understand the basic styling options available. These include changing colors, line styles, markers, and adjusting plot elements like titles, labels, and legends.
Changing Colors when Styling Plots using Matplotlib
One of the simplest ways to style plots using Matplotlib is by changing the colors of plot elements. You can specify colors using color names, hex codes, or RGB values.
import matplotlib.pyplot as plt
import numpy as np

x = np.linspace(0, 10, 100)
y1 = np.sin(x)
y2 = np.cos(x)

plt.plot(x, y1, color='blue', label='Sine')
plt.plot(x, y2, color='#FF5733', label='Cosine')
plt.title('How to Style Plots using Matplotlib - Color Example')
plt.xlabel('X-axis')
plt.ylabel('Y-axis')
plt.legend()
plt.text(5, 0.5, 'how2matplotlib.com', fontsize=12)
plt.show()
Output:
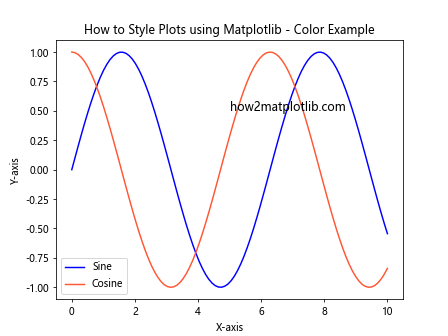
In this example, we’ve styled the plots using Matplotlib by setting the color of the sine wave to blue and the cosine wave to a custom orange color using its hex code.
Line Styles and Markers in Matplotlib Plot Styling
When you style plots using Matplotlib, you can also customize line styles and markers to differentiate between different data series or highlight specific points.
import matplotlib.pyplot as plt
import numpy as np

x = np.linspace(0, 10, 20)
y1 = np.sin(x)
y2 = np.cos(x)

plt.plot(x, y1, color='blue', linestyle='--', marker='o', label='Sine')
plt.plot(x, y2, color='red', linestyle=':', marker='s', label='Cosine')
plt.title('How to Style Plots using Matplotlib - Line and Marker Example')
plt.xlabel('X-axis')
plt.ylabel('Y-axis')
plt.legend()
plt.text(5, 0.5, 'how2matplotlib.com', fontsize=12)
plt.show()
Output:
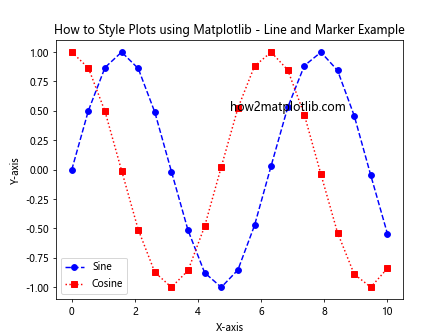
This example demonstrates how to style plots using Matplotlib by applying different line styles (dashed and dotted) and markers (circles and squares) to the sine and cosine waves.
Customizing Plot Elements
When you style plots using Matplotlib, it’s important to pay attention to plot elements such as titles, labels, and legends. Customizing these elements can greatly enhance the readability and professionalism of your plots.
import matplotlib.pyplot as plt
import numpy as np

x = np.linspace(0, 10, 100)
y = np.sin(x)

plt.plot(x, y)
plt.title('How to Style Plots using Matplotlib', fontsize=16, fontweight='bold')
plt.xlabel('X-axis', fontsize=12)
plt.ylabel('Y-axis', fontsize=12)
plt.legend(['Sine Wave'], loc='upper right')
plt.text(5, 0.5, 'how2matplotlib.com', fontsize=12, ha='center')
plt.grid(True, linestyle='--', alpha=0.7)
plt.show()
Output:
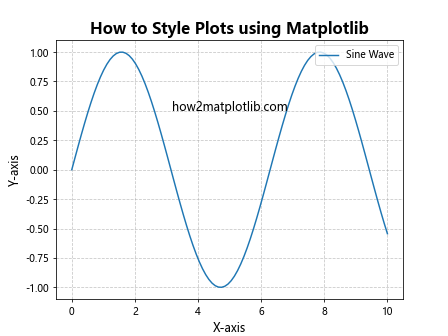
In this example, we’ve styled the plot using Matplotlib by customizing the title, axis labels, legend, and adding a grid. These modifications make the plot more informative and visually appealing.
Advanced Plot Styling Techniques in Matplotlib
As you become more comfortable with basic styling, you can explore advanced techniques to style plots using Matplotlib. These include customizing figure size and layout, using different plot types, and applying custom color maps.
Customizing Figure Size and Layout
When you style plots using Matplotlib, controlling the figure size and layout is crucial for creating visually balanced visualizations.
import matplotlib.pyplot as plt
import numpy as np

x = np.linspace(0, 10, 100)
y1 = np.sin(x)
y2 = np.cos(x)

fig, (ax1, ax2) = plt.subplots(1, 2, figsize=(12, 5))

ax1.plot(x, y1)
ax1.set_title('Sine Wave')
ax1.set_xlabel('X-axis')
ax1.set_ylabel('Y-axis')

ax2.plot(x, y2)
ax2.set_title('Cosine Wave')
ax2.set_xlabel('X-axis')
ax2.set_ylabel('Y-axis')

plt.suptitle('How to Style Plots using Matplotlib - Subplots Example', fontsize=16)
fig.text(0.5, 0.02, 'how2matplotlib.com', ha='center', fontsize=12)
plt.tight_layout()
plt.show()
Output:
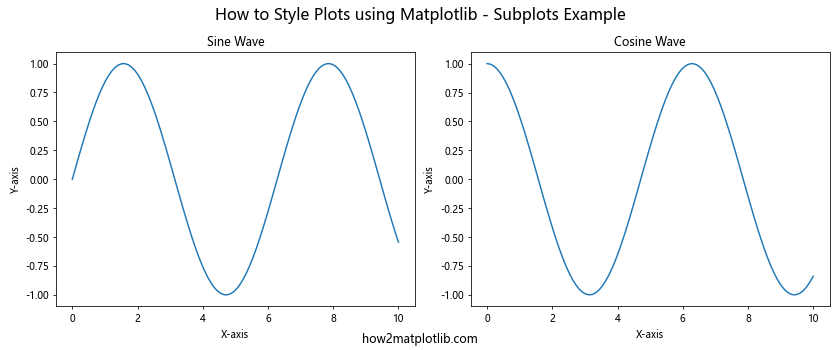
This example demonstrates how to style plots using Matplotlib by creating a figure with two subplots side by side, customizing the overall figure size, and adding a main title.
Using Different Plot Types
Matplotlib offers various plot types that you can use to visualize your data effectively. When you style plots using Matplotlib, choosing the right plot type is crucial for conveying your message clearly.
import matplotlib.pyplot as plt
import numpy as np

categories = ['A', 'B', 'C', 'D', 'E']
values = [23, 45, 56, 78, 32]

plt.figure(figsize=(10, 6))
plt.bar(categories, values, color='skyblue', edgecolor='navy')
plt.title('How to Style Plots using Matplotlib - Bar Chart Example', fontsize=16)
plt.xlabel('Categories', fontsize=12)
plt.ylabel('Values', fontsize=12)
plt.text(2, 40, 'how2matplotlib.com', fontsize=12, ha='center')
plt.ylim(0, 100)
for i, v in enumerate(values):
    plt.text(i, v + 3, str(v), ha='center')
plt.show()
Output:
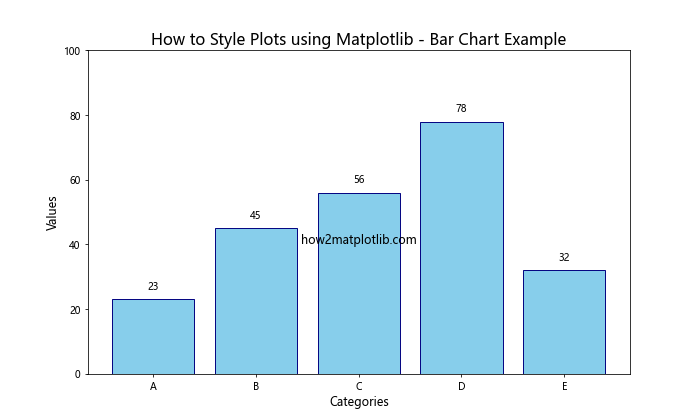
This example shows how to style plots using Matplotlib to create a bar chart with custom colors, labels, and data value annotations.
Applying Custom Color Maps
Color maps are an essential tool when you style plots using Matplotlib, especially for visualizations that represent continuous data or multiple categories.
import matplotlib.pyplot as plt
import numpy as np

x = np.linspace(0, 10, 100)
y = np.linspace(0, 10, 100)
X, Y = np.meshgrid(x, y)
Z = np.sin(X) * np.cos(Y)

plt.figure(figsize=(10, 8))
plt.contourf(X, Y, Z, cmap='viridis', levels=20)
plt.colorbar(label='Z values')
plt.title('How to Style Plots using Matplotlib - Contour Plot with Custom Colormap', fontsize=16)
plt.xlabel('X-axis', fontsize=12)
plt.ylabel('Y-axis', fontsize=12)
plt.text(5, -1, 'how2matplotlib.com', fontsize=12, ha='center')
plt.show()
Output:
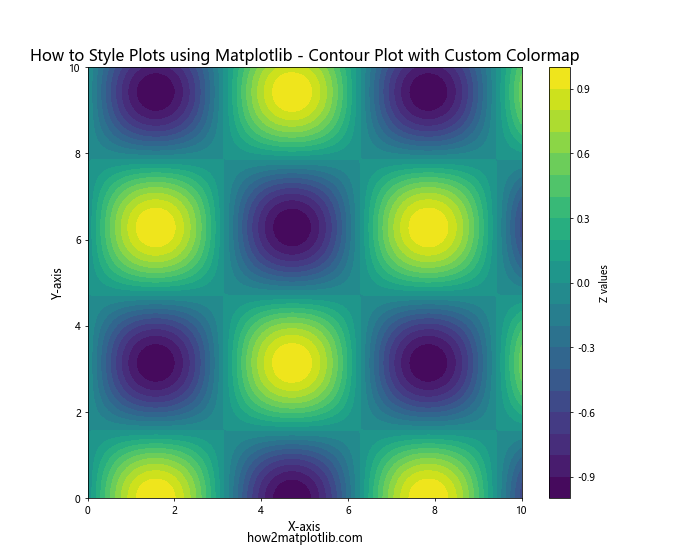
This example demonstrates how to style plots using Matplotlib by creating a contour plot with a custom color map (viridis) to represent a 2D function.
Fine-tuning Plot Aesthetics in Matplotlib
To truly master how to style plots using Matplotlib, you need to pay attention to the finer details that can elevate your visualizations from good to great. This includes adjusting axis properties, customizing tick marks and labels, and adding annotations.
Adjusting Axis Properties
When you style plots using Matplotlib, controlling the axis properties allows you to define the exact range and scale of your plot.
import matplotlib.pyplot as plt
import numpy as np

x = np.linspace(0, 10, 100)
y = np.exp(x)

plt.figure(figsize=(10, 6))
plt.plot(x, y)
plt.title('How to Style Plots using Matplotlib - Axis Customization', fontsize=16)
plt.xlabel('X-axis', fontsize=12)
plt.ylabel('Y-axis (log scale)', fontsize=12)
plt.text(5, np.exp(5), 'how2matplotlib.com', fontsize=12, ha='center')
plt.xlim(0, 10)
plt.ylim(1, 1e5)
plt.yscale('log')
plt.grid(True, which='both', linestyle='--', alpha=0.7)
plt.show()
Output:
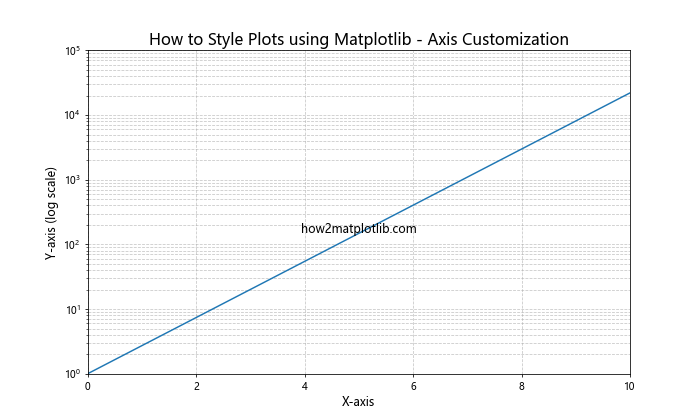
This example shows how to style plots using Matplotlib by customizing the axis limits, using a logarithmic scale for the y-axis, and adding a grid to both major and minor tick marks.
Customizing Tick Marks and Labels
Tick marks and labels play a crucial role in how readers interpret your plot. When you style plots using Matplotlib, customizing these elements can greatly improve the clarity of your visualization.
import matplotlib.pyplot as plt
import numpy as np

x = np.linspace(0, 2*np.pi, 100)
y = np.sin(x)

fig, ax = plt.subplots(figsize=(10, 6))
ax.plot(x, y)
ax.set_title('How to Style Plots using Matplotlib - Custom Ticks', fontsize=16)
ax.set_xlabel('X-axis (radians)', fontsize=12)
ax.set_ylabel('Y-axis', fontsize=12)

# Customize x-axis ticks
ax.set_xticks([0, np.pi/2, np.pi, 3*np.pi/2, 2*np.pi])
ax.set_xticklabels(['0', 'π/2', 'π', '3π/2', '2π'])

# Customize y-axis ticks
ax.set_yticks([-1, -0.5, 0, 0.5, 1])
ax.set_yticklabels(['-1', '-0.5', '0', '0.5', '1'])

ax.text(np.pi, 0, 'how2matplotlib.com', fontsize=12, ha='center')
plt.grid(True, linestyle='--', alpha=0.7)
plt.show()
Output:
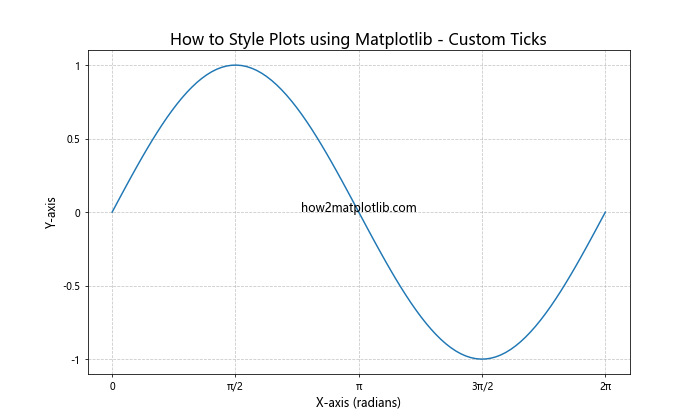
This example demonstrates how to style plots using Matplotlib by customizing the tick marks and labels for both the x and y axes, making the plot more readable for trigonometric functions.
Adding Annotations and Text
Annotations and text can provide valuable context and highlight important features in your plot. When you style plots using Matplotlib, strategic use of annotations can significantly enhance the information conveyed by your visualization.
import matplotlib.pyplot as plt
import numpy as np

x = np.linspace(0, 10, 100)
y = np.sin(x) * np.exp(-0.1 * x)

fig, ax = plt.subplots(figsize=(10, 6))
ax.plot(x, y)
ax.set_title('How to Style Plots using Matplotlib - Annotations', fontsize=16)
ax.set_xlabel('X-axis', fontsize=12)
ax.set_ylabel('Y-axis', fontsize=12)

# Add annotations
ax.annotate('Maximum', xy=(1.6, 0.9), xytext=(3, 0.8),
            arrowprops=dict(facecolor='black', shrink=0.05))
ax.annotate('Decay', xy=(8, 0.1), xytext=(6, 0.3),
            arrowprops=dict(facecolor='black', shrink=0.05))

ax.text(5, -0.5, 'Damped Sine Wave', fontsize=14, ha='center')
ax.text(5, -0.7, 'how2matplotlib.com', fontsize=12, ha='center')

plt.grid(True, linestyle='--', alpha=0.7)
plt.show()
Output:
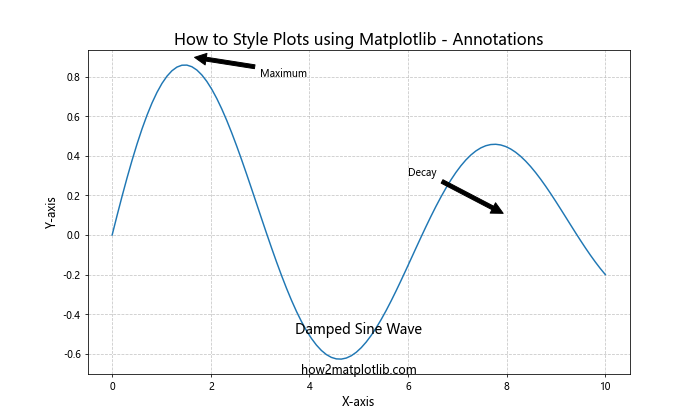
This example shows how to style plots using Matplotlib by adding annotations with arrows to highlight specific features of the plot, as well as descriptive text to provide context.
Advanced Styling Techniques in Matplotlib
As you become more proficient in styling plots using Matplotlib, you can explore advanced techniques to create even more sophisticated and informative visualizations.
3D Plotting in Matplotlib
Matplotlib supports 3D plotting, allowing you to create complex visualizations of three-dimensional data.
import matplotlib.pyplot as plt
import numpy as np
from mpl_toolkits.mplot3d import Axes3D

fig = plt.figure(figsize=(10, 8))
ax = fig.add_subplot(111, projection='3d')

x = np.linspace(-5, 5, 100)
y = np.linspace(-5, 5, 100)
X, Y = np.meshgrid(x, y)
Z = np.sin(np.sqrt(X**2 + Y**2))

surf = ax.plot_surface(X, Y, Z, cmap='viridis')
ax.set_title('How to Style Plots using Matplotlib - 3D Surface Plot', fontsize=16)
ax.set_xlabel('X-axis')
ax.set_ylabel('Y-axis')
ax.set_zlabel('Z-axis')
fig.colorbar(surf, shrink=0.5, aspect=5)
ax.text2D(0.5, -0.05, 'how2matplotlib.com', transform=ax.transAxes, ha='center')
plt.show()
Output:
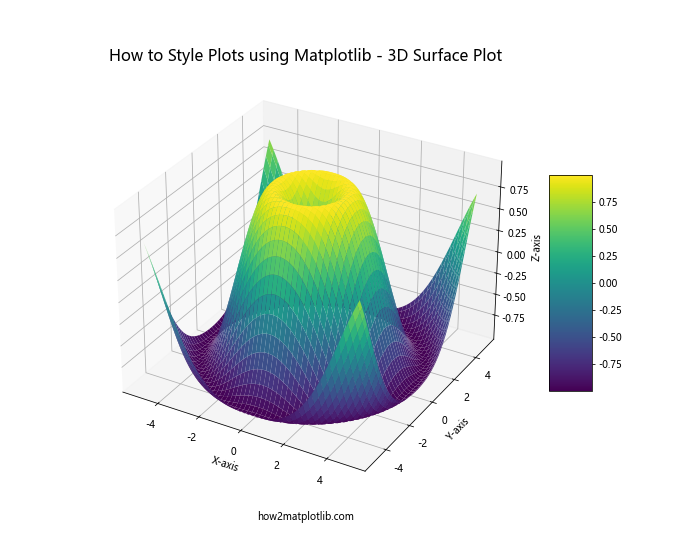
This example demonstrates how to style plots using Matplotlib to create a 3D surface plot with custom coloring and labels.
Animation in Matplotlib
Matplotlib also supports creating animated plots, which can be useful for visualizing time-series data or demonstrating changes over time.
import matplotlib.pyplot as plt
import numpy as np
from matplotlib.animation import FuncAnimation

fig, ax = plt.subplots(figsize=(10, 6))
ax.set_xlim(0, 2*np.pi)
ax.set_ylim(-1.1, 1.1)
line, = ax.plot([], [])
ax.set_title('How to Style Plots using Matplotlib - Animation', fontsize=16)
ax.set_xlabel('X-axis')
ax.set_ylabel('Y-axis')
ax.text(np.pi, -1.3, 'how2matplotlib.com', fontsize=12, ha='center')

def init():
    line.set_data([], [])
    return line,

def animate(i):
    x = np.linspace(0, 2*np.pi, 1000)
    y = np.sin(x + i/10)
    line.set_data(x, y)
    return line,

anim = FuncAnimation(fig, animate, init_func=init, frames=200, interval=20, blit=True)
plt.show()
Output:
This example shows how to style plots using Matplotlib to create an animated sine wave, demonstrating how to use animation features in Matplotlib.
Best Practices for Styling Plots using Matplotlib
When styling plots using Matplotlib, it’s important to follow best practices to ensure your visualizations are effective, informative, and visually appealing.
Clarity and Readability
When you style plots using Matplotlib, ensuring clarity and readability should be a top priority. This includes using appropriate font sizes, clear labels, and avoiding clutter.
import matplotlib.pyplot as plt
import numpy as np

plt.figure(figsize=(12, 8))

x = np.linspace(0, 10, 100)
y1 = np.exp(x/10)
y2 = x**2
y3 = np.log(x + 1) * 10

plt.plot(x, y1, label='Exponential', linewidth=2)
plt.plot(x, y2, label='Quadratic', linewidth=2)
plt.plot(x, y3, label='Logarithmic', linewidth=2)

plt.title('How to Style Plots using Matplotlib - Clear and Readable Plot', fontsize=18)
plt.xlabel('X-axis', fontsize=14)
plt.ylabel('Y-axis', fontsize=14)
plt.legend(fontsize=12)
plt.grid(True, linestyle='--', alpha=0.7)

plt.xticks(fontsize=12)
plt.yticks(fontsize=12)

plt.text(5, 40, 'how2matplotlib.com', fontsize=12, ha='center')

# Add annotations
plt.annotate('Rapid growth', xy=(8, 90), xytext=(6, 60),
             arrowprops=dict(facecolor='black', shrink=0.05),
             fontsize=10)

plt.tight_layout()
plt.show()
Output:
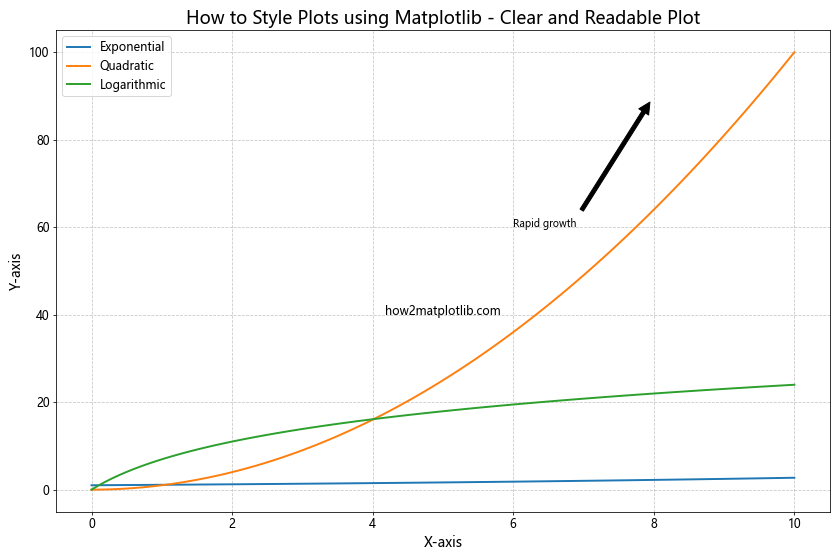
This example shows how to style plots using Matplotlib to create a clear and readable plot with appropriate font sizes, clear labels, and annotations to highlight important features.
Color Choice and Accessibility
When you style plots using Matplotlib, choosing appropriate colors is crucial not only for aesthetics but also for accessibility. It’s important to consider color-blind friendly palettes and ensure sufficient contrast.
import matplotlib.pyplot as plt
import numpy as np

# Color-blind friendly palette
colors = ['#1f77b4', '#ff7f0e', '#2ca02c', '#d62728', '#9467bd']

categories = ['A', 'B', 'C', 'D', 'E']
values = [23, 45, 56, 78, 32]

plt.figure(figsize=(10, 6))
bars = plt.bar(categories, values, color=colors)

plt.title('How to Style Plots using Matplotlib - Accessible Color Choices', fontsize=16)
plt.xlabel('Categories', fontsize=12)
plt.ylabel('Values', fontsize=12)

# Add value labels on top of each bar
for bar in bars:
    height = bar.get_height()
    plt.text(bar.get_x() + bar.get_width()/2., height,
             f'{height}',
             ha='center', va='bottom')

plt.text(2, -10, 'how2matplotlib.com', fontsize=12, ha='center')

# Add a legend with colored squares
for i, category in enumerate(categories):
    plt.scatter([], [], c=colors[i], label=category, s=100)
plt.legend(title='Categories', loc='upper left', bbox_to_anchor=(1, 1))

plt.tight_layout()
plt.show()
Output:
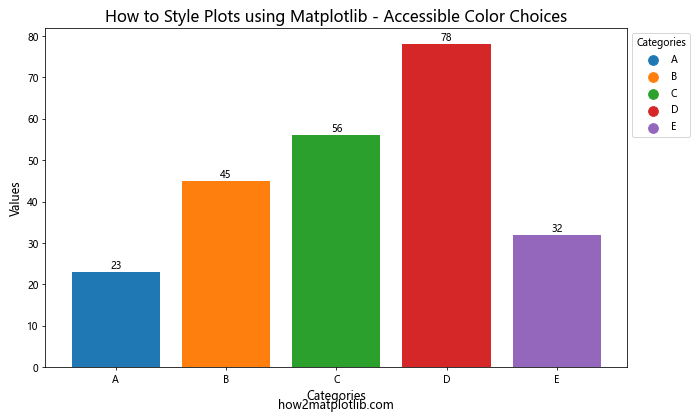
This example demonstrates how to style plots using Matplotlib with a color-blind friendly palette, ensuring that the plot is accessible to a wider audience.
Conclusion
Mastering how to style plots using Matplotlib is an essential skill for creating effective and visually appealing data visualizations in Python. Throughout this comprehensive guide, we’ve explored various techniques and best practices for styling plots using Matplotlib, from basic customization to advanced styling methods.
We’ve covered topics such as changing colors, customizing line styles and markers, adjusting plot elements, working with different plot types, applying custom color maps, fine-tuning aesthetics, using built-in and custom styles, creating 3D plots, and even animating visualizations. We’ve also discussed important considerations like maintaining consistency, ensuring clarity and readability, and making color choices that enhance accessibility.
By applying these techniques and following best practices, you can create professional-looking visualizations that effectively communicate your data insights. Remember that the key to mastering how to style plots using Matplotlib is practice and experimentation. Don’t be afraid to try different combinations of styles and customizations to find what works best for your specific data and audience.