Comprehensive Guide to Matplotlib.axis.Tick.set_picker() Function in Python
Matplotlib.axis.Tick.set_picker() function in Python is a powerful tool for enhancing the interactivity of your plots. This function allows you to set a picker for tick marks on an axis, enabling you to detect when a user clicks on or near a tick mark. In this comprehensive guide, we’ll explore the Matplotlib.axis.Tick.set_picker() function in depth, covering its usage, parameters, and various applications in data visualization.
Understanding the Matplotlib.axis.Tick.set_picker() Function
The Matplotlib.axis.Tick.set_picker() function is part of the Matplotlib library, specifically within the axis module. It is used to set a picker for individual tick marks on an axis. A picker is a function or value that determines whether an artist (in this case, a tick mark) can be selected by a mouse event.
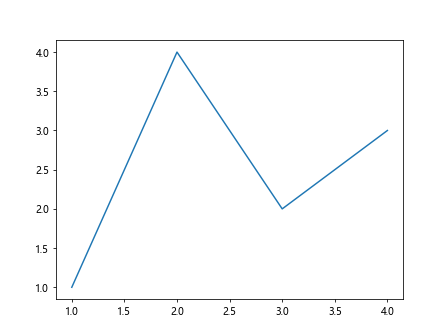
Let’s start with a basic example to illustrate how to use the Matplotlib.axis.Tick.set_picker() function:
import matplotlib.pyplot as plt

fig, ax = plt.subplots()
ax.plot([1, 2, 3, 4], [1, 4, 2, 3])

for tick in ax.xaxis.get_major_ticks():
    tick.set_picker(5)  # 5 points tolerance

def on_pick(event):
    tick = event.artist
    print(f"Clicked on tick: {tick.get_text()} - how2matplotlib.com")

fig.canvas.mpl_connect('pick_event', on_pick)

plt.show()
Output:

In this example, we set a picker for all major ticks on the x-axis with a tolerance of 5 points. When a user clicks near a tick mark, the on_pick function is called, which prints the tick label.
Parameters of Matplotlib.axis.Tick.set_picker()
The Matplotlib.axis.Tick.set_picker() function accepts the following parameters:
picker: This can be one of the following:- None: Picking is disabled for this artist (default).
- A boolean: If True, the artist will be pickable with default tolerance.
- A float: A tolerance in points; the artist will be picked if the mouse event is within the given number of points.
- A function: A custom picker function.
Let’s explore each of these options with examples.
Using a Boolean Value
import matplotlib.pyplot as plt

fig, ax = plt.subplots()
ax.plot([1, 2, 3, 4], [1, 4, 2, 3])

for tick in ax.xaxis.get_major_ticks():
    tick.set_picker(True)  # Enable picking with default tolerance

def on_pick(event):
    tick = event.artist
    print(f"Clicked on tick: {tick.get_text()} - how2matplotlib.com")

fig.canvas.mpl_connect('pick_event', on_pick)

plt.show()
Output:

In this example, we enable picking for all major x-axis ticks using True. This uses the default tolerance for picking.
Using a Float Value
import matplotlib.pyplot as plt

fig, ax = plt.subplots()
ax.plot([1, 2, 3, 4], [1, 4, 2, 3])

for tick in ax.xaxis.get_major_ticks():
    tick.set_picker(10.0)  # 10 points tolerance

def on_pick(event):
    tick = event.artist
    print(f"Clicked on tick: {tick.get_text()} - how2matplotlib.com")

fig.canvas.mpl_connect('pick_event', on_pick)

plt.show()
Output:

Here, we set a tolerance of 10 points for picking. The tick will be picked if the mouse event is within 10 points of the tick.
Using a Custom Picker Function
import matplotlib.pyplot as plt

def custom_picker(tick, mouseevent):
    mouse_x = mouseevent.xdata
    tick_x = tick.get_loc()
    return abs(mouse_x - tick_x) < 0.1

fig, ax = plt.subplots()
ax.plot([1, 2, 3, 4], [1, 4, 2, 3])

for tick in ax.xaxis.get_major_ticks():
    tick.set_picker(custom_picker)

def on_pick(event):
    tick = event.artist
    print(f"Clicked on tick: {tick.get_text()} - how2matplotlib.com")

fig.canvas.mpl_connect('pick_event', on_pick)

plt.show()
Output:

In this example, we define a custom picker function that checks if the mouse click is within 0.1 units of the tick location.
Applications of Matplotlib.axis.Tick.set_picker()
The Matplotlib.axis.Tick.set_picker() function has various applications in creating interactive plots. Let's explore some of these applications with examples.
Highlighting Selected Ticks
import matplotlib.pyplot as plt

fig, ax = plt.subplots()
ax.plot([1, 2, 3, 4], [1, 4, 2, 3])

selected_ticks = []

for tick in ax.xaxis.get_major_ticks():
    tick.set_picker(5)

def on_pick(event):
    tick = event.artist
    if tick in selected_ticks:
        tick.label.set_color('black')
        selected_ticks.remove(tick)
    else:
        tick.label.set_color('red')
        selected_ticks.append(tick)
    fig.canvas.draw()
    print(f"Selected ticks: {[t.get_text() for t in selected_ticks]} - how2matplotlib.com")

fig.canvas.mpl_connect('pick_event', on_pick)

plt.show()
Output:

This example allows users to select and deselect ticks by clicking on them. Selected ticks are highlighted in red.
Displaying Additional Information on Tick Selection
import matplotlib.pyplot as plt

fig, ax = plt.subplots()
data = [1, 4, 2, 3]
ax.plot([1, 2, 3, 4], data)

for tick in ax.xaxis.get_major_ticks():
    tick.set_picker(5)

annotation = ax.annotate("", xy=(0, 0), xytext=(5, 5), textcoords="offset points",
                         bbox=dict(boxstyle="round", fc="w"),
                         arrowprops=dict(arrowstyle="->"))
annotation.set_visible(False)

def on_pick(event):
    tick = event.artist
    x = tick.get_loc()
    y = data[int(x) - 1]
    annotation.xy = (x, y)
    annotation.set_text(f"Value: {y}\nHow2matplotlib.com")
    annotation.set_visible(True)
    fig.canvas.draw()

fig.canvas.mpl_connect('pick_event', on_pick)

plt.show()
Output:

This example displays an annotation with additional information when a tick is selected.
Zooming to Selected Tick Range
import matplotlib.pyplot as plt

fig, ax = plt.subplots()
ax.plot([1, 2, 3, 4, 5, 6], [1, 4, 2, 3, 5, 2])

for tick in ax.xaxis.get_major_ticks():
    tick.set_picker(5)

selected_ticks = []

def on_pick(event):
    tick = event.artist
    if tick in selected_ticks:
        selected_ticks.remove(tick)
    else:
        selected_ticks.append(tick)

    if len(selected_ticks) == 2:
        x_min = min(t.get_loc() for t in selected_ticks)
        x_max = max(t.get_loc() for t in selected_ticks)
        ax.set_xlim(x_min, x_max)
        selected_ticks.clear()

    fig.canvas.draw()
    print(f"Selected range: {ax.get_xlim()} - how2matplotlib.com")

fig.canvas.mpl_connect('pick_event', on_pick)

plt.show()
Output:
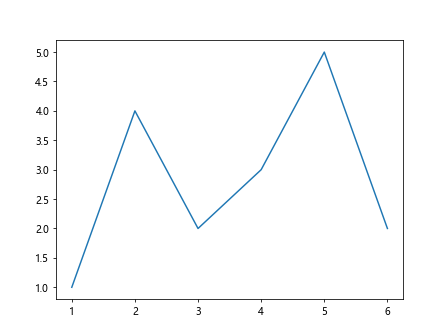
This example allows users to select two ticks to zoom into that range of the plot.
Advanced Techniques with Matplotlib.axis.Tick.set_picker()
Let's explore some advanced techniques using the Matplotlib.axis.Tick.set_picker() function.
Customizing Tick Appearance on Selection
import matplotlib.pyplot as plt

fig, ax = plt.subplots()
ax.plot([1, 2, 3, 4], [1, 4, 2, 3])

for tick in ax.xaxis.get_major_ticks():
    tick.set_picker(5)
    tick.label1.set_fontweight('normal')

def on_pick(event):
    tick = event.artist
    if tick.label1.get_fontweight() == 'normal':
        tick.label1.set_fontweight('bold')
        tick.label1.set_fontsize(14)
    else:
        tick.label1.set_fontweight('normal')
        tick.label1.set_fontsize(10)
    fig.canvas.draw()
    print(f"Selected tick: {tick.get_text()} - how2matplotlib.com")

fig.canvas.mpl_connect('pick_event', on_pick)

plt.show()
Output:

This example changes the font weight and size of selected ticks.
Interactive Tick Rotation
import matplotlib.pyplot as plt

fig, ax = plt.subplots()
ax.plot([1, 2, 3, 4], [1, 4, 2, 3])

for tick in ax.xaxis.get_major_ticks():
    tick.set_picker(5)

def on_pick(event):
    tick = event.artist
    current_rotation = tick.label1.get_rotation()
    new_rotation = (current_rotation + 45) % 360
    tick.label1.set_rotation(new_rotation)
    fig.canvas.draw()
    print(f"Rotated tick: {tick.get_text()} to {new_rotation} degrees - how2matplotlib.com")

fig.canvas.mpl_connect('pick_event', on_pick)

plt.show()
Output:

This example allows users to rotate tick labels by clicking on them.
Toggling Tick Visibility
import matplotlib.pyplot as plt

fig, ax = plt.subplots()
ax.plot([1, 2, 3, 4], [1, 4, 2, 3])

for tick in ax.xaxis.get_major_ticks():
    tick.set_picker(5)

def on_pick(event):
    tick = event.artist
    tick.set_visible(not tick.get_visible())
    fig.canvas.draw()
    print(f"Toggled visibility of tick: {tick.get_text()} - how2matplotlib.com")

fig.canvas.mpl_connect('pick_event', on_pick)

plt.show()
Output:

This example allows users to toggle the visibility of ticks by clicking on them.
Combining Matplotlib.axis.Tick.set_picker() with Other Matplotlib Features
The Matplotlib.axis.Tick.set_picker() function can be combined with other Matplotlib features to create more complex interactive visualizations.
Interactive Legend with Selectable Ticks
import matplotlib.pyplot as plt

fig, ax = plt.subplots()
line1, = ax.plot([1, 2, 3, 4], [1, 4, 2, 3], label='Line 1')
line2, = ax.plot([1, 2, 3, 4], [2, 3, 4, 1], label='Line 2')

legend = ax.legend()
legend.set_picker(5)

for tick in ax.xaxis.get_major_ticks():
    tick.set_picker(5)

def on_pick(event):
    if isinstance(event.artist, plt.Line2D):
        line = event.artist
        vis = not line.get_visible()
        line.set_visible(vis)
        if vis:
            line.set_alpha(1.0)
        else:
            line.set_alpha(0.2)
    elif isinstance(event.artist, plt.Text):
        tick = event.artist
        tick.set_color('red' if tick.get_color() == 'black' else 'black')

    fig.canvas.draw()
    print(f"Interacted with: {event.artist} - how2matplotlib.com")

fig.canvas.mpl_connect('pick_event', on_pick)

plt.show()
Output:
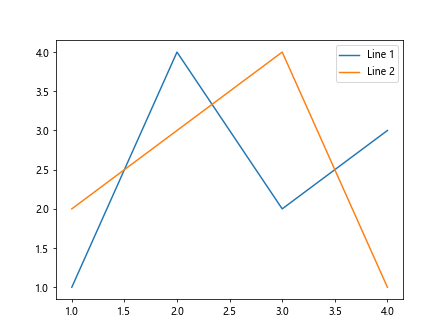
This example combines selectable legend items and ticks, allowing users to toggle line visibility and highlight ticks.
Common Challenges and Solutions when Using Matplotlib.axis.Tick.set_picker()
While the Matplotlib.axis.Tick.set_picker() function is powerful, you may encounter some challenges when using it. Let's discuss some common issues and their solutions.
Challenge 1: Picking Ticks on Both Axes
By default, setting a picker on ticks only affects one axis. If you want to make ticks on both axes pickable, you need to apply the set_picker() function to ticks on both axes.
Solution:
import matplotlib.pyplot as plt

fig, ax = plt.subplots()
ax.plot([1, 2, 3, 4], [1, 4, 2, 3])

for axis in [ax.xaxis, ax.yaxis]:
    for tick in axis.get_major_ticks():
        tick.set_picker(5)

def on_pick(event):
    tick = event.artist
    print(f"Clicked on tick: {tick.get_text()} on {'x' if tick in ax.xaxis.get_major_ticks() else 'y'} axis - how2matplotlib.com")

fig.canvas.mpl_connect('pick_event', on_pick)

plt.show()
Output:

This example makes ticks on both x and y axes pickable.
Challenge 2: Handling Overlapping Ticks
When ticks are close together, it can be difficult to pick a specific tick accurately.
Solution:
import matplotlib.pyplot as plt

fig, ax = plt.subplots()
ax.plot([1, 1.1, 1.2, 1.3], [1, 4, 2, 3])

for tick in ax.xaxis.get_major_ticks():
    tick.set_picker(5)

def find_nearest_tick(x, ticks):
    return min(ticks, key=lambda tick: abs(tick.get_loc() - x))

def on_pick(event):
    mouse_x = event.mouseevent.xdata
    nearest_tick = find_nearest_tick(mouse_x, ax.xaxis.get_major_ticks())
    print(f"Clicked near tick: {nearest_tick.get_text()} - how2matplotlib.com")

fig.canvas.mpl_connect('pick_event', on_pick)

plt.show()
Output:

This example implements a function to find the nearest tick to the mouse click, helping to handle cases where ticks are close together.
Challenge 3: Performance Issues with Many Ticks
When dealing with a large number of ticks, setting a picker for each tick and handling pick events can become computationally expensive.
Solution:
import matplotlib.pyplot as plt
import numpy as np

fig, ax = plt.subplots()
x = np.linspace(0, 10, 1000)
ax.plot(x, np.sin(x))

ax.xaxis.set_picker(5)  # Set picker for the entire axis instead of individual ticks

def on_pick(event):
    if event.artist == ax.xaxis:
        mouse_x = event.mouseevent.xdata
        nearest_tick = min(ax.get_xticks(), key=lambda tick: abs(tick - mouse_x))
        print(f"Clicked near tick: {nearest_tick:.2f} - how2matplotlib.com")

fig.canvas.mpl_connect('pick_event', on_pick)

plt.show()
Output:
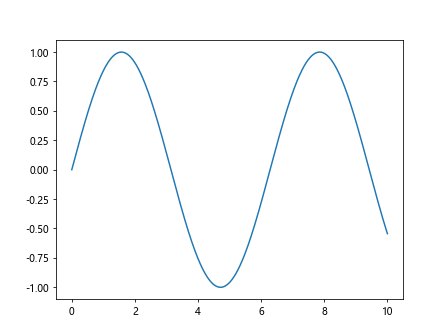
This example sets a picker for the entire axis instead of individual ticks, which can be more efficient for plots with many ticks.
Advanced Applications of Matplotlib.axis.Tick.set_picker()
Let's explore some advanced applications of the Matplotlib.axis.Tick.set_picker() function to create more complex interactive visualizations.
Interactive Data Filtering
import matplotlib.pyplot as plt
import numpy as np

fig, ax = plt.subplots()
x = np.linspace(0, 10, 100)
y = np.sin(x)
line, = ax.plot(x, y)

for tick in ax.xaxis.get_major_ticks():
    tick.set_picker(5)

selected_range = []

def update_plot():
    if len(selected_range) == 2:
        x_min, x_max = min(selected_range), max(selected_range)
        mask = (x >= x_min) & (x <= x_max)
        line.set_data(x[mask], y[mask])
        ax.set_xlim(x_min, x_max)
        ax.set_ylim(y[mask].min(), y[mask].max())
    else:
        line.set_data(x, y)
        ax.set_xlim(x.min(), x.max())
        ax.set_ylim(y.min(), y.max())
    fig.canvas.draw()

def on_pick(event):
    tick = event.artist
    if tick in selected_range:
        selected_range.remove(tick)
    else:
        selected_range.append(tick)

    if len(selected_range) > 2:
        selected_range.pop(0)

    update_plot()
    print(f"Selected range: {[t.get_text() for t in selected_range]} - how2matplotlib.com")

fig.canvas.mpl_connect('pick_event', on_pick)

plt.show()
Output:
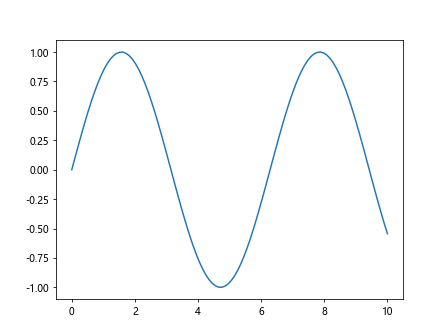
This example allows users to select a range of x-axis ticks to filter the displayed data.
Custom Tick Labels with Interactivity
import matplotlib.pyplot as plt
import numpy as np
fig, ax = plt.subplots()
x = np.arange(5)
y = [2, 4, 1, 5, 3]
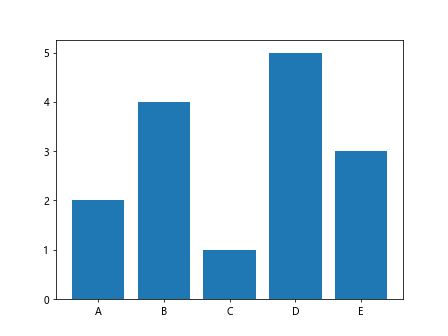
ax.bar(x, y)
custom_labels = ['A', 'B', 'C', 'D', 'E']
ax.set_xticks(x)
ax.set_xticklabels(custom_labels)
for tick in ax.xaxis.get_major_ticks():
tick.set_picker(5)
def on_pick(event):
tick = event.artist
index = ax.xaxis.get_major_ticks().index(tick)
value = y[index]
print(f"Bar {tick.get_text()}: Value = {value} - how2matplotlib.com")
fig.canvas.mpl_connect('pick_event', on_pick)
plt.show()
Output:
This example uses custom tick labels and displays the corresponding bar value when a tick is clicked.
Interactive Tick Formatting
import matplotlib.pyplot as plt
import numpy as np

fig, ax = plt.subplots()
x = np.linspace(0, 2*np.pi, 100)
y = np.sin(x)
ax.plot(x, y)

for tick in ax.xaxis.get_major_ticks():
    tick.set_picker(5)

formats = ['%.2f', '%.3f', '%.4f', '%.5f']
current_format = 0

def on_pick(event):
    global current_format
    tick = event.artist
    current_format = (current_format + 1) % len(formats)
    ax.xaxis.set_major_formatter(plt.FormatStrFormatter(formats[current_format]))
    fig.canvas.draw()
    print(f"Changed tick format to {formats[current_format]} - how2matplotlib.com")

fig.canvas.mpl_connect('pick_event', on_pick)

plt.show()
Output:
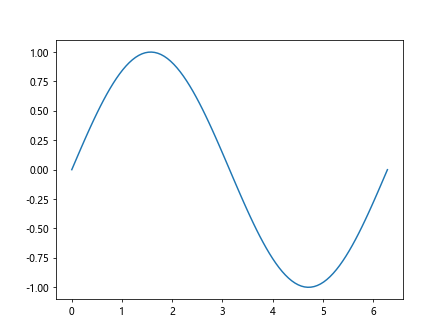
This example allows users to cycle through different tick label formats by clicking on the ticks.
Integrating Matplotlib.axis.Tick.set_picker() with Other Libraries
The Matplotlib.axis.Tick.set_picker() function can be integrated with other libraries to create more complex interactive data visualization applications. Let's explore some examples.
Integration with Seaborn
import matplotlib.pyplot as plt
import seaborn as sns
import pandas as pd
import numpy as np

# Create a sample DataFrame
df = pd.DataFrame({
    'Category': ['A', 'B', 'C', 'D', 'E'],
    'Value1': np.random.rand(5),
    'Value2': np.random.rand(5)
})

fig, ax = plt.subplots(figsize=(10, 6))
sns.barplot(x='Category', y='Value1', data=df, ax=ax)

for tick in ax.xaxis.get_major_ticks():
    tick.set_picker(5)

def on_pick(event):
    tick = event.artist
    category = tick.get_text()
    value1 = df.loc[df['Category'] == category, 'Value1'].values[0]
    value2 = df.loc[df['Category'] == category, 'Value2'].values[0]
    print(f"Category: {category}, Value1: {value1:.2f}, Value2: {value2:.2f} - how2matplotlib.com")

fig.canvas.mpl_connect('pick_event', on_pick)

plt.show()
Output:
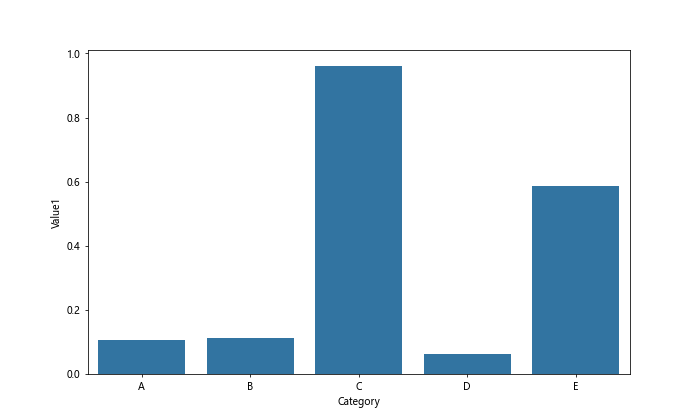
This example integrates Matplotlib's tick picker functionality with a Seaborn plot.
Troubleshooting Common Issues with Matplotlib.axis.Tick.set_picker()
When working with the Matplotlib.axis.Tick.set_picker() function, you may encounter some issues. Here are some common problems and their solutions:
Issue 1: Picker Not Responding
If your picker is not responding to clicks, ensure that you've connected the pick event to the canvas:
import matplotlib.pyplot as plt

fig, ax = plt.subplots()
ax.plot([1, 2, 3, 4], [1, 4, 2, 3])

for tick in ax.xaxis.get_major_ticks():
    tick.set_picker(5)

def on_pick(event):
    print("Tick picked - how2matplotlib.com")

# Make sure this line is included
fig.canvas.mpl_connect('pick_event', on_pick)

plt.show()
Output:

Issue 2: Picking Wrong Artists
If you're picking the wrong artists (e.g., data points instead of ticks), check the type of the picked artist in your event handler:
import matplotlib.pyplot as plt

fig, ax = plt.subplots()
ax.plot([1, 2, 3, 4], [1, 4, 2, 3], picker=5)

for tick in ax.xaxis.get_major_ticks():
    tick.set_picker(5)

def on_pick(event):
    if event.artist in ax.xaxis.get_major_ticks():
        print("Tick picked - how2matplotlib.com")
    else:
        print("Other artist picked - how2matplotlib.com")

fig.canvas.mpl_connect('pick_event', on_pick)

plt.show()
Output:
Issue 3: Performance Issues
If you're experiencing performance issues with many ticks, consider setting the picker for the entire axis instead of individual ticks:
import matplotlib.pyplot as plt
import numpy as np

fig, ax = plt.subplots()
x = np.linspace(0, 10, 1000)
ax.plot(x, np.sin(x))

ax.xaxis.set_picker(5)  # Set picker for the entire axis

def on_pick(event):
    if event.artist == ax.xaxis:
        print("X-axis picked - how2matplotlib.com")

fig.canvas.mpl_connect('pick_event', on_pick)

plt.show()
Output:

Conclusion
The Matplotlib.axis.Tick.set_picker() function is a powerful tool for creating interactive plots in Python. It allows you to add click functionality to tick marks, enabling a wide range of interactive features in your data visualizations. From simple tick selection to complex data filtering and custom interactions, this function opens up many possibilities for enhancing your plots.