Comprehensive Guide to Matplotlib.axis.Tick.set_snap() Function in Python
Matplotlib.axis.Tick.set_snap() function in Python is a powerful tool for controlling the snapping behavior of tick marks in Matplotlib plots. This function allows you to fine-tune the appearance of your tick marks, ensuring they align perfectly with your data points or grid lines. In this comprehensive guide, we’ll explore the Matplotlib.axis.Tick.set_snap() function in depth, providing numerous examples and explanations to help you master this essential feature of Matplotlib.
Understanding the Basics of Matplotlib.axis.Tick.set_snap()
The Matplotlib.axis.Tick.set_snap() function is a method of the Tick class in Matplotlib’s axis module. It is used to set the snapping behavior of individual tick marks on an axis. Snapping refers to the automatic adjustment of tick marks to align with specific positions, such as data points or grid lines.
Let’s start with a simple example to demonstrate how to use the Matplotlib.axis.Tick.set_snap() function:
import matplotlib.pyplot as plt
import numpy as np

# Create a simple plot
fig, ax = plt.subplots()
x = np.linspace(0, 10, 100)
y = np.sin(x)
ax.plot(x, y, label='how2matplotlib.com')

# Get the x-axis ticks
x_ticks = ax.get_xticks()

# Set snap for each tick
for tick in ax.xaxis.get_major_ticks():
    tick.set_snap(True)

plt.title('Matplotlib.axis.Tick.set_snap() Example')
plt.legend()
plt.show()
Output:
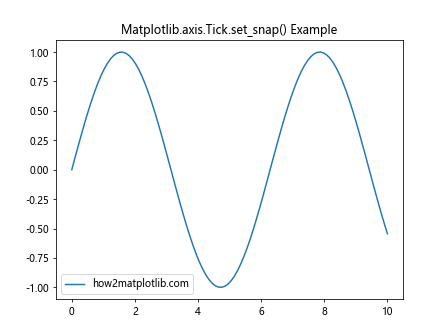
In this example, we create a simple sine wave plot and then use a loop to set the snap property for each major tick on the x-axis. The Matplotlib.axis.Tick.set_snap() function is called with the argument True, which enables snapping for each tick.
Exploring the Parameters of Matplotlib.axis.Tick.set_snap()
The Matplotlib.axis.Tick.set_snap() function has a single parameter:
- snap (bool or None): If True, the tick will snap to the nearest integer. If False, the tick will not snap. If None (default), the snap setting will be determined automatically.
Let’s look at an example that demonstrates the different behaviors with various snap settings:
import matplotlib.pyplot as plt
import numpy as np

fig, (ax1, ax2, ax3) = plt.subplots(3, 1, figsize=(8, 12))

x = np.linspace(0, 10, 100)
y = np.sin(x)

# Plot with snap=True
ax1.plot(x, y, label='how2matplotlib.com')
for tick in ax1.xaxis.get_major_ticks():
    tick.set_snap(True)
ax1.set_title('Matplotlib.axis.Tick.set_snap(True)')

# Plot with snap=False
ax2.plot(x, y, label='how2matplotlib.com')
for tick in ax2.xaxis.get_major_ticks():
    tick.set_snap(False)
ax2.set_title('Matplotlib.axis.Tick.set_snap(False)')

# Plot with snap=None (default)
ax3.plot(x, y, label='how2matplotlib.com')
for tick in ax3.xaxis.get_major_ticks():
    tick.set_snap(None)
ax3.set_title('Matplotlib.axis.Tick.set_snap(None)')

plt.tight_layout()
plt.show()
Output:
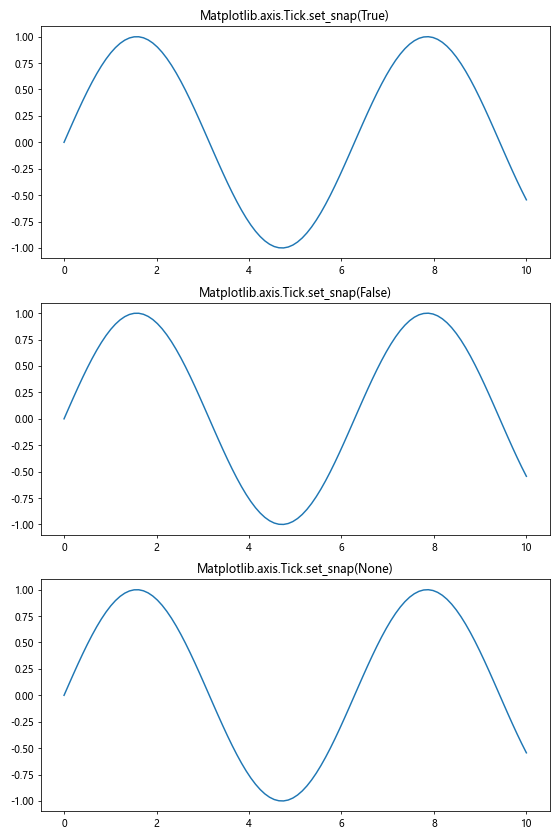
This example creates three subplots, each with a different snap setting for the x-axis ticks. The first subplot uses snap=True, the second uses snap=False, and the third uses snap=None (the default behavior).
Applying Matplotlib.axis.Tick.set_snap() to Different Axis Types
The Matplotlib.axis.Tick.set_snap() function can be applied to both x-axis and y-axis ticks. Let’s see an example that demonstrates this:
import matplotlib.pyplot as plt
import numpy as np

fig, ax = plt.subplots()

x = np.linspace(0, 10, 100)
y = np.sin(x)
ax.plot(x, y, label='how2matplotlib.com')

# Set snap for x-axis ticks
for tick in ax.xaxis.get_major_ticks():
    tick.set_snap(True)

# Set snap for y-axis ticks
for tick in ax.yaxis.get_major_ticks():
    tick.set_snap(True)

plt.title('Matplotlib.axis.Tick.set_snap() on Both Axes')
plt.legend()
plt.show()
Output:
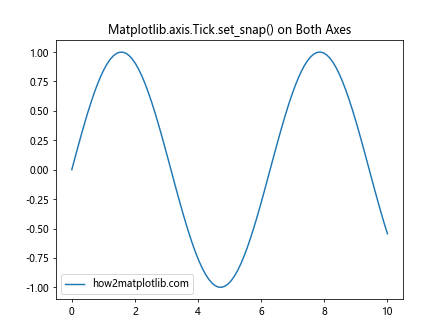
In this example, we apply the Matplotlib.axis.Tick.set_snap() function to both the x-axis and y-axis ticks, ensuring that all ticks on the plot snap to the nearest integer values.
Using Matplotlib.axis.Tick.set_snap() in Different Plot Types
The Matplotlib.axis.Tick.set_snap() function can be applied to various types of plots. Let’s explore how it works with different plot types:
Bar Plot Example
import matplotlib.pyplot as plt
import numpy as np

fig, ax = plt.subplots(figsize=(10, 6))

categories = ['A', 'B', 'C', 'D', 'E']
values = [3, 7, 2, 5, 8]

ax.bar(categories, values, label='how2matplotlib.com')

for tick in ax.xaxis.get_major_ticks():
    tick.set_snap(True)

for tick in ax.yaxis.get_major_ticks():
    tick.set_snap(True)

plt.title('Matplotlib.axis.Tick.set_snap() in Bar Plot')
plt.legend()
plt.show()
Output:
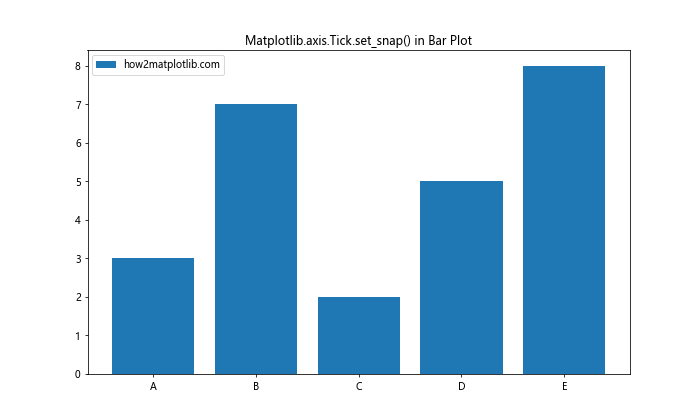
In this bar plot example, we apply the Matplotlib.axis.Tick.set_snap() function to both x-axis and y-axis ticks, ensuring that the ticks align perfectly with the bars and integer values on the y-axis.
Scatter Plot Example
import matplotlib.pyplot as plt
import numpy as np

fig, ax = plt.subplots(figsize=(10, 6))

x = np.random.rand(50) * 10
y = np.random.rand(50) * 10

ax.scatter(x, y, label='how2matplotlib.com')

for tick in ax.xaxis.get_major_ticks():
    tick.set_snap(True)

for tick in ax.yaxis.get_major_ticks():
    tick.set_snap(True)

plt.title('Matplotlib.axis.Tick.set_snap() in Scatter Plot')
plt.legend()
plt.show()
Output:
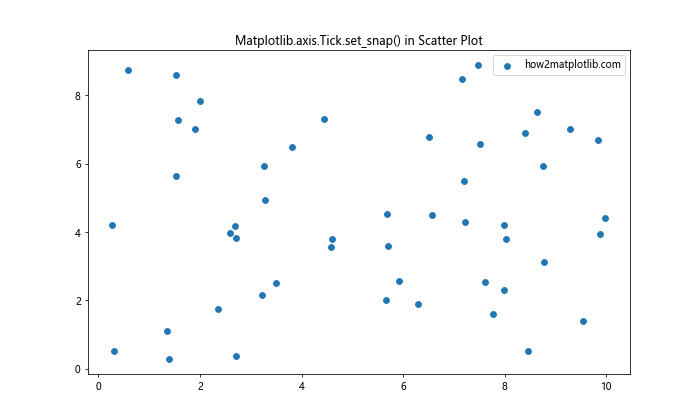
In this scatter plot example, we use the Matplotlib.axis.Tick.set_snap() function to ensure that the ticks on both axes snap to integer values, providing a cleaner appearance for the randomly distributed data points.
Advanced Techniques with Matplotlib.axis.Tick.set_snap()
Now that we’ve covered the basics, let’s explore some advanced techniques using the Matplotlib.axis.Tick.set_snap() function:
Selective Tick Snapping
You can selectively apply the Matplotlib.axis.Tick.set_snap() function to specific ticks:
import matplotlib.pyplot as plt
import numpy as np

fig, ax = plt.subplots(figsize=(10, 6))

x = np.linspace(0, 10, 100)
y = np.sin(x)
ax.plot(x, y, label='how2matplotlib.com')

# Get all x-axis ticks
x_ticks = ax.get_xticks()

# Apply snap to every other tick
for i, tick in enumerate(ax.xaxis.get_major_ticks()):
    if i % 2 == 0:
        tick.set_snap(True)
    else:
        tick.set_snap(False)

plt.title('Selective Matplotlib.axis.Tick.set_snap()')
plt.legend()
plt.show()
Output:
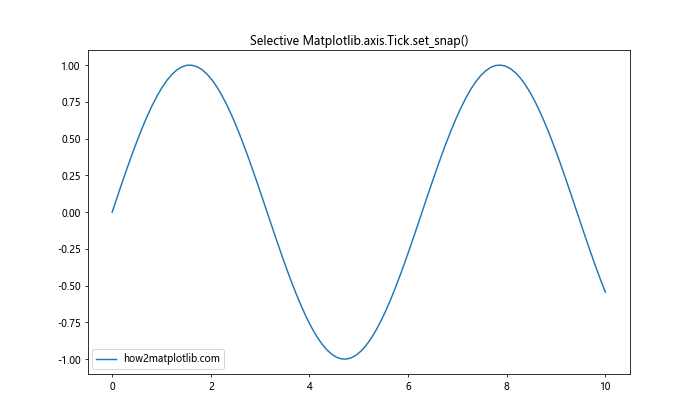
In this example, we apply the Matplotlib.axis.Tick.set_snap() function to every other tick on the x-axis, creating an alternating pattern of snapped and non-snapped ticks.
Dynamic Tick Snapping Based on Data
You can dynamically adjust the snap behavior based on your data:
import matplotlib.pyplot as plt
import numpy as np

fig, ax = plt.subplots(figsize=(10, 6))

x = np.linspace(0, 10, 100)
y = np.sin(x)
ax.plot(x, y, label='how2matplotlib.com')

# Get all x-axis ticks
x_ticks = ax.get_xticks()

# Apply snap based on y-values
for tick in ax.xaxis.get_major_ticks():
    tick_value = tick.get_loc()
    y_value = np.sin(tick_value)
    if y_value > 0:
        tick.set_snap(True)
    else:
        tick.set_snap(False)

plt.title('Dynamic Matplotlib.axis.Tick.set_snap() Based on Data')
plt.legend()
plt.show()
Output:
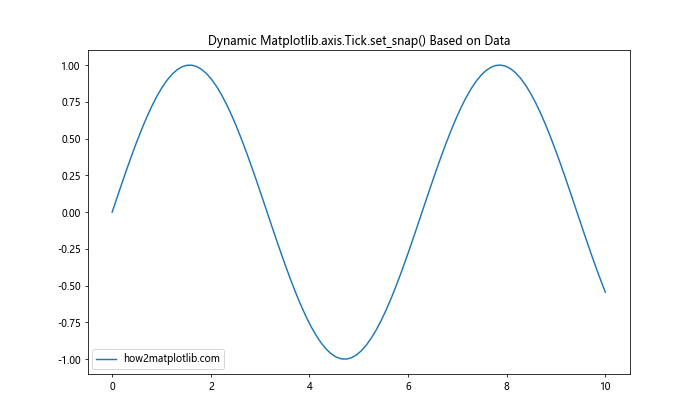
In this example, we dynamically set the snap property of x-axis ticks based on the corresponding y-values of the sine wave. Ticks with positive y-values are snapped, while those with negative y-values are not.
Combining Matplotlib.axis.Tick.set_snap() with GridSpec
The Matplotlib.axis.Tick.set_snap() function can be used effectively in complex layouts created with GridSpec. Here’s an example:
import matplotlib.pyplot as plt
import matplotlib.gridspec as gridspec
import numpy as np

fig = plt.figure(figsize=(12, 8))
gs = gridspec.GridSpec(2, 2)

ax1 = fig.add_subplot(gs[0, 0])
ax2 = fig.add_subplot(gs[0, 1])
ax3 = fig.add_subplot(gs[1, :])

x = np.linspace(0, 10, 100)
y1 = np.sin(x)
y2 = np.cos(x)
y3 = np.tan(x)

ax1.plot(x, y1, label='how2matplotlib.com')
ax2.plot(x, y2, label='how2matplotlib.com')
ax3.plot(x, y3, label='how2matplotlib.com')

for ax in [ax1, ax2, ax3]:
    for tick in ax.xaxis.get_major_ticks():
        tick.set_snap(True)
    for tick in ax.yaxis.get_major_ticks():
        tick.set_snap(True)

fig.suptitle('Matplotlib.axis.Tick.set_snap() with GridSpec')
plt.tight_layout()
plt.show()
Output:
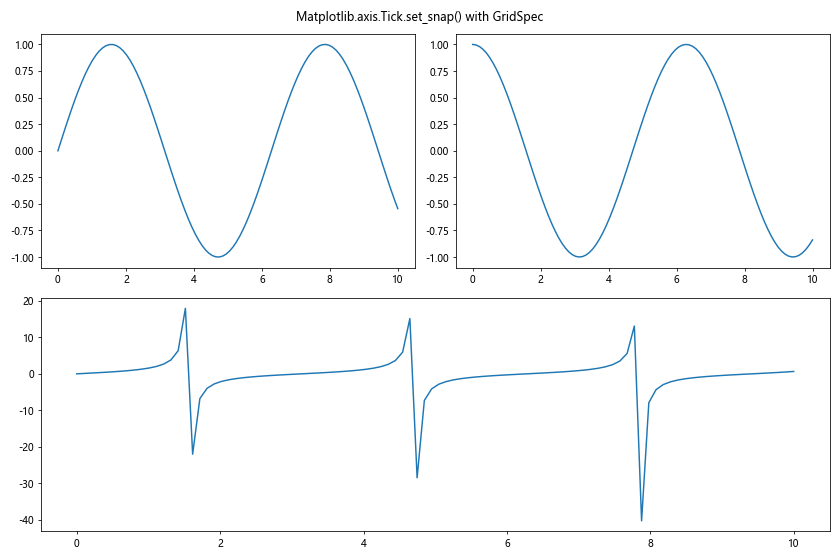
In this example, we create a complex layout using GridSpec and apply the Matplotlib.axis.Tick.set_snap() function to all ticks in each subplot, ensuring consistent snapping behavior across the entire figure.
Matplotlib.axis.Tick.set_snap() in 3D Plots
The Matplotlib.axis.Tick.set_snap() function can also be applied to 3D plots. Here’s an example:
import matplotlib.pyplot as plt
from mpl_toolkits.mplot3d import Axes3D
import numpy as np

fig = plt.figure(figsize=(10, 8))
ax = fig.add_subplot(111, projection='3d')

x = np.linspace(-5, 5, 100)
y = np.linspace(-5, 5, 100)
X, Y = np.meshgrid(x, y)
Z = np.sin(np.sqrt(X**2 + Y**2))

ax.plot_surface(X, Y, Z, cmap='viridis', label='how2matplotlib.com')

for axis in [ax.xaxis, ax.yaxis, ax.zaxis]:
    for tick in axis.get_major_ticks():
        tick.set_snap(True)

ax.set_title('Matplotlib.axis.Tick.set_snap() in 3D Plot')
plt.show()
Output:
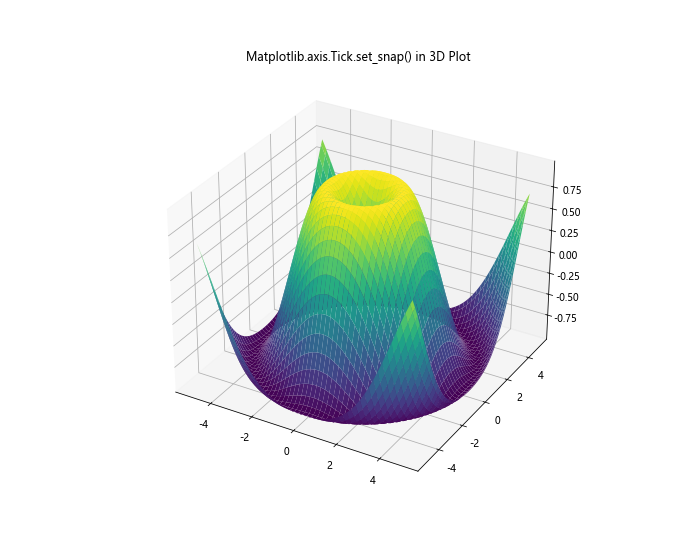
In this 3D plot example, we apply the Matplotlib.axis.Tick.set_snap() function to all three axes (x, y, and z), ensuring that the ticks snap to integer values in all dimensions.
Handling Very Small or Large Ranges
When dealing with data that spans very small or very large ranges, the Matplotlib.axis.Tick.set_snap() function may not produce the desired effect. In such cases, you may need to adjust the tick locator or formatter:
import matplotlib.pyplot as plt
import numpy as np

fig, (ax1, ax2) = plt.subplots(2, 1, figsize=(10, 12))

# Very small range
x1 = np.linspace(0, 0.001, 100)
y1 = np.sin(x1* 1000)
ax1.plot(x1, y1, label='how2matplotlib.com')
ax1.set_title('Matplotlib.axis.Tick.set_snap() with Small Range')

# Very large range
x2 = np.linspace(0, 1e6, 100)
y2 = np.sin(x2 / 1e5)
ax2.plot(x2, y2, label='how2matplotlib.com')
ax2.set_title('Matplotlib.axis.Tick.set_snap() with Large Range')

for ax in [ax1, ax2]:
    for tick in ax.xaxis.get_major_ticks():
        tick.set_snap(True)
    for tick in ax.yaxis.get_major_ticks():
        tick.set_snap(True)

plt.tight_layout()
plt.show()
Output:
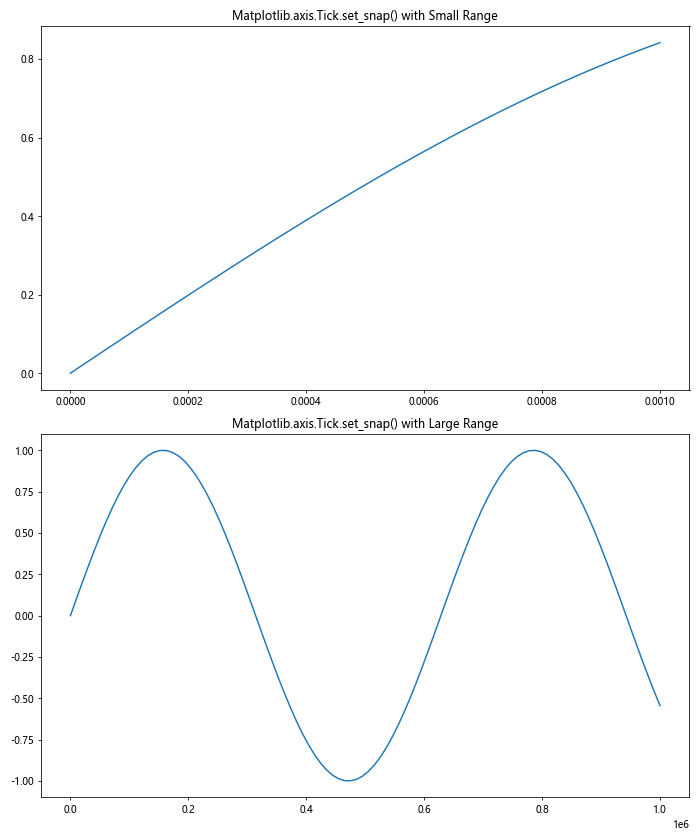
In this example, we plot data with very small and very large ranges. The Matplotlib.axis.Tick.set_snap() function is applied to both plots, but you may need to adjust the tick locator or formatter for better results in these extreme cases.
Optimizing Performance with Matplotlib.axis.Tick.set_snap()
When working with large datasets or creating multiple plots, it’s important to consider the performance impact of using the Matplotlib.axis.Tick.set_snap() function. Here are some tips to optimize performance:
Limiting the Number of Ticks
Reducing the number of ticks can improve performance when using Matplotlib.axis.Tick.set_snap():
import matplotlib.pyplot as plt
import numpy as np

fig, ax = plt.subplots(figsize=(10, 6))

x = np.linspace(0, 100, 1000)
y = np.sin(x)
ax.plot(x, y, label='how2matplotlib.com')

# Limit the number of ticks
ax.xaxis.set_major_locator(plt.MaxNLocator(10))
ax.yaxis.set_major_locator(plt.MaxNLocator(5))

for axis in [ax.xaxis, ax.yaxis]:
    for tick in axis.get_major_ticks():
        tick.set_snap(True)

plt.title('Optimized Matplotlib.axis.Tick.set_snap() with Limited Ticks')
plt.legend()
plt.show()
Output:
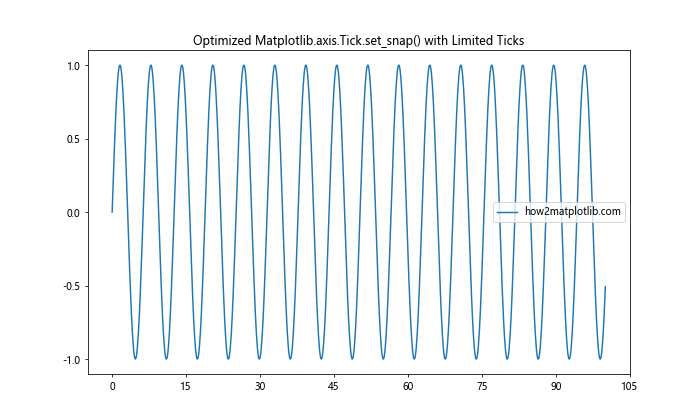
In this example, we use MaxNLocator to limit the number of ticks on both axes before applying the Matplotlib.axis.Tick.set_snap() function, which can improve performance for large datasets.
Integrating Matplotlib.axis.Tick.set_snap() with Other Matplotlib Features
The Matplotlib.axis.Tick.set_snap() function can be integrated with other Matplotlib features to create more complex and informative visualizations. Let’s explore some examples:
Combining with Colorbar
Here’s an example of using Matplotlib.axis.Tick.set_snap() with a colorbar:
import matplotlib.pyplot as plt
import numpy as np

fig, ax = plt.subplots(figsize=(10, 8))

x = np.linspace(0, 10, 100)
y = np.linspace(0, 10, 100)
X, Y = np.meshgrid(x, y)
Z = np.sin(X) * np.cos(Y)

im = ax.imshow(Z, extent=[0, 10, 0, 10], origin='lower', cmap='viridis')
cbar = fig.colorbar(im)

for axis in [ax.xaxis, ax.yaxis, cbar.ax.yaxis]:
    for tick in axis.get_major_ticks():
        tick.set_snap(True)

plt.title('Matplotlib.axis.Tick.set_snap() with Colorbar')
ax.set_xlabel('X-axis (how2matplotlib.com)')
ax.set_ylabel('Y-axis (how2matplotlib.com)')
plt.show()
Output:
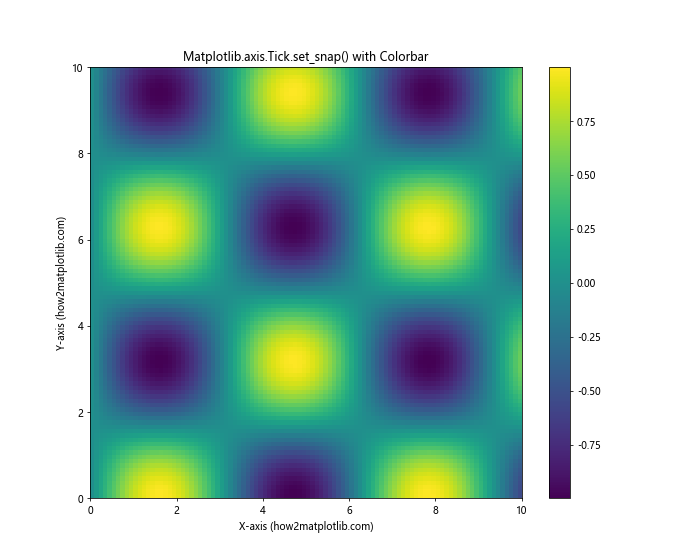
In this example, we create a 2D plot with a colorbar and apply the Matplotlib.axis.Tick.set_snap() function to both the main axes and the colorbar axis.
Using with Twin Axes
The Matplotlib.axis.Tick.set_snap() function can be used with twin axes to create plots with different scales:
import matplotlib.pyplot as plt
import numpy as np

fig, ax1 = plt.subplots(figsize=(10, 6))

x = np.linspace(0, 10, 100)
y1 = np.sin(x)
y2 = np.exp(x)

ax1.plot(x, y1, 'b-', label='sin(x) (how2matplotlib.com)')
ax1.set_ylabel('sin(x)', color='b')

ax2 = ax1.twinx()
ax2.plot(x, y2, 'r-', label='exp(x) (how2matplotlib.com)')
ax2.set_ylabel('exp(x)', color='r')

for ax in [ax1, ax2]:
    for axis in [ax.xaxis, ax.yaxis]:
        for tick in axis.get_major_ticks():
            tick.set_snap(True)

plt.title('Matplotlib.axis.Tick.set_snap() with Twin Axes')
fig.legend(loc='upper left', bbox_to_anchor=(0.1, 0.9))
plt.show()
Output:
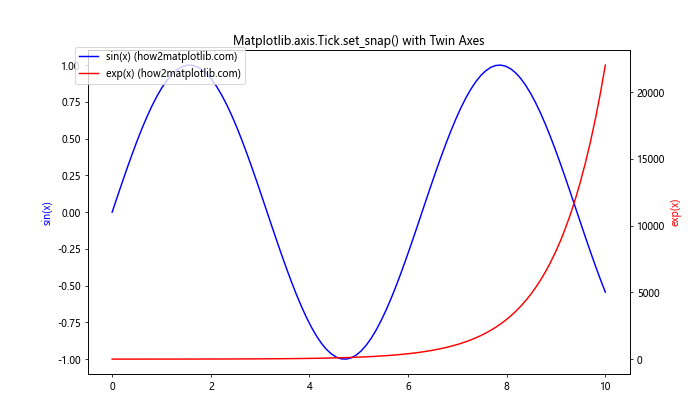
This example demonstrates how to use the Matplotlib.axis.Tick.set_snap() function with twin axes, allowing for different scales on the left and right y-axes while maintaining snapped ticks for both.
Best Practices for Using Matplotlib.axis.Tick.set_snap()
To make the most of the Matplotlib.axis.Tick.set_snap() function, consider the following best practices:
- Use consistently: Apply the function to all relevant axes in your plot for a uniform appearance.
- Combine with other tick properties: Use Matplotlib.axis.Tick.set_snap() in conjunction with other tick customization options for a polished look.
- Consider your data range: Be mindful of your data’s scale when using the snap function, as it may not always be appropriate for very small or large ranges.
- Test different settings: Experiment with True, False, and None values for the snap parameter to find the best appearance for your specific plot.
- Use with tick locators: Combine Matplotlib.axis.Tick.set_snap() with appropriate tick locators to ensure optimal tick placement.
Troubleshooting Common Issues with Matplotlib.axis.Tick.set_snap()
When working with the Matplotlib.axis.Tick.set_snap() function, you may encounter some common issues. Here are some troubleshooting tips:
- Ticks not snapping as expected: Ensure that you’re applying the function to the correct axis and that your data range is appropriate for snapping.
- Performance issues: If you’re experiencing slow performance, try limiting the number of ticks or using vectorized operations.
- Inconsistent appearance: Make sure you’re applying the snap function consistently across all relevant axes and subplots.
- Conflicts with other tick properties: If you’re using other tick customization options, ensure they’re compatible with the snap function.
Conclusion: Mastering Matplotlib.axis.Tick.set_snap() for Enhanced Visualizations
The Matplotlib.axis.Tick.set_snap() function is a powerful tool for fine-tuning the appearance of your plots in Python. By controlling the snapping behavior of tick marks, you can create cleaner, more professional-looking visualizations that effectively communicate your data.