Comprehensive Guide to Matplotlib.axis.Axis.set_alpha() Function in Python
Matplotlib.axis.Axis.set_alpha() function in Python is a powerful tool for controlling the transparency of axis elements in Matplotlib plots. This function allows you to adjust the alpha value of various axis components, enhancing the visual appeal and readability of your plots. In this comprehensive guide, we’ll explore the Matplotlib.axis.Axis.set_alpha() function in detail, covering its usage, parameters, and practical applications with numerous examples.
Understanding Matplotlib.axis.Axis.set_alpha() Function
The Matplotlib.axis.Axis.set_alpha() function is a method of the Axis class in Matplotlib. It is used to set the alpha (transparency) value for the axis elements, including tick marks, tick labels, and axis labels. The alpha value ranges from 0 (completely transparent) to 1 (completely opaque).
Basic Syntax
axis.set_alpha(alpha)
Where:
axisis an instance of the Matplotlib Axis objectalphais a float value between 0 and 1
Let’s start with a simple example to demonstrate the basic usage of Matplotlib.axis.Axis.set_alpha():
import matplotlib.pyplot as plt

# Create a simple plot
fig, ax = plt.subplots()
ax.plot([1, 2, 3, 4], [1, 4, 2, 3], label='how2matplotlib.com')

# Set the alpha value for the x-axis
ax.xaxis.set_alpha(0.5)

# Set the alpha value for the y-axis
ax.yaxis.set_alpha(0.7)

plt.title('Matplotlib.axis.Axis.set_alpha() Example')
plt.legend()
plt.show()
Output:
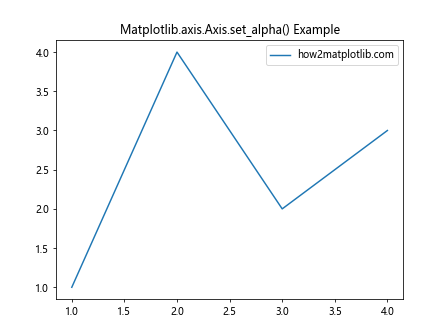
In this example, we create a simple line plot and then use Matplotlib.axis.Axis.set_alpha() to set different alpha values for the x-axis and y-axis. The x-axis is set to 50% transparency (alpha = 0.5), while the y-axis is set to 70% opacity (alpha = 0.7).
Applying Matplotlib.axis.Axis.set_alpha() to Different Axis Elements
The Matplotlib.axis.Axis.set_alpha() function affects various elements of the axis, including:
- Tick marks
- Tick labels
- Axis labels
- Axis lines
Let’s explore how to apply Matplotlib.axis.Axis.set_alpha() to these different elements:
Adjusting Tick Label Transparency
import matplotlib.pyplot as plt

fig, ax = plt.subplots()
ax.plot([1, 2, 3, 4], [1, 4, 2, 3], label='how2matplotlib.com')

# Set alpha for x-axis tick labels
for label in ax.xaxis.get_ticklabels():
    label.set_alpha(0.4)

# Set alpha for y-axis tick labels
for label in ax.yaxis.get_ticklabels():
    label.set_alpha(0.8)

plt.title('Adjusting Tick Label Transparency')
plt.legend()
plt.show()
Output:
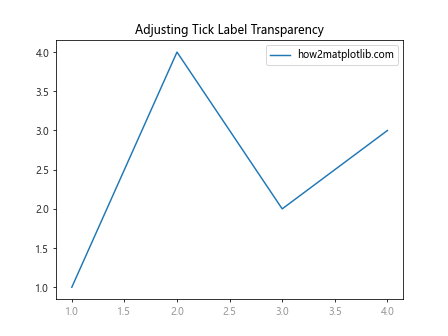
This example demonstrates how to use Matplotlib.axis.Axis.set_alpha() to adjust the transparency of tick labels individually for both x-axis and y-axis.
Modifying Axis Label Transparency
import matplotlib.pyplot as plt

fig, ax = plt.subplots()
ax.plot([1, 2, 3, 4], [1, 4, 2, 3], label='how2matplotlib.com')

# Set alpha for x-axis label
ax.xaxis.label.set_alpha(0.6)

# Set alpha for y-axis label
ax.yaxis.label.set_alpha(0.9)

ax.set_xlabel('X-axis (how2matplotlib.com)')
ax.set_ylabel('Y-axis (how2matplotlib.com)')

plt.title('Modifying Axis Label Transparency')
plt.legend()
plt.show()
Output:
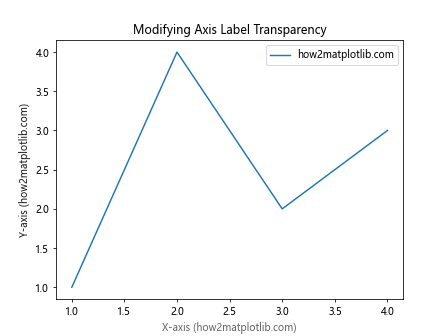
In this example, we use Matplotlib.axis.Axis.set_alpha() to adjust the transparency of axis labels separately for the x-axis and y-axis.
Advanced Applications of Matplotlib.axis.Axis.set_alpha()
Now that we’ve covered the basics, let’s explore some advanced applications of the Matplotlib.axis.Axis.set_alpha() function:
Creating a Fading Axis Effect
import matplotlib.pyplot as plt
import numpy as np

fig, ax = plt.subplots()

x = np.linspace(0, 10, 100)
y = np.sin(x)

ax.plot(x, y, label='how2matplotlib.com')

# Create a fading effect for the x-axis
for i, label in enumerate(ax.xaxis.get_ticklabels()):
    label.set_alpha(1 - i * 0.1)

plt.title('Fading Axis Effect using Matplotlib.axis.Axis.set_alpha()')
plt.legend()
plt.show()
Output:
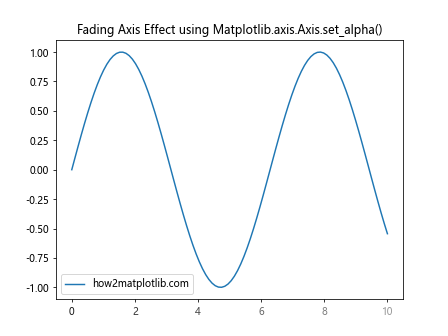
This example demonstrates how to create a fading effect along the x-axis by applying different alpha values to each tick label using Matplotlib.axis.Axis.set_alpha().
Highlighting Specific Axis Regions
import matplotlib.pyplot as plt
import numpy as np

fig, ax = plt.subplots()

x = np.linspace(0, 10, 100)
y = np.sin(x)

ax.plot(x, y, label='how2matplotlib.com')

# Highlight a specific region of the x-axis
ax.axvspan(3, 7, alpha=0.3, color='yellow')

# Set alpha for the non-highlighted regions
ax.xaxis.set_alpha(0.5)

plt.title('Highlighting Axis Regions with Matplotlib.axis.Axis.set_alpha()')
plt.legend()
plt.show()
Output:
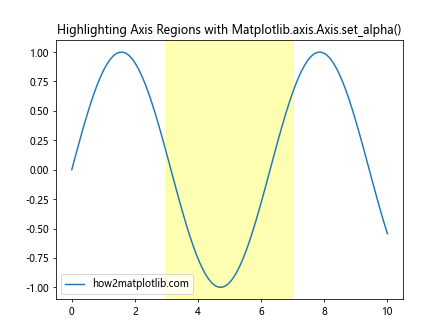
In this example, we use Matplotlib.axis.Axis.set_alpha() in combination with axvspan() to highlight a specific region of the x-axis while reducing the opacity of the rest of the axis.
Creating a Gradient Transparency Effect
import matplotlib.pyplot as plt
import numpy as np

fig, ax = plt.subplots()

x = np.linspace(0, 10, 100)
y = np.sin(x)

ax.plot(x, y, label='how2matplotlib.com')

# Create a gradient transparency effect for the y-axis
num_ticks = len(ax.yaxis.get_ticklabels())
for i, label in enumerate(ax.yaxis.get_ticklabels()):
    label.set_alpha(i / num_ticks)

plt.title('Gradient Transparency Effect using Matplotlib.axis.Axis.set_alpha()')
plt.legend()
plt.show()
Output:
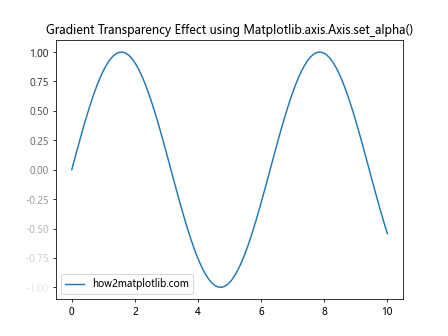
This example showcases how to create a gradient transparency effect along the y-axis using Matplotlib.axis.Axis.set_alpha().
Combining Matplotlib.axis.Axis.set_alpha() with Other Styling Options
The Matplotlib.axis.Axis.set_alpha() function can be combined with other styling options to create visually appealing and informative plots. Let’s explore some examples:
Customizing Axis Colors and Transparency
import matplotlib.pyplot as plt
import numpy as np

fig, ax = plt.subplots()

x = np.linspace(0, 10, 100)
y = np.sin(x)

ax.plot(x, y, label='how2matplotlib.com')

# Customize x-axis
ax.xaxis.set_alpha(0.7)
ax.xaxis.label.set_color('red')
ax.xaxis.label.set_alpha(0.8)

# Customize y-axis
ax.yaxis.set_alpha(0.5)
ax.yaxis.label.set_color('blue')
ax.yaxis.label.set_alpha(0.6)

ax.set_xlabel('X-axis (how2matplotlib.com)')
ax.set_ylabel('Y-axis (how2matplotlib.com)')

plt.title('Customizing Axis Colors and Transparency')
plt.legend()
plt.show()
Output:
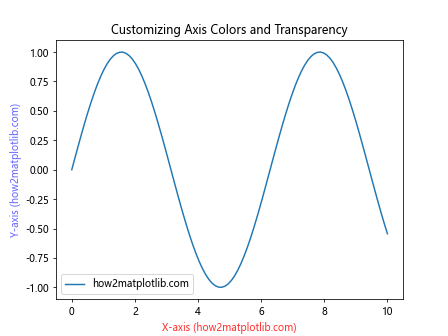
This example demonstrates how to combine Matplotlib.axis.Axis.set_alpha() with color customization to create a visually appealing plot with different colors and transparency levels for each axis.
Creating a Heatmap with Transparent Axes
import matplotlib.pyplot as plt
import numpy as np

fig, ax = plt.subplots()

data = np.random.rand(10, 10)
im = ax.imshow(data, cmap='viridis')

# Set transparency for both axes
ax.xaxis.set_alpha(0.6)
ax.yaxis.set_alpha(0.6)

# Add a colorbar
cbar = plt.colorbar(im)
cbar.ax.set_alpha(0.8)

plt.title('Heatmap with Transparent Axes using Matplotlib.axis.Axis.set_alpha()')
plt.xlabel('X-axis (how2matplotlib.com)')
plt.ylabel('Y-axis (how2matplotlib.com)')
plt.show()
Output:

In this example, we create a heatmap and use Matplotlib.axis.Axis.set_alpha() to make the axes semi-transparent, allowing the underlying data to be more visible.
Best Practices for Using Matplotlib.axis.Axis.set_alpha()
When working with the Matplotlib.axis.Axis.set_alpha() function, it’s important to keep the following best practices in mind:
- Use appropriate alpha values: Choose alpha values that enhance readability without compromising the visibility of important plot elements.
Maintain consistency: When applying transparency to multiple axes or plot elements, try to maintain a consistent style throughout your visualization.
Consider the background: Take into account the plot’s background color when setting alpha values to ensure good contrast and visibility.
Combine with other styling options: Use Matplotlib.axis.Axis.set_alpha() in conjunction with other styling options like colors, fonts, and line styles for a cohesive look.
Test different values: Experiment with various alpha values to find the optimal balance between transparency and visibility for your specific plot.
Let’s look at an example that demonstrates these best practices: