Comprehensive Guide to Matplotlib.axis.Axis.set_animated() Function in Python
Matplotlib.axis.Axis.set_animated() function in Python is a powerful tool for creating dynamic and interactive visualizations. This function is part of the Matplotlib library, which is widely used for creating static, animated, and interactive plots in Python. The set_animated() function specifically allows you to control the animation behavior of axis elements in your plots. In this comprehensive guide, we’ll explore the Matplotlib.axis.Axis.set_animated() function in depth, covering its usage, parameters, and various applications in data visualization.
Understanding the Basics of Matplotlib.axis.Axis.set_animated()
The Matplotlib.axis.Axis.set_animated() function is a method of the Axis class in Matplotlib. It is used to set the animated state of an axis. When an artist (such as an axis) is set to be animated, it is excluded from regular drawing calls and is only updated when explicitly requested. This can significantly improve the performance of animations by reducing the amount of redrawing required.
Let’s start with a simple example to demonstrate the basic usage of Matplotlib.axis.Axis.set_animated():
import matplotlib.pyplot as plt
import numpy as np

# Create a figure and axis
fig, ax = plt.subplots()

# Plot some data
x = np.linspace(0, 10, 100)
y = np.sin(x)
line, = ax.plot(x, y)

# Set the x-axis to be animated
ax.xaxis.set_animated(True)

# Add a title with the website name
plt.title("Animated X-axis - how2matplotlib.com")

plt.show()
Output:
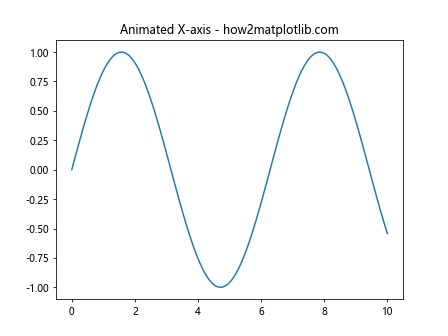
In this example, we create a simple sine wave plot and set the x-axis to be animated using the set_animated() function. This prepares the x-axis for animation, although we haven’t actually animated it yet.
Parameters of Matplotlib.axis.Axis.set_animated()
The Matplotlib.axis.Axis.set_animated() function takes a single boolean parameter:
- b (bool): If True, the artist is set to be animated. If False, the artist is set to be static.
Let’s look at an example that demonstrates toggling the animated state:
import matplotlib.pyplot as plt
import numpy as np

fig, (ax1, ax2) = plt.subplots(2, 1, figsize=(8, 8))

x = np.linspace(0, 10, 100)
y = np.sin(x)

line1, = ax1.plot(x, y)
line2, = ax2.plot(x, y)

# Set the x-axis of the first subplot to be animated
ax1.xaxis.set_animated(True)

# Leave the x-axis of the second subplot as static
ax2.xaxis.set_animated(False)

ax1.set_title("Animated X-axis - how2matplotlib.com")
ax2.set_title("Static X-axis - how2matplotlib.com")

plt.tight_layout()
plt.show()
Output:
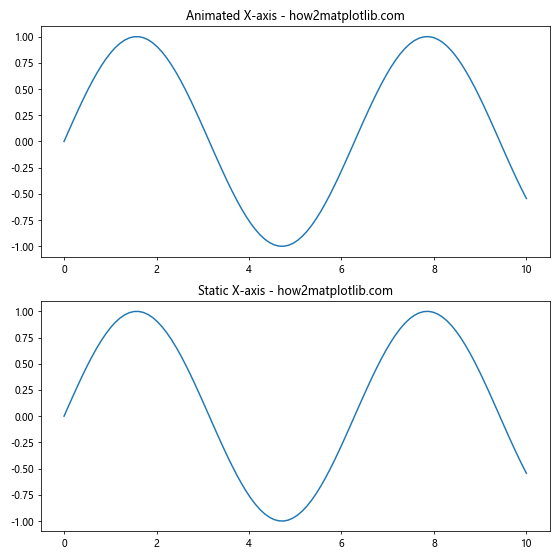
In this example, we create two subplots. The x-axis of the first subplot is set to be animated, while the x-axis of the second subplot remains static. This setup allows for a comparison between animated and non-animated axes.
Applying Matplotlib.axis.Axis.set_animated() to Different Axis Types
The set_animated() function can be applied to both x and y axes. Let’s explore how to use it with different axis types:
import matplotlib.pyplot as plt
import numpy as np

fig, (ax1, ax2) = plt.subplots(1, 2, figsize=(12, 5))

x = np.linspace(0, 10, 100)
y = np.sin(x)

line1, = ax1.plot(x, y)
line2, = ax2.plot(x, y)

# Animate x-axis of the first subplot
ax1.xaxis.set_animated(True)

# Animate y-axis of the second subplot
ax2.yaxis.set_animated(True)

ax1.set_title("Animated X-axis - how2matplotlib.com")
ax2.set_title("Animated Y-axis - how2matplotlib.com")

plt.tight_layout()
plt.show()
Output:
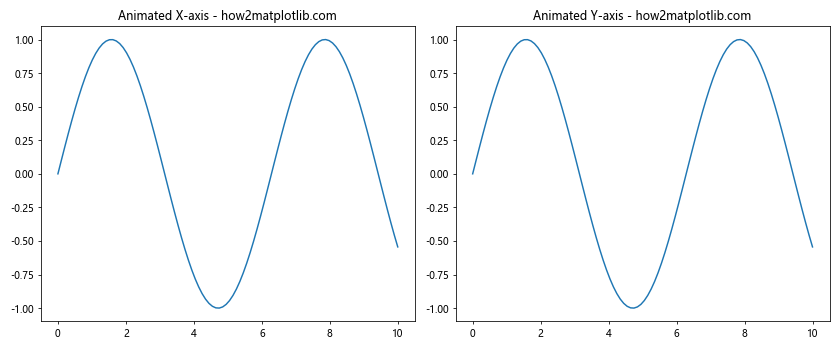
This example demonstrates how to animate the x-axis in one subplot and the y-axis in another. This flexibility allows you to create various animation effects depending on your visualization needs.
Combining Matplotlib.axis.Axis.set_animated() with Other Animation Techniques
While set_animated() prepares an axis for animation, it’s often used in conjunction with other Matplotlib animation techniques to create dynamic visualizations. Let’s explore how to combine set_animated() with the animation module:
import matplotlib.pyplot as plt
import matplotlib.animation as animation
import numpy as np

fig, ax = plt.subplots()

x = np.linspace(0, 2*np.pi, 100)
line, = ax.plot(x, np.sin(x))

# Set both axes to be animated
ax.xaxis.set_animated(True)
ax.yaxis.set_animated(True)

def animate(frame):
    line.set_ydata(np.sin(x + frame/10))
    return line,

ani = animation.FuncAnimation(fig, animate, frames=100, interval=50, blit=True)

plt.title("Animated Sine Wave - how2matplotlib.com")
plt.show()
Output:
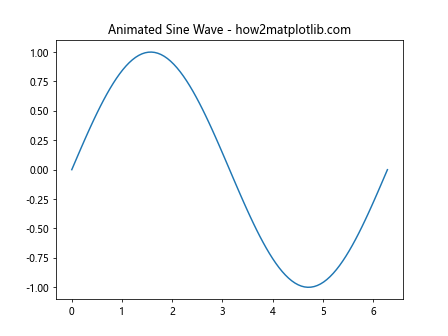
In this example, we create an animated sine wave. Both the x and y axes are set to be animated, which can improve the performance of the animation, especially for more complex plots.
Using Matplotlib.axis.Axis.set_animated() in Interactive Plots
The set_animated() function can also be useful in interactive plots where you want to update specific elements dynamically. Here’s an example of how to use it in an interactive plot:
import matplotlib.pyplot as plt
from matplotlib.widgets import Slider
import numpy as np

fig, ax = plt.subplots()
plt.subplots_adjust(bottom=0.25)

t = np.linspace(0, 1, 1000)
a0 = 5
f0 = 3
s = a0 * np.sin(2 * np.pi * f0 * t)

l, = plt.plot(t, s, lw=2)

ax.margins(x=0)
ax.set_title("Interactive Sine Wave - how2matplotlib.com")

# Set both axes to be animated
ax.xaxis.set_animated(True)
ax.yaxis.set_animated(True)

axfreq = plt.axes([0.25, 0.1, 0.65, 0.03])
freq_slider = Slider(axfreq, 'Freq', 0.1, 30.0, valinit=f0)

def update(val):
    f = freq_slider.val
    l.set_ydata(a0 * np.sin(2 * np.pi * f * t))
    fig.canvas.draw_idle()

freq_slider.on_changed(update)

plt.show()
Output:
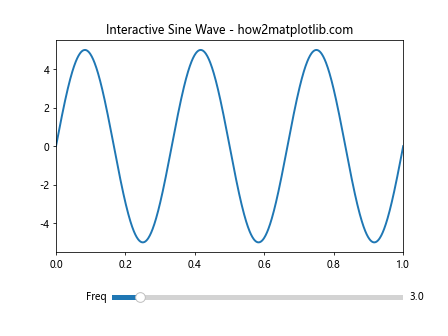
In this interactive example, we create a sine wave plot with a frequency slider. The axes are set to be animated, which can help improve the responsiveness of the plot when the slider is moved.
Performance Considerations with Matplotlib.axis.Axis.set_animated()
While set_animated() can improve animation performance, it’s important to use it judiciously. Here’s an example that demonstrates when to use set_animated():
import matplotlib.pyplot as plt
import matplotlib.animation as animation
import numpy as np

fig, (ax1, ax2) = plt.subplots(2, 1, figsize=(8, 8))

x = np.linspace(0, 2*np.pi, 100)
line1, = ax1.plot(x, np.sin(x))
line2, = ax2.plot(x, np.sin(x))

# Set axes of the first subplot to be animated
ax1.xaxis.set_animated(True)
ax1.yaxis.set_animated(True)

# Leave axes of the second subplot as static
# ax2.xaxis.set_animated(False)
# ax2.yaxis.set_animated(False)

def animate(frame):
    line1.set_ydata(np.sin(x + frame/10))
    line2.set_ydata(np.sin(x + frame/10))
    return line1, line2

ani = animation.FuncAnimation(fig, animate, frames=100, interval=50, blit=True)

ax1.set_title("Animated Axes - how2matplotlib.com")
ax2.set_title("Static Axes - how2matplotlib.com")

plt.tight_layout()
plt.show()
Output:
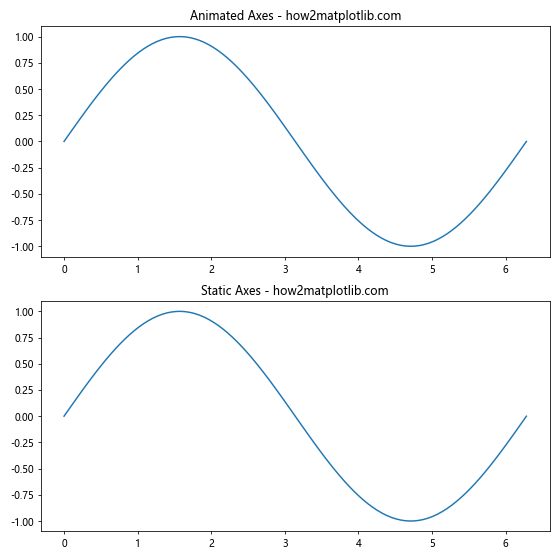
In this example, we create two subplots with identical animations. The axes of the first subplot are set to be animated, while the axes of the second subplot are left static. For simple animations like this, the performance difference may not be noticeable, but for more complex visualizations with many elements, using set_animated() can lead to smoother animations.
Advanced Usage of Matplotlib.axis.Axis.set_animated()
The set_animated() function can be particularly useful in more complex visualizations where you need fine-grained control over which elements are updated. Let’s explore an advanced example:
import matplotlib.pyplot as plt
import matplotlib.animation as animation
import numpy as np

fig, ax = plt.subplots()

# Create multiple lines
x = np.linspace(0, 2*np.pi, 100)
line1, = ax.plot(x, np.sin(x), label='sin')
line2, = ax.plot(x, np.cos(x), label='cos')
line3, = ax.plot(x, np.tan(x), label='tan')

# Set only specific elements to be animated
ax.xaxis.set_animated(True)
line1.set_animated(True)
line2.set_animated(True)
# Note: line3 is not set to be animated

ax.legend()

def animate(frame):
    line1.set_ydata(np.sin(x + frame/10))
    line2.set_ydata(np.cos(x + frame/10))
    line3.set_ydata(np.tan(x + frame/10))
    return line1, line2, line3

ani = animation.FuncAnimation(fig, animate, frames=100, interval=50, blit=True)

plt.title("Advanced Animation Control - how2matplotlib.com")
plt.show()
Output:
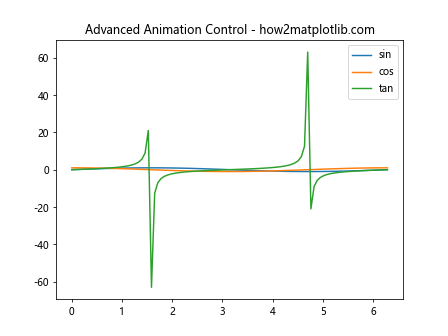
In this advanced example, we create a plot with three trigonometric functions. We set only the x-axis and two of the three lines to be animated. This level of control can be useful when you want to optimize performance by only animating the necessary elements.
Combining Matplotlib.axis.Axis.set_animated() with Blitting
Blitting is a technique used to optimize animations by only redrawing the parts of the plot that have changed. The set_animated() function works well with blitting. Here’s an example:
import matplotlib.pyplot as plt
import matplotlib.animation as animation
import numpy as np

fig, ax = plt.subplots()

x = np.linspace(0, 2*np.pi, 100)
line, = ax.plot(x, np.sin(x))

# Set the line and axes to be animated
line.set_animated(True)
ax.xaxis.set_animated(True)
ax.yaxis.set_animated(True)

# Create the initial background
fig.canvas.draw()
background = fig.canvas.copy_from_bbox(ax.bbox)

def animate(frame):
    # Restore the background
    fig.canvas.restore_region(background)

    # Update the line
    line.set_ydata(np.sin(x + frame/10))

    # Redraw just the line
    ax.draw_artist(line)

    # Display the updated figure
    fig.canvas.blit(ax.bbox)

ani = animation.FuncAnimation(fig, animate, frames=100, interval=50, blit=False)

plt.title("Blitting with set_animated() - how2matplotlib.com")
plt.show()
Output:
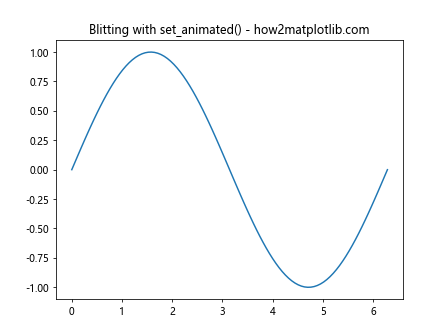
In this example, we use set_animated() in combination with manual blitting. This approach can lead to very efficient animations, especially for complex plots with many elements.
Troubleshooting Common Issues with Matplotlib.axis.Axis.set_animated()
When using set_animated(), you might encounter some common issues. Let’s look at how to troubleshoot these:
import matplotlib.pyplot as plt
import matplotlib.animation as animation
import numpy as np

fig, ax = plt.subplots()

x = np.linspace(0, 2*np.pi, 100)
line, = ax.plot(x, np.sin(x))

# Set the line to be animated, but not the axes
line.set_animated(True)
# ax.xaxis.set_animated(True)  # Commented out to demonstrate an issue
# ax.yaxis.set_animated(True)  # Commented out to demonstrate an issue

def animate(frame):
    line.set_ydata(np.sin(x + frame/10))
    return line,

ani = animation.FuncAnimation(fig, animate, frames=100, interval=50, blit=True)

plt.title("Troubleshooting Animation - how2matplotlib.com")
plt.show()
Output:
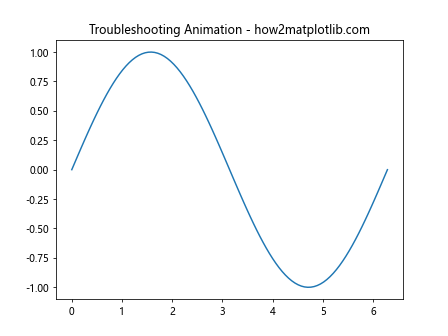
In this example, we’ve set only the line to be animated, but not the axes. This can sometimes lead to unexpected behavior, such as the axes not updating properly during the animation. To fix this, you would typically want to set both the line and the axes to be animated.
Best Practices for Using Matplotlib.axis.Axis.set_animated()
When working with set_animated(), there are several best practices to keep in mind:
- Set all relevant elements to be animated: This includes not just the data you’re updating, but also axes and other plot elements that might change.
Use set_animated() in conjunction with blitting for optimal performance.
Be consistent: If you’re using set_animated() for some elements, consider using it for all elements that will be part of the animation.
Test performance: The benefits of set_animated() can vary depending on the complexity of your plot. Always test to ensure you’re getting the desired performance improvement.
Here’s an example that demonstrates these best practices: