How to Make Filled Polygons Between Two Horizontal Curves in Python Using Matplotlib
Make filled polygons between two horizontal curves in Python using Matplotlib is a powerful technique for visualizing data and creating eye-catching plots. This article will explore various methods and techniques to achieve this effect, providing detailed explanations and code examples along the way. Whether you’re a beginner or an experienced data scientist, this guide will help you master the art of creating filled polygons between curves using Matplotlib.
Understanding the Basics of Filled Polygons in Matplotlib
Before we dive into creating filled polygons between two horizontal curves, let’s first understand what filled polygons are and how they work in Matplotlib. Make filled polygons between two horizontal curves in Python using Matplotlib involves creating a closed shape between two curves and filling it with a specified color or pattern.
Matplotlib provides several functions to create filled polygons, but the most commonly used one for this purpose is fill_between(). This function allows you to specify two x-arrays and two y-arrays, which define the upper and lower boundaries of the polygon.
Let’s start with a simple example to illustrate this concept:
import matplotlib.pyplot as plt
import numpy as np

x = np.linspace(0, 10, 100)
y1 = np.sin(x)
y2 = np.cos(x)

plt.figure(figsize=(10, 6))
plt.fill_between(x, y1, y2, alpha=0.5, label='Filled area')
plt.plot(x, y1, label='Sine curve')
plt.plot(x, y2, label='Cosine curve')
plt.title('Make filled polygons between two horizontal curves in Python using Matplotlib')
plt.xlabel('X-axis')
plt.ylabel('Y-axis')
plt.legend()
plt.text(5, 0, 'how2matplotlib.com', fontsize=12, ha='center')
plt.show()
Output:
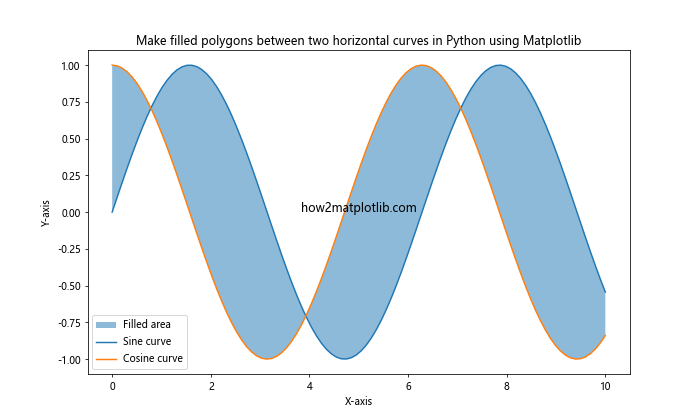
In this example, we create two curves using sine and cosine functions and then use fill_between() to create a filled polygon between them. The alpha parameter controls the transparency of the filled area.
Creating Filled Polygons with Custom Colors and Patterns
Make filled polygons between two horizontal curves in Python using Matplotlib becomes more interesting when you start experimenting with different colors and patterns. Matplotlib offers a wide range of options to customize the appearance of your filled polygons.
Here’s an example that demonstrates how to use custom colors and patterns:
import matplotlib.pyplot as plt
import numpy as np

x = np.linspace(0, 10, 100)
y1 = np.exp(-x/10) * np.sin(x)
y2 = -np.exp(-x/10) * np.sin(x)

plt.figure(figsize=(10, 6))
plt.fill_between(x, y1, y2, color='skyblue', alpha=0.7, hatch='///', label='Filled area')
plt.plot(x, y1, color='navy', label='Upper curve')
plt.plot(x, y2, color='darkred', label='Lower curve')
plt.title('Make filled polygons between two horizontal curves in Python using Matplotlib')
plt.xlabel('X-axis')
plt.ylabel('Y-axis')
plt.legend()
plt.text(5, 0, 'how2matplotlib.com', fontsize=12, ha='center')
plt.show()
Output:
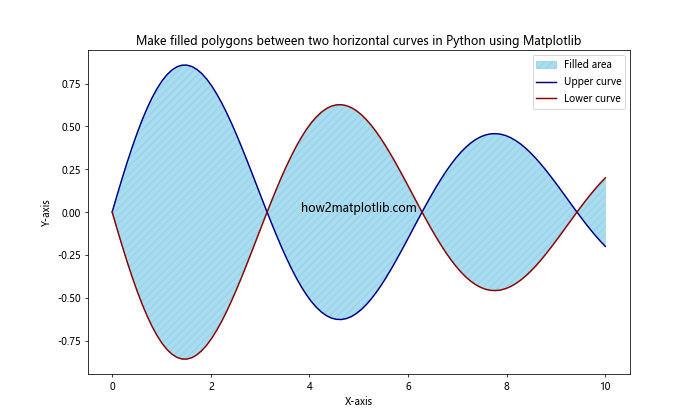
In this example, we use a custom color (‘skyblue’) for the filled area and add a hatching pattern (‘///’) to create a unique visual effect. The alpha parameter is set to 0.7 to make the filled area slightly transparent.
Creating Multiple Filled Polygons
Make filled polygons between two horizontal curves in Python using Matplotlib can be extended to create multiple filled polygons in a single plot. This technique is particularly useful when you want to highlight different regions or compare multiple datasets.
Here’s an example that demonstrates how to create multiple filled polygons:
import matplotlib.pyplot as plt
import numpy as np

x = np.linspace(0, 10, 100)
y1 = np.sin(x)
y2 = np.sin(2*x)
y3 = np.sin(3*x)

plt.figure(figsize=(10, 6))
plt.fill_between(x, y1, y2, where=(y1 > y2), color='red', alpha=0.5, label='y1 > y2')
plt.fill_between(x, y1, y2, where=(y1 <= y2), color='blue', alpha=0.5, label='y1 <= y2')
plt.fill_between(x, y2, y3, color='green', alpha=0.3, label='y2 to y3')
plt.plot(x, y1, label='y1 = sin(x)')
plt.plot(x, y2, label='y2 = sin(2x)')
plt.plot(x, y3, label='y3 = sin(3x)')
plt.title('Make filled polygons between two horizontal curves in Python using Matplotlib')
plt.xlabel('X-axis')
plt.ylabel('Y-axis')
plt.legend()
plt.text(5, 0, 'how2matplotlib.com', fontsize=12, ha='center')
plt.show()
Output:
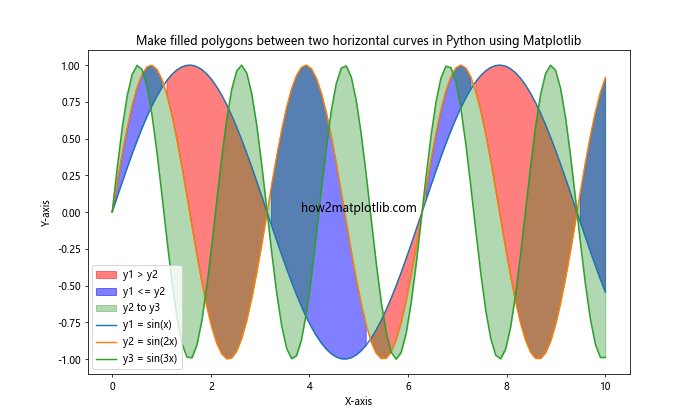
In this example, we create three sine curves with different frequencies and use fill_between() to create multiple filled polygons. The where parameter allows us to specify conditions for filling different regions.
Using Gradients in Filled Polygons
Make filled polygons between two horizontal curves in Python using Matplotlib can be enhanced by applying gradients to the filled areas. This technique can add depth and visual interest to your plots.
Here's an example that demonstrates how to create a gradient-filled polygon:
import matplotlib.pyplot as plt
import numpy as np
from matplotlib.colors import LinearSegmentedColormap

x = np.linspace(0, 10, 100)
y1 = np.sin(x)
y2 = np.cos(x)

colors = ['#ff9999', '#66b3ff']
n_bins = 100
cmap = LinearSegmentedColormap.from_list('custom', colors, N=n_bins)

plt.figure(figsize=(10, 6))
for i in range(n_bins):
    plt.fill_between(x, y1, y2, where=(y1 > y2), color=cmap(i/n_bins), alpha=0.1)
plt.plot(x, y1, color='red', label='Sine curve')
plt.plot(x, y2, color='blue', label='Cosine curve')
plt.title('Make filled polygons between two horizontal curves in Python using Matplotlib')
plt.xlabel('X-axis')
plt.ylabel('Y-axis')
plt.legend()
plt.text(5, 0, 'how2matplotlib.com', fontsize=12, ha='center')
plt.show()
Output:
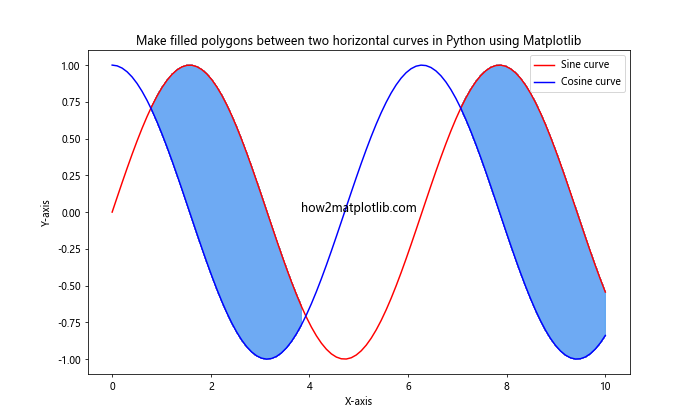
In this example, we create a custom color map using LinearSegmentedColormap and use it to create a gradient effect in the filled area between the sine and cosine curves.
Creating Stacked Area Plots
Make filled polygons between two horizontal curves in Python using Matplotlib is often used to create stacked area plots, which are useful for visualizing cumulative data or comparing multiple datasets over time.
Here's an example of how to create a stacked area plot:
import matplotlib.pyplot as plt
import numpy as np

x = np.linspace(0, 10, 100)
y1 = np.random.rand(100)
y2 = np.random.rand(100)
y3 = np.random.rand(100)

plt.figure(figsize=(10, 6))
plt.fill_between(x, 0, y1, alpha=0.5, label='Dataset 1')
plt.fill_between(x, y1, y1+y2, alpha=0.5, label='Dataset 2')
plt.fill_between(x, y1+y2, y1+y2+y3, alpha=0.5, label='Dataset 3')
plt.title('Make filled polygons between two horizontal curves in Python using Matplotlib')
plt.xlabel('X-axis')
plt.ylabel('Y-axis')
plt.legend()
plt.text(5, 1.5, 'how2matplotlib.com', fontsize=12, ha='center')
plt.show()
Output:
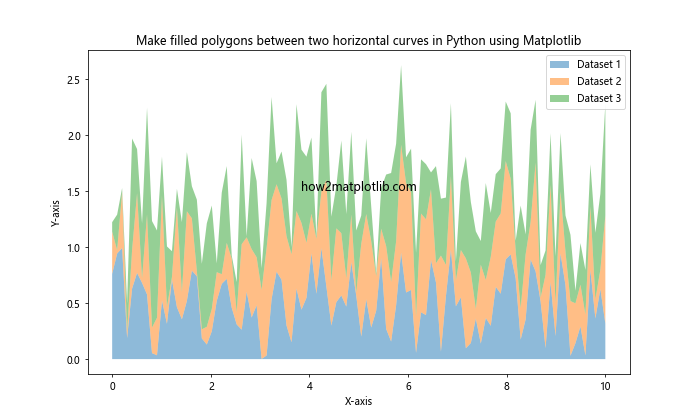
In this example, we create three random datasets and stack them on top of each other using fill_between(). This technique is particularly useful for visualizing proportional or percentage data.
Creating Filled Polygons with Interpolation
Make filled polygons between two horizontal curves in Python using Matplotlib can be enhanced by using interpolation techniques to create smoother curves. This is particularly useful when working with sparse data points.
Here's an example that demonstrates how to create filled polygons with interpolation:
import matplotlib.pyplot as plt
import numpy as np
from scipy.interpolate import interp1d

x = np.array([0, 2, 4, 6, 8, 10])
y1 = np.array([1, 3, 2, 4, 3, 5])
y2 = np.array([0, 1, 0, 2, 1, 3])

x_smooth = np.linspace(0, 10, 200)
f1 = interp1d(x, y1, kind='cubic')
f2 = interp1d(x, y2, kind='cubic')

y1_smooth = f1(x_smooth)
y2_smooth = f2(x_smooth)

plt.figure(figsize=(10, 6))
plt.fill_between(x_smooth, y1_smooth, y2_smooth, alpha=0.5, label='Interpolated area')
plt.plot(x, y1, 'ro', label='Original data (upper)')
plt.plot(x, y2, 'bo', label='Original data (lower)')
plt.plot(x_smooth, y1_smooth, 'r--', label='Interpolated curve (upper)')
plt.plot(x_smooth, y2_smooth, 'b--', label='Interpolated curve (lower)')
plt.title('Make filled polygons between two horizontal curves in Python using Matplotlib')
plt.xlabel('X-axis')
plt.ylabel('Y-axis')
plt.legend()
plt.text(5, 2.5, 'how2matplotlib.com', fontsize=12, ha='center')
plt.show()
Output:
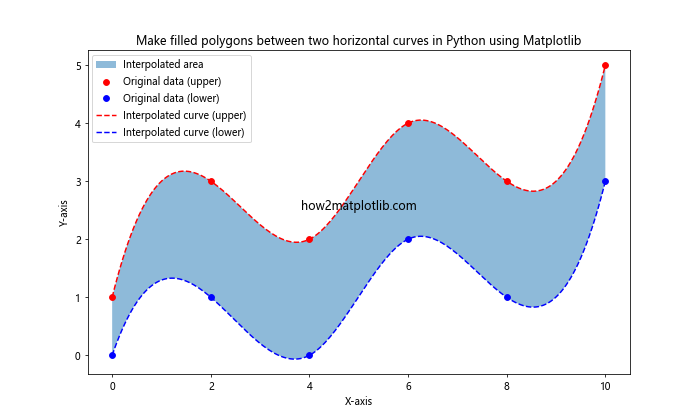
In this example, we use scipy.interpolate.interp1d to create smooth curves from sparse data points, and then use these interpolated curves to create a filled polygon.
Creating Filled Polygons with Shading
Make filled polygons between two horizontal curves in Python using Matplotlib can be further enhanced by adding shading effects. This technique can help emphasize certain areas of your plot or create a sense of depth.
Here's an example that demonstrates how to create filled polygons with shading:
import matplotlib.pyplot as plt
import numpy as np
from matplotlib.colors import LightSource

x = np.linspace(0, 10, 100)
y1 = np.sin(x) + 1
y2 = np.cos(x)

ls = LightSource(azdeg=315, altdeg=45)
cmap = plt.cm.coolwarm

plt.figure(figsize=(10, 6))
plt.fill_between(x, y1, y2, alpha=0.5)
plt.imshow(ls.shade(np.c_[y1, y2].T, cmap=cmap), extent=[0, 10, y2.min(), y1.max()], aspect='auto', alpha=0.5)
plt.plot(x, y1, color='red', label='Upper curve')
plt.plot(x, y2, color='blue', label='Lower curve')
plt.title('Make filled polygons between two horizontal curves in Python using Matplotlib')
plt.xlabel('X-axis')
plt.ylabel('Y-axis')
plt.legend()
plt.text(5, 0, 'how2matplotlib.com', fontsize=12, ha='center')
plt.show()
Output:
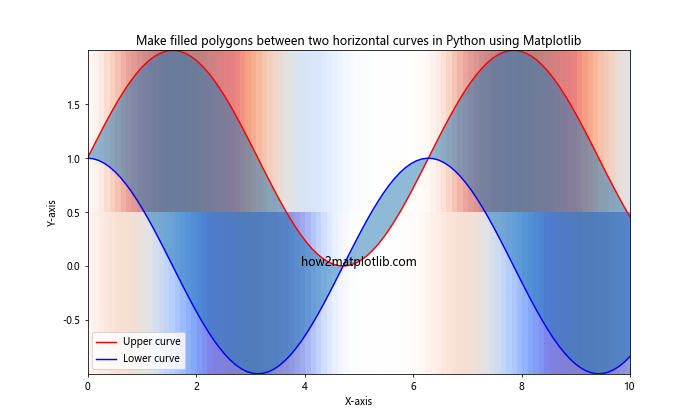
In this example, we use matplotlib.colors.LightSource to create a shading effect on the filled area between the two curves. This technique can be particularly effective for visualizing terrain or topographical data.
Creating Filled Polygons with Transparency Gradients
Make filled polygons between two horizontal curves in Python using Matplotlib can be made more interesting by applying transparency gradients. This technique allows you to create a fade effect within the filled area.
Here's an example that demonstrates how to create filled polygons with transparency gradients:
import matplotlib.pyplot as plt
import numpy as np
from matplotlib.colors import LinearSegmentedColormap

x = np.linspace(0, 10, 100)
y1 = np.sin(x) + 2
y2 = np.sin(x)

colors = [(1, 0, 0, 1), (1, 0, 0, 0)]  # Red with varying alpha
cmap = LinearSegmentedColormap.from_list('custom', colors, N=100)

plt.figure(figsize=(10, 6))
for i in range(100):
    alpha = 1 - i/100
    plt.fill_between(x, y1, y2, where=(y1 > y2), color=cmap(i/100), alpha=alpha)
plt.plot(x, y1, color='red', label='Upper curve')
plt.plot(x, y2, color='blue', label='Lower curve')
plt.title('Make filled polygons between two horizontal curves in Python using Matplotlib')
plt.xlabel('X-axis')
plt.ylabel('Y-axis')
plt.legend()
plt.text(5, 1, 'how2matplotlib.com', fontsize=12, ha='center')
plt.show()
Output:
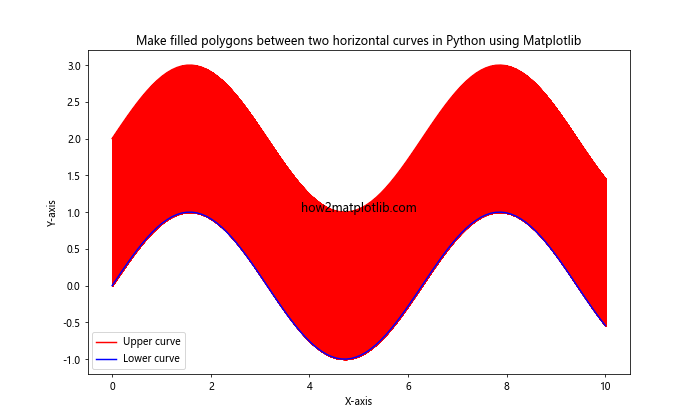
In this example, we create a custom colormap with varying alpha values and use it to create a transparency gradient in the filled area between the two curves.
Creating Filled Polygons with Patterns and Textures
Make filled polygons between two horizontal curves in Python using Matplotlib can be further customized by adding patterns and textures to the filled areas. This technique can help differentiate between multiple regions or add visual interest to your plots.
Here's an example that demonstrates how to create filled polygons with patterns and textures:
import matplotlib.pyplot as plt
import numpy as np

x = np.linspace(0, 10, 100)
y1 = np.sin(x) + 2
y2 = np.sin(x)
y3 = np.cos(x)

plt.figure(figsize=(10, 6))
plt.fill_between(x, y1, y2, where=(y1 > y2), color='lightblue', alpha=0.5, hatch='///', label='Region 1')
plt.fill_between(x, y2, y3, where=(y2 > y3), color='lightgreen', alpha=0.5, hatch='...', label='Region 2')
plt.fill_between(x, y2, y3, where=(y2 <= y3), color='lightyellow', alpha=0.5, hatch='xxx', label='Region 3')
plt.plot(x, y1, color='red', label='Curve 1')
plt.plot(x, y2, color='blue', label='Curve 2')
plt.plot(x, y3, color='green', label='Curve 3')
plt.title('Make filled polygons between two horizontal curves in Python using Matplotlib')
plt.xlabel('X-axis')
plt.ylabel('Y-axis')
plt.legend()
plt.text(5, 0, 'how2matplotlib.com', fontsize=12, ha='center')
plt.show()
Output:
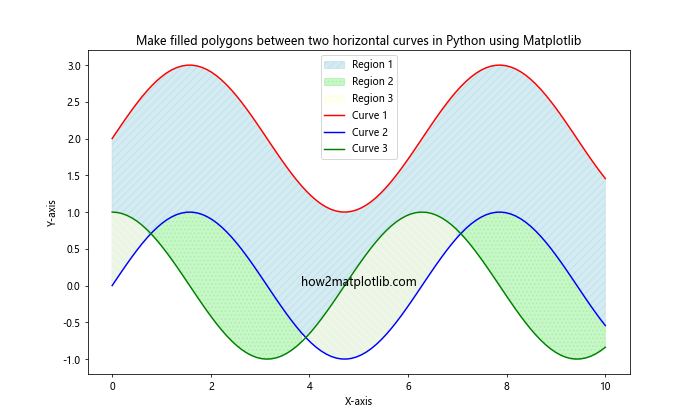
In this example, we use different hatch patterns ('///', '...', 'xxx') to create distinct textures for each filled region between the curves.
Creating Filled Polygons with Custom Shapes
Make filled polygons between two horizontal curves in Python using Matplotlib doesn't always have to involve mathematical functions. You can create custom shapes and fill the areas between them as well.
Here's an example that demonstrates how to create filled polygons with custom shapes:
import matplotlib.pyplot as plt
import numpy as np
from matplotlib.path import Path
import matplotlib.patches as patches

fig, ax = plt.subplots(figsize=(10, 6))

verts1 = [
    (0., 0.),  # left, bottom
    (0., 2.),  # left, top
    (1., 3.),  # right, top
    (2., 2.),  # right, bottom
    (2., 0.),  # right, bottom
    (0., 0.),  # ignored
]

verts2 = [
    (0., 0.),  # left, bottom
    (0., 1.),  # left, top
    (1., 2.),  # right, top
    (2., 1.),  # right, bottom
    (2., 0.),  # right, bottom
    (0., 0.),  # ignored
]

codes = [
    Path.MOVETO,
    Path.LINETO,
    Path.LINETO,
    Path.LINETO,
    Path.LINETO,
    Path.CLOSEPOLY,
]

path1 = Path(verts1, codes)
path2 = Path(verts2, codes)

patch1 = patches.PathPatch(path1, facecolor='none', edgecolor='r', lw=2)
patch2 = patches.PathPatch(path2, facecolor='none', edgecolor='b', lw=2)

ax.add_patch(patch1)
ax.add_patch(patch2)

ax.fill_between([0, 1, 2], [0, 3, 2], [0, 2, 1], alpha=0.5, color='lightgreen')

ax.set_xlim(-0.5, 2.5)
ax.set_ylim(-0.5, 3.5)
ax.set_title('Make filled polygons between two horizontal curves in Python using Matplotlib')
ax.set_xlabel('X-axis')
ax.set_ylabel('Y-axis')
ax.text(1, -0.3, 'how2matplotlib.com', fontsize=12, ha='center')

plt.show()
Output:
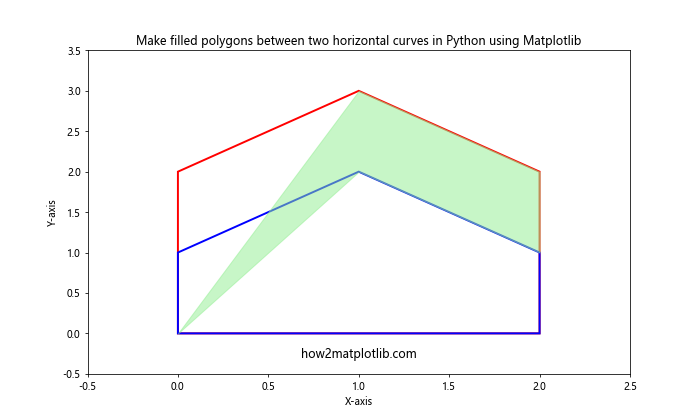
In this example, we create two custom shapes using matplotlib.path.Path and fill the area between them using fill_between(). This technique can be useful for creating infographics or visualizing complex shapes.
Creating Filled Polygons with Polar Coordinates
Make filled polygons between two horizontal curves in Python using Matplotlib can also be applied to polar coordinate systems. This is particularly useful for creating radar charts or visualizing circular data.
Here's an example that demonstrates how to create filled polygons in a polar coordinate system:
import matplotlib.pyplot as plt
import numpy as np

theta = np.linspace(0, 2*np.pi, 100)
r1 = 1 + 0.5 * np.sin(3*theta)
r2 = 0.5 + 0.25 * np.sin(5*theta)

fig, ax = plt.subplots(figsize=(10, 10), subplot_kw=dict(projection='polar'))
ax.fill_between(theta, r1, r2, alpha=0.5)
ax.plot(theta, r1, color='red', label='Outer curve')
ax.plot(theta, r2, color='blue', label='Inner curve')
ax.set_title('Make filled polygons between two horizontal curves in Python using Matplotlib')
ax.legend()
ax.text(np.pi/2, 0.5, 'how2matplotlib.com', fontsize=12, ha='center')

plt.show()
Output:
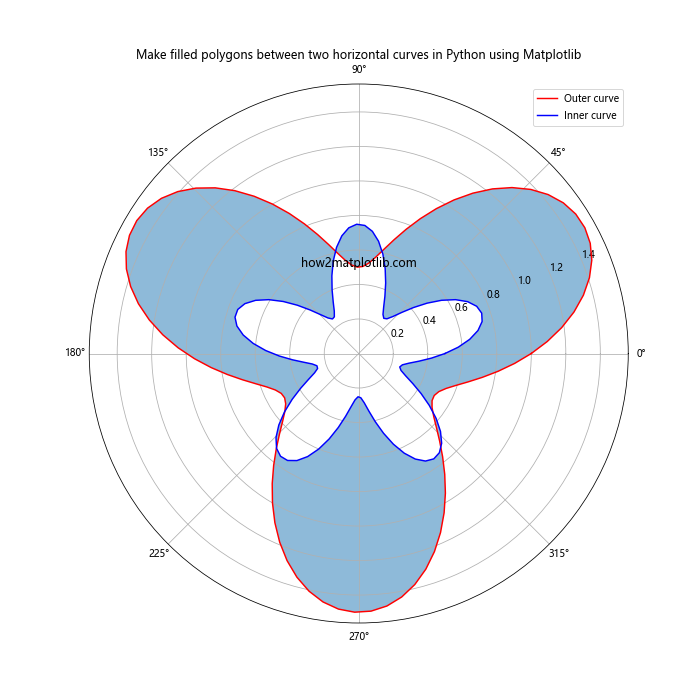
In this example, we create two curves in polar coordinates and fill the area between them. This technique can be useful for creating rose plots or visualizing directional data.
Conclusion
Make filled polygons between two horizontal curves in Python using Matplotlib is a versatile and powerful technique that can be applied to a wide range of data visualization tasks. From simple 2D plots to complex 3D visualizations, filled polygons can help highlight relationships between curves, emphasize specific regions of interest, and create visually appealing graphics.