How to Use Error Bars in a Matplotlib Scatter Plot
Use error bars in a Matplotlib scatter plot to enhance the visual representation of data uncertainty in your plots. Error bars are an essential tool for displaying the variability of data points in scatter plots, providing valuable information about the precision and reliability of measurements. This comprehensive guide will walk you through various techniques and best practices for incorporating error bars into your Matplotlib scatter plots, helping you create more informative and visually appealing data visualizations.
Understanding Error Bars in Scatter Plots
Before diving into the implementation details, it’s crucial to understand what error bars represent in a scatter plot. Error bars are graphical representations of the variability of data and are used to indicate the error or uncertainty in a reported measurement. When you use error bars in a Matplotlib scatter plot, you’re essentially showing the range of possible values for each data point.
Error bars can represent various types of uncertainty, including:
- Standard deviation
- Standard error of the mean
- Confidence intervals
- Custom error values
By incorporating error bars into your scatter plots, you provide viewers with a more complete picture of your data, allowing for better interpretation and analysis.
Basic Implementation of Error Bars in Matplotlib Scatter Plots
To begin using error bars in a Matplotlib scatter plot, you’ll need to import the necessary libraries and set up your data. Let’s start with a simple example to demonstrate the basic implementation.
import matplotlib.pyplot as plt
import numpy as np

# Generate sample data
x = np.linspace(0, 10, 50)
y = np.sin(x) + np.random.normal(0, 0.1, 50)
yerr = np.random.uniform(0.05, 0.2, 50)

# Create scatter plot with error bars
plt.figure(figsize=(10, 6))
plt.errorbar(x, y, yerr=yerr, fmt='o', capsize=5, label='Data with Error Bars')
plt.xlabel('X-axis (how2matplotlib.com)')
plt.ylabel('Y-axis (how2matplotlib.com)')
plt.title('Scatter Plot with Error Bars')
plt.legend()
plt.grid(True)
plt.show()
Output:
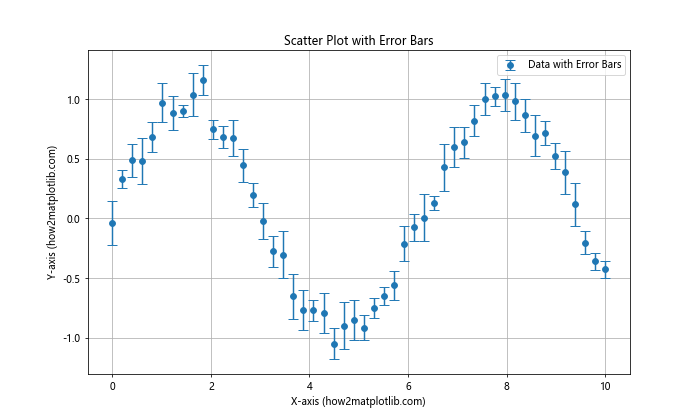
In this example, we use the errorbar() function to create a scatter plot with error bars. The fmt='o' parameter specifies that we want to use circular markers for the data points. The yerr parameter is used to specify the error values for the y-axis. The capsize parameter determines the width of the error bar caps.
Customizing Error Bar Appearance
When you use error bars in a Matplotlib scatter plot, you have various options to customize their appearance. Let’s explore some of these customization techniques:
Changing Error Bar Colors
You can change the color of the error bars to make them stand out or match your plot’s color scheme:
import matplotlib.pyplot as plt
import numpy as np

x = np.linspace(0, 10, 20)
y = np.exp(-x/10) + np.random.normal(0, 0.05, 20)
yerr = np.random.uniform(0.05, 0.1, 20)

plt.figure(figsize=(10, 6))
plt.errorbar(x, y, yerr=yerr, fmt='o', capsize=5, color='blue', ecolor='red', label='Data (how2matplotlib.com)')
plt.xlabel('X-axis')
plt.ylabel('Y-axis')
plt.title('Scatter Plot with Colored Error Bars')
plt.legend()
plt.grid(True)
plt.show()
Output:
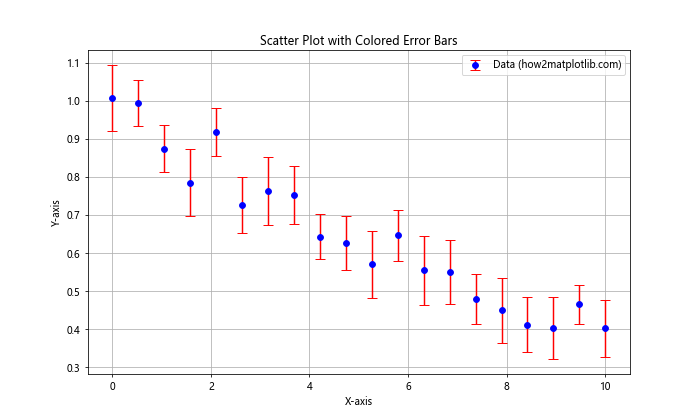
In this example, we use the color parameter to set the color of the markers and the ecolor parameter to set the color of the error bars.
Adjusting Error Bar Line Width
You can modify the thickness of the error bars to make them more or less prominent:
import matplotlib.pyplot as plt
import numpy as np

x = np.arange(0, 10, 0.5)
y = np.sin(x) + np.random.normal(0, 0.2, len(x))
yerr = np.random.uniform(0.1, 0.3, len(x))

plt.figure(figsize=(10, 6))
plt.errorbar(x, y, yerr=yerr, fmt='o', capsize=5, elinewidth=2, label='Data (how2matplotlib.com)')
plt.xlabel('X-axis')
plt.ylabel('Y-axis')
plt.title('Scatter Plot with Thicker Error Bars')
plt.legend()
plt.grid(True)
plt.show()
Output:
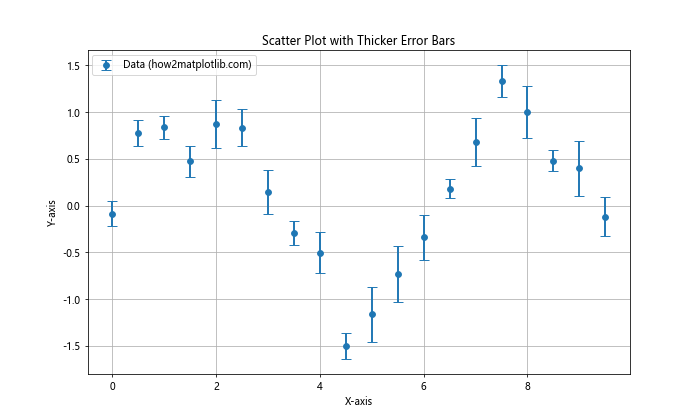
The elinewidth parameter is used to adjust the thickness of the error bars.
Adding Horizontal Error Bars
So far, we’ve focused on vertical error bars. However, when you use error bars in a Matplotlib scatter plot, you can also add horizontal error bars to represent uncertainty in the x-axis values:
import matplotlib.pyplot as plt
import numpy as np

x = np.linspace(0, 10, 15)
y = np.exp(-x/5) + np.random.normal(0, 0.05, 15)
xerr = np.random.uniform(0.1, 0.5, 15)
yerr = np.random.uniform(0.05, 0.2, 15)

plt.figure(figsize=(10, 6))
plt.errorbar(x, y, xerr=xerr, yerr=yerr, fmt='o', capsize=5, label='Data (how2matplotlib.com)')
plt.xlabel('X-axis')
plt.ylabel('Y-axis')
plt.title('Scatter Plot with Horizontal and Vertical Error Bars')
plt.legend()
plt.grid(True)
plt.show()
Output:
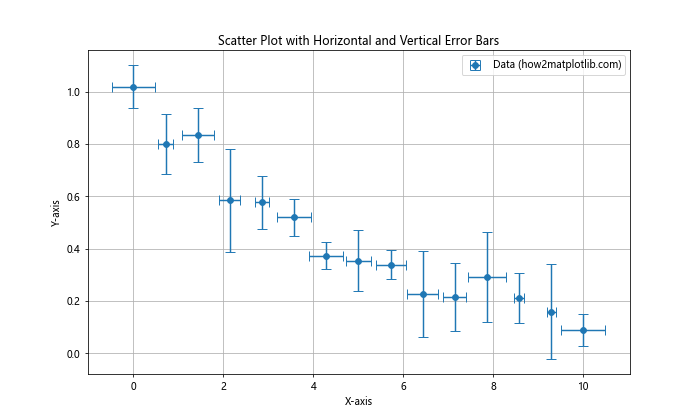
In this example, we use both xerr and yerr parameters to add horizontal and vertical error bars, respectively.
Using Asymmetric Error Bars
When you use error bars in a Matplotlib scatter plot, you’re not limited to symmetric error bars. You can create asymmetric error bars to represent different upper and lower error values:
import matplotlib.pyplot as plt
import numpy as np

x = np.linspace(0, 10, 20)
y = np.sin(x) + np.random.normal(0, 0.1, 20)
yerr_lower = np.random.uniform(0.05, 0.2, 20)
yerr_upper = np.random.uniform(0.1, 0.3, 20)

plt.figure(figsize=(10, 6))
plt.errorbar(x, y, yerr=[yerr_lower, yerr_upper], fmt='o', capsize=5, label='Data (how2matplotlib.com)')
plt.xlabel('X-axis')
plt.ylabel('Y-axis')
plt.title('Scatter Plot with Asymmetric Error Bars')
plt.legend()
plt.grid(True)
plt.show()
Output:
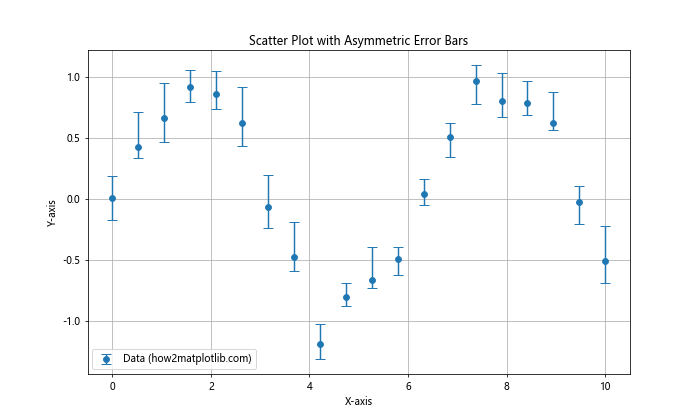
To create asymmetric error bars, pass a list of two arrays to the yerr parameter, where the first array represents the lower errors and the second array represents the upper errors.
Combining Error Bars with Other Plot Types
You can combine error bars with other plot types to create more complex visualizations. For example, you can use error bars in a Matplotlib scatter plot along with a line plot:
import matplotlib.pyplot as plt
import numpy as np

x = np.linspace(0, 10, 30)
y = np.exp(-x/5) + np.random.normal(0, 0.05, 30)
yerr = np.random.uniform(0.05, 0.15, 30)

plt.figure(figsize=(10, 6))
plt.errorbar(x, y, yerr=yerr, fmt='o', capsize=5, label='Data Points (how2matplotlib.com)')
plt.plot(x, np.exp(-x/5), 'r-', label='Exponential Decay')
plt.xlabel('X-axis')
plt.ylabel('Y-axis')
plt.title('Scatter Plot with Error Bars and Fitted Curve')
plt.legend()
plt.grid(True)
plt.show()
Output:
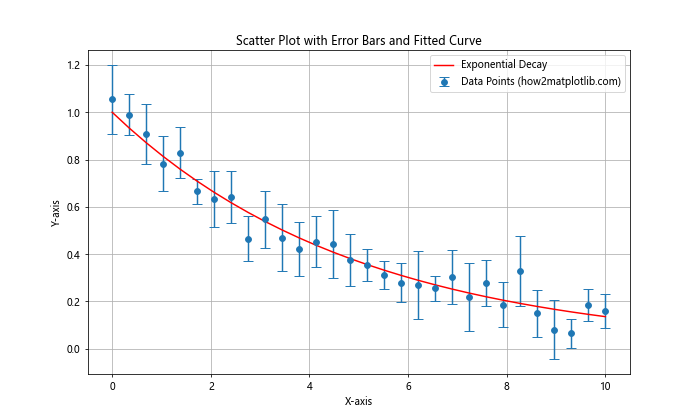
This example demonstrates how to combine a scatter plot with error bars and a line plot showing the underlying trend.
Error Bars in Logarithmic Scales
When working with data that spans multiple orders of magnitude, you might want to use error bars in a Matplotlib scatter plot with logarithmic scales:
import matplotlib.pyplot as plt
import numpy as np

x = np.logspace(0, 2, 20)
y = np.log10(x) + np.random.normal(0, 0.1, 20)
yerr = np.random.uniform(0.05, 0.2, 20)

plt.figure(figsize=(10, 6))
plt.errorbar(x, y, yerr=yerr, fmt='o', capsize=5, label='Data (how2matplotlib.com)')
plt.xscale('log')
plt.xlabel('X-axis (log scale)')
plt.ylabel('Y-axis')
plt.title('Scatter Plot with Error Bars on Log Scale')
plt.legend()
plt.grid(True)
plt.show()
Output:
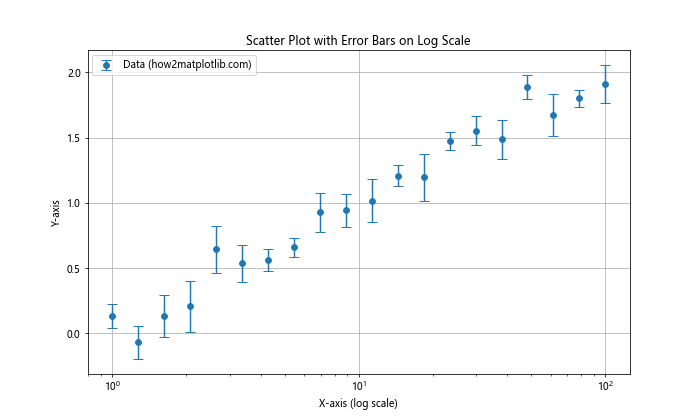
In this example, we use plt.xscale('log') to set the x-axis to a logarithmic scale.
Error Bars with Categorical Data
You can also use error bars in a Matplotlib scatter plot when working with categorical data:
import matplotlib.pyplot as plt
import numpy as np

categories = ['A', 'B', 'C', 'D', 'E']
values = np.random.rand(5)
errors = np.random.uniform(0.1, 0.3, 5)

plt.figure(figsize=(10, 6))
plt.errorbar(categories, values, yerr=errors, fmt='o', capsize=5, label='Data (how2matplotlib.com)')
plt.xlabel('Categories')
plt.ylabel('Values')
plt.title('Scatter Plot with Error Bars for Categorical Data')
plt.legend()
plt.grid(True)
plt.show()
Output:
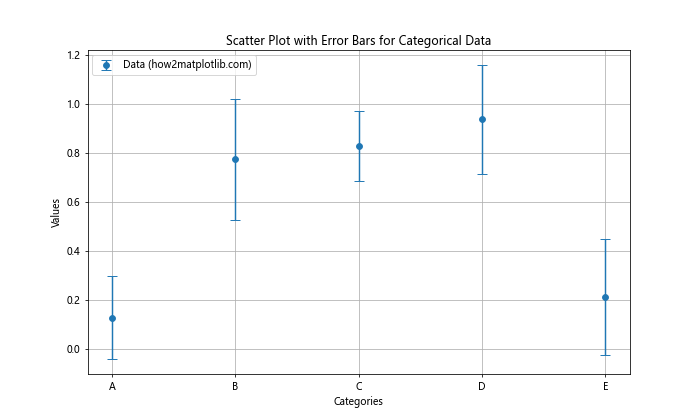
This example demonstrates how to create a scatter plot with error bars for categorical data on the x-axis.
Error Bars in Subplots
When you use error bars in a Matplotlib scatter plot, you might want to create multiple subplots to compare different datasets:
import matplotlib.pyplot as plt
import numpy as np

x = np.linspace(0, 10, 20)
y1 = np.sin(x) + np.random.normal(0, 0.1, 20)
y2 = np.cos(x) + np.random.normal(0, 0.1, 20)
yerr1 = np.random.uniform(0.05, 0.2, 20)
yerr2 = np.random.uniform(0.05, 0.2, 20)

fig, (ax1, ax2) = plt.subplots(1, 2, figsize=(15, 6))

ax1.errorbar(x, y1, yerr=yerr1, fmt='o', capsize=5, label='Sin(x) (how2matplotlib.com)')
ax1.set_xlabel('X-axis')
ax1.set_ylabel('Y-axis')
ax1.set_title('Scatter Plot with Error Bars (Sin)')
ax1.legend()
ax1.grid(True)

ax2.errorbar(x, y2, yerr=yerr2, fmt='o', capsize=5, label='Cos(x) (how2matplotlib.com)')
ax2.set_xlabel('X-axis')
ax2.set_ylabel('Y-axis')
ax2.set_title('Scatter Plot with Error Bars (Cos)')
ax2.legend()
ax2.grid(True)

plt.tight_layout()
plt.show()
Output:
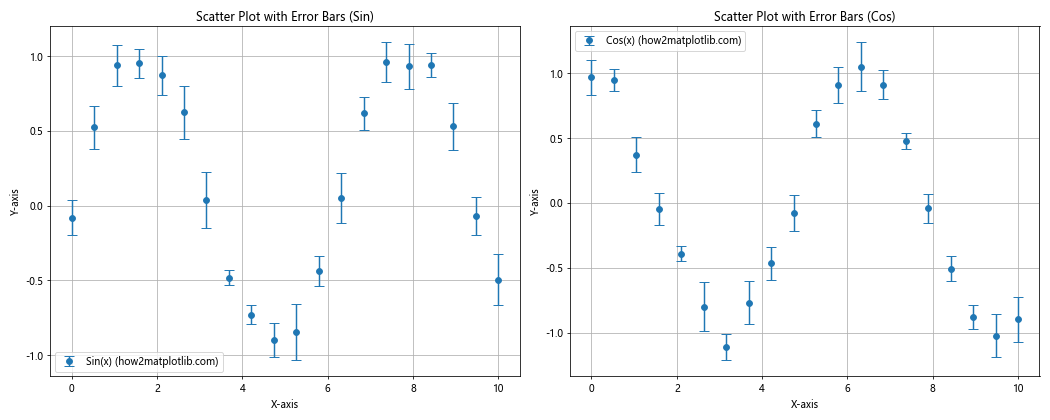
This example creates two subplots, each containing a scatter plot with error bars.
Error Bars with Different Marker Styles
You can customize the appearance of your scatter plot by using different marker styles when you use error bars in a Matplotlib scatter plot:
import matplotlib.pyplot as plt
import numpy as np

x = np.linspace(0, 10, 15)
y1 = np.sin(x) + np.random.normal(0, 0.1, 15)
y2 = np.cos(x) + np.random.normal(0, 0.1, 15)
yerr1 = np.random.uniform(0.05, 0.2, 15)
yerr2 = np.random.uniform(0.05, 0.2, 15)

plt.figure(figsize=(10, 6))
plt.errorbar(x, y1, yerr=yerr1, fmt='s', capsize=5, label='Sin(x) (how2matplotlib.com)')
plt.errorbar(x, y2, yerr=yerr2, fmt='^', capsize=5, label='Cos(x) (how2matplotlib.com)')
plt.xlabel('X-axis')
plt.ylabel('Y-axis')
plt.title('Scatter Plot with Error Bars and Different Markers')
plt.legend()
plt.grid(True)
plt.show()
Output:
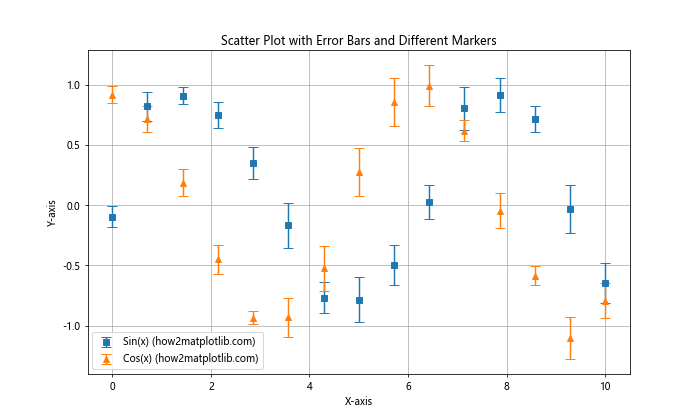
In this example, we use square (‘s’) and triangle (‘^’) markers for two different datasets.
Error Bars with Color Mapping
You can use color mapping to represent an additional dimension of data when you use error bars in a Matplotlib scatter plot:
import matplotlib.pyplot as plt
import numpy as np

x = np.linspace(0, 10, 30)
y = np.sin(x) + np.random.normal(0, 0.1, 30)
yerr = np.random.uniform(0.05, 0.2, 30)
colors = np.random.rand(30)

plt.figure(figsize=(10, 6))
scatter = plt.scatter(x, y, c=colors, cmap='viridis', label='Data (how2matplotlib.com)')
plt.colorbar(scatter, label='Color Value')
plt.errorbar(x, y, yerr=yerr, fmt='none', ecolor='gray', alpha=0.5)
plt.xlabel('X-axis')
plt.ylabel('Y-axis')
plt.title('Scatter Plot with Error Bars and Color Mapping')
plt.legend()
plt.grid(True)
plt.show()
Output:
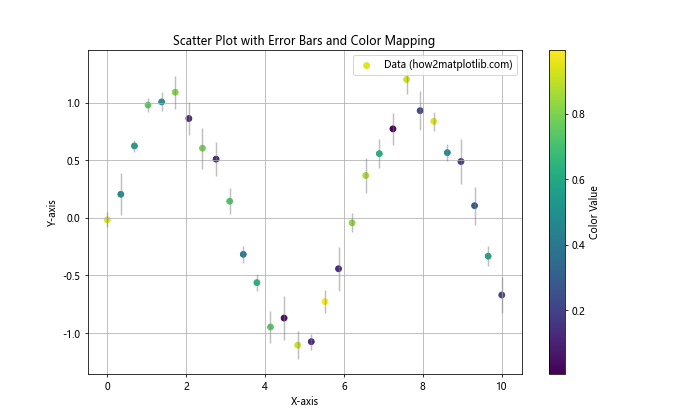
This example uses color mapping to represent an additional dimension of data, while still including error bars.
Error Bars with Varying Sizes
You can vary the size of the markers in your scatter plot to represent another dimension of data:
import matplotlib.pyplot as plt
import numpy as np

x = np.linspace(0, 10, 20)
y = np.exp(-x/5) + np.random.normal(0, 0.05, 20)
yerr = np.random.uniform(0.05, 0.2, 20)
sizes = np.random.randint(20, 200, 20)

plt.figure(figsize=(10, 6))
plt.scatter(x, y, s=sizes, alpha=0.5, label='Data (how2matplotlib.com)')
plt.errorbar(x, y, yerr=yerr, fmt='none', ecolor='gray')
plt.xlabel('X-axis')
plt.ylabel('Y-axis')
plt.title('Scatter Plot with Error Bars and Varying Marker Sizes')
plt.legend()
plt.grid(True)
plt.show()
Output:
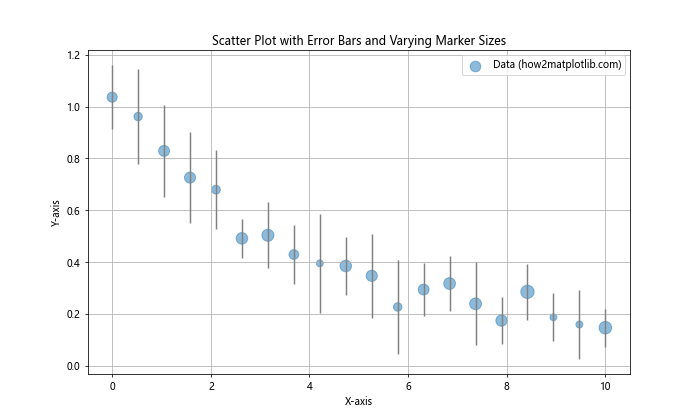
In this example, we use the scatter() function to create markers with varying sizes and add error bars separately using errorbar().
Error Bars in 3D Scatter Plots
You can also use error bars in 3D scatter plots, although it’s a bit more complex:
import matplotlib.pyplot as plt
import numpy as np
from mpl_toolkits.mplot3d import Axes3D

fig = plt.figure(figsize=(10, 8))
ax = fig.add_subplot(111, projection='3d')

x = np.random.rand(20)
y = np.random.rand(20)
z = np.random.rand(20)
xerr = np.random.uniform(0.05, 0.1, 20)
yerr = npp.random.uniform(0.05, 0.1, 20)
zerr = np.random.uniform(0.05, 0.1, 20)

ax.scatter(x, y, z, label='Data Points (how2matplotlib.com)')

for i in range(len(x)):
    ax.plot([x[i], x[i]], [y[i], y[i]], [z[i]-zerr[i], z[i]+zerr[i]], color='red', alpha=0.5)
    ax.plot([x[i], x[i]], [y[i]-yerr[i], y[i]+yerr[i]], [z[i], z[i]], color='green', alpha=0.5)
    ax.plot([x[i]-xerr[i], x[i]+xerr[i]], [y[i], y[i]], [z[i], z[i]], color='blue', alpha=0.5)

ax.set_xlabel('X-axis')
ax.set_ylabel('Y-axis')
ax.set_zlabel('Z-axis')
ax.set_title('3D Scatter Plot with Error Bars')
ax.legend()
plt.show()
This example creates a 3D scatter plot with error bars in all three dimensions. The error bars are drawn manually using plot() for each axis.
Handling Large Datasets with Error Bars
When you use error bars in a Matplotlib scatter plot with large datasets, you may encounter performance issues or visual clutter. Here are some strategies to handle large datasets:
Using Alpha Transparency
import matplotlib.pyplot as plt
import numpy as np

x = np.random.rand(1000)
y = np.random.rand(1000)
yerr = np.random.uniform(0.02, 0.1, 1000)

plt.figure(figsize=(10, 6))
plt.errorbar(x, y, yerr=yerr, fmt='o', capsize=2, alpha=0.1, label='Data (how2matplotlib.com)')
plt.xlabel('X-axis')
plt.ylabel('Y-axis')
plt.title('Scatter Plot with Error Bars for Large Dataset')
plt.legend()
plt.grid(True)
plt.show()
Output:
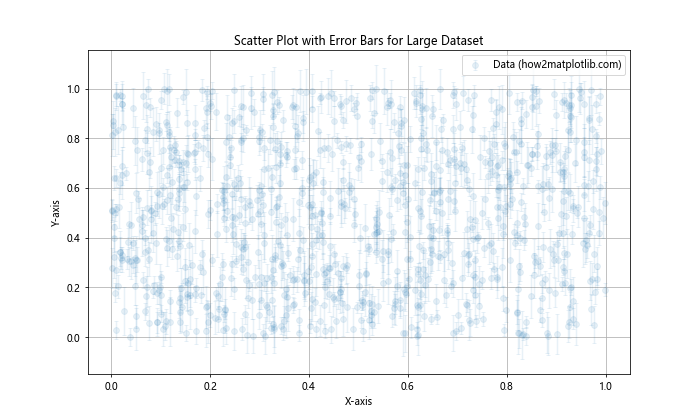
In this example, we use a low alpha value to make the points and error bars semi-transparent, reducing visual clutter.
Sampling the Dataset
import matplotlib.pyplot as plt
import numpy as np

x = np.random.rand(10000)
y = np.random.rand(10000)
yerr = np.random.uniform(0.02, 0.1, 10000)

# Sample 1000 points randomly
sample_indices = np.random.choice(10000, 1000, replace=False)

plt.figure(figsize=(10, 6))
plt.errorbar(x[sample_indices], y[sample_indices], yerr=yerr[sample_indices], fmt='o', capsize=2, label='Sampled Data (how2matplotlib.com)')
plt.xlabel('X-axis')
plt.ylabel('Y-axis')
plt.title('Scatter Plot with Error Bars for Sampled Large Dataset')
plt.legend()
plt.grid(True)
plt.show()
Output:
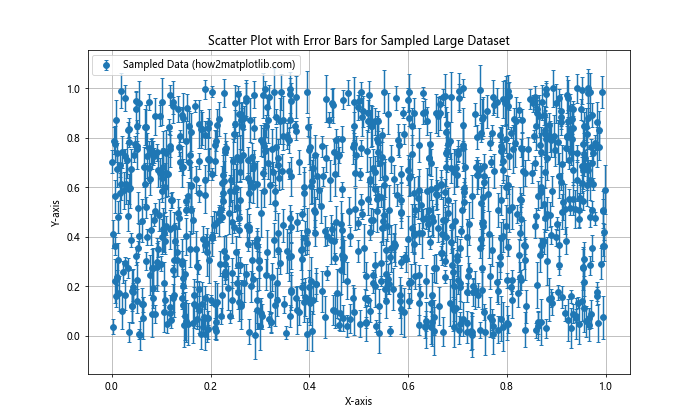
This example demonstrates how to sample a large dataset to create a more manageable scatter plot with error bars.
Combining Error Bars with Confidence Intervals
When you use error bars in a Matplotlib scatter plot, you can also combine them with confidence intervals for a more comprehensive representation of uncertainty:
import matplotlib.pyplot as plt
import numpy as np
from scipy import stats

x = np.linspace(0, 10, 20)
y = 2 * x + 1 + np.random.normal(0, 2, 20)
yerr = np.random.uniform(0.5, 1.5, 20)

# Calculate confidence interval
slope, intercept, r_value, p_value, std_err = stats.linregress(x, y)
y_pred = slope * x + intercept
ci = 1.96 * std_err * np.sqrt(1/len(x) + (x - np.mean(x))**2 / np.sum((x - np.mean(x))**2))

plt.figure(figsize=(10, 6))
plt.errorbar(x, y, yerr=yerr, fmt='o', capsize=5, label='Data (how2matplotlib.com)')
plt.plot(x, y_pred, 'r-', label='Linear Regression')
plt.fill_between(x, y_pred - ci, y_pred + ci, color='gray', alpha=0.2, label='95% Confidence Interval')
plt.xlabel('X-axis')
plt.ylabel('Y-axis')
plt.title('Scatter Plot with Error Bars and Confidence Interval')
plt.legend()
plt.grid(True)
plt.show()
Output:
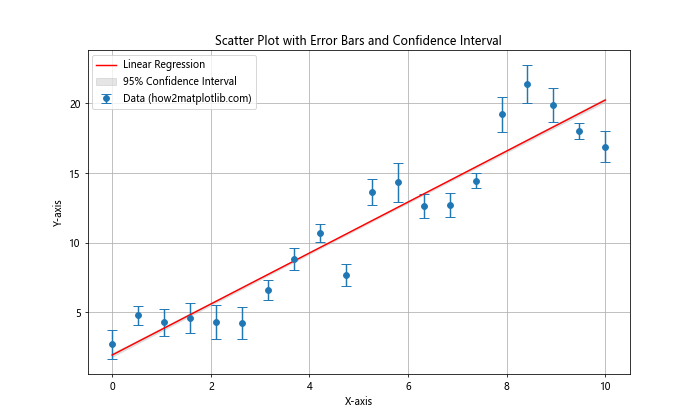
This example shows how to combine error bars with a linear regression line and its associated confidence interval.
Error Bars in Polar Plots
You can also use error bars in polar plots, which can be useful for certain types of data:
import matplotlib.pyplot as plt
import numpy as np

theta = np.linspace(0, 2*np.pi, 12, endpoint=False)
r = np.random.uniform(0.5, 1, 12)
r_err = np.random.uniform(0.05, 0.1, 12)

fig = plt.figure(figsize=(10, 8))
ax = fig.add_subplot(111, projection='polar')
ax.errorbar(theta, r, yerr=r_err, fmt='o', capsize=5, label='Data (how2matplotlib.com)')
ax.set_title('Polar Plot with Error Bars')
ax.legend()
plt.show()
Output:
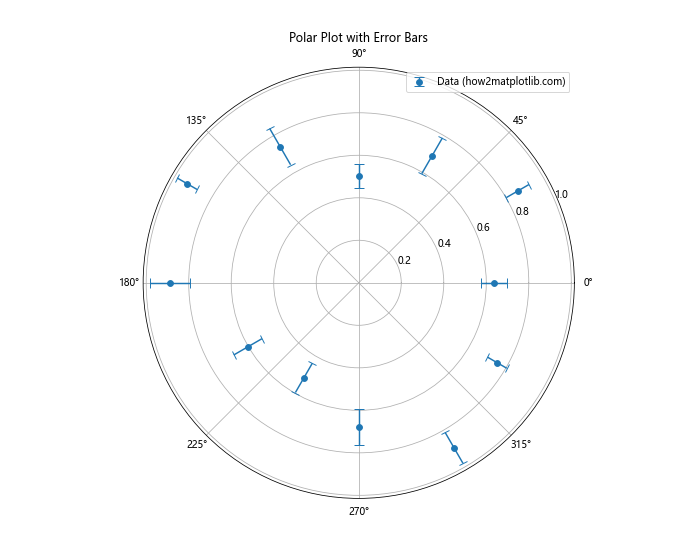
This example demonstrates how to create a polar plot with error bars, which can be useful for circular or periodic data.
Conclusion
In this comprehensive guide, we’ve explored various techniques and best practices for using error bars in Matplotlib scatter plots. We’ve covered basic implementation, customization options, handling different types of data, and addressing challenges with large datasets. By incorporating error bars into your scatter plots, you can provide a more complete and accurate representation of your data, allowing for better interpretation and analysis.
Remember that when you use error bars in a Matplotlib scatter plot, you’re adding an important layer of information to your visualization. Error bars help communicate the uncertainty or variability in your data, which is crucial for scientific and statistical analyses.