How to Set Different Error Bar Colors in Bar Plots Using Matplotlib
Setting different error bar colors in bar plots in Matplotlib is an essential skill for data visualization enthusiasts. This article will delve deep into the intricacies of customizing error bar colors in Matplotlib bar plots, providing you with a thorough understanding of the topic. We’ll explore various techniques, offer practical examples, and discuss best practices to help you master the art of setting different error bar colors in your Matplotlib bar plots.
Understanding the Basics of Error Bars in Matplotlib
Before we dive into setting different error bar colors, let’s first understand what error bars are and why they’re important in data visualization. Error bars in Matplotlib are used to indicate the uncertainty or variability in data points on a graph. They typically extend from the main data point and represent a range of possible values.
In Matplotlib, error bars can be added to various types of plots, including bar plots. They’re particularly useful when you want to show the precision of your measurements or the confidence intervals of your data.
Here’s a simple example of how to create a bar plot with error bars using Matplotlib:
import matplotlib.pyplot as plt
import numpy as np

# Data for the bar plot
categories = ['A', 'B', 'C', 'D']
values = [3, 7, 2, 5]
errors = [0.5, 1, 0.2, 0.8]

# Create the bar plot with error bars
plt.figure(figsize=(8, 6))
plt.bar(categories, values, yerr=errors, capsize=5)
plt.title('Bar Plot with Error Bars - how2matplotlib.com')
plt.xlabel('Categories')
plt.ylabel('Values')
plt.show()
Output:
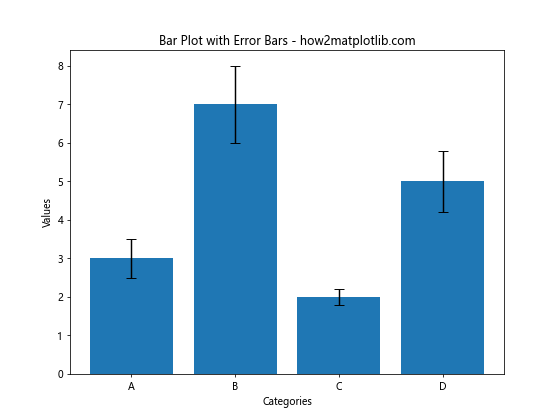
In this example, we create a simple bar plot with error bars. The yerr parameter is used to specify the error values for each bar. The capsize parameter determines the width of the error bar caps.
The Importance of Color in Error Bars
Color plays a crucial role in data visualization. When it comes to error bars, using different colors can help distinguish between various data points or categories, making your plot more informative and visually appealing. Setting different error bar colors in Matplotlib allows you to:
- Highlight specific data points or categories
- Group related data visually
- Improve the overall aesthetics of your plot
- Enhance the readability and interpretability of your data
Now that we understand the importance of color in error bars, let’s explore how to set different error bar colors in Matplotlib bar plots.
Setting a Single Color for All Error Bars
Before we dive into setting different colors for individual error bars, let’s start with setting a single color for all error bars in a bar plot. This can be achieved using the ecolor parameter in the plt.bar() function.
Here’s an example:
import matplotlib.pyplot as plt
import numpy as np

# Data for the bar plot
categories = ['A', 'B', 'C', 'D']
values = [3, 7, 2, 5]
errors = [0.5, 1, 0.2, 0.8]

# Create the bar plot with error bars
plt.figure(figsize=(8, 6))
plt.bar(categories, values, yerr=errors, capsize=5, ecolor='red')
plt.title('Bar Plot with Red Error Bars - how2matplotlib.com')
plt.xlabel('Categories')
plt.ylabel('Values')
plt.show()
Output:
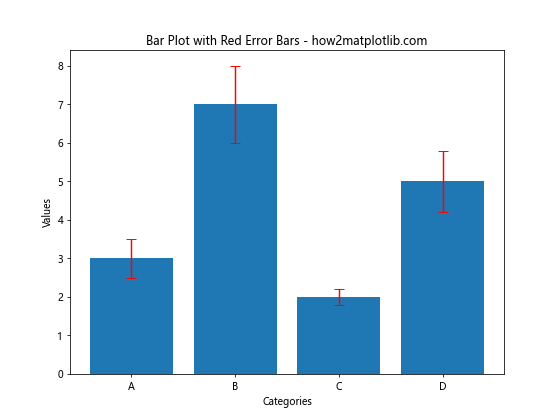
In this example, we set the ecolor parameter to ‘red’, which changes all error bars to red. This is a simple way to make your error bars stand out from the default color scheme.
Setting Different Colors for Individual Error Bars
Now, let’s move on to the main focus of this article: setting different colors for individual error bars in a Matplotlib bar plot. This can be achieved using a combination of the plt.bar() function and the plt.errorbar() function.
Here’s an example of how to set different colors for individual error bars:
import matplotlib.pyplot as plt
import numpy as np

# Data for the bar plot
categories = ['A', 'B', 'C', 'D']
values = [3, 7, 2, 5]
errors = [0.5, 1, 0.2, 0.8]
colors = ['red', 'green', 'blue', 'orange']

# Create the bar plot
plt.figure(figsize=(8, 6))
bars = plt.bar(categories, values, capsize=5)

# Add error bars with different colors
for i, (bar, error, color) in enumerate(zip(bars, errors, colors)):
    plt.errorbar(bar.get_x() + bar.get_width() / 2, values[i], yerr=error,
                 color=color, capsize=5, capthick=2)

plt.title('Bar Plot with Different Error Bar Colors - how2matplotlib.com')
plt.xlabel('Categories')
plt.ylabel('Values')
plt.show()
Output:
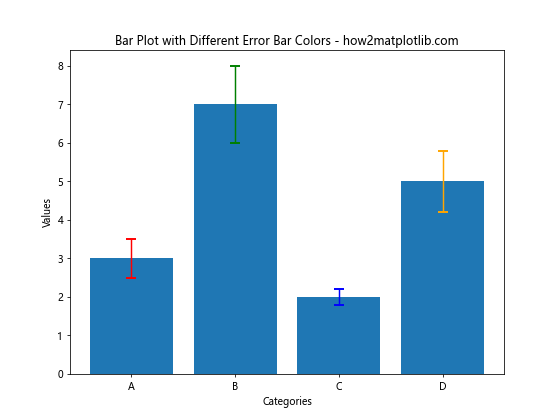
In this example, we first create the bar plot using plt.bar(). Then, we use a loop to add error bars with different colors using plt.errorbar(). The zip() function is used to iterate over the bars, errors, and colors simultaneously.
Customizing Error Bar Styles
In addition to colors, you can also customize other aspects of error bars to make them more visually appealing or informative. Let’s explore some of these customization options:
Changing Error Bar Line Width
You can adjust the thickness of error bars using the elinewidth parameter:
import matplotlib.pyplot as plt
import numpy as np

# Data for the bar plot
categories = ['A', 'B', 'C', 'D']
values = [3, 7, 2, 5]
errors = [0.5, 1, 0.2, 0.8]
colors = ['red', 'green', 'blue', 'orange']

# Create the bar plot
plt.figure(figsize=(8, 6))
bars = plt.bar(categories, values, capsize=5)

# Add error bars with different colors and line widths
for i, (bar, error, color) in enumerate(zip(bars, errors, colors)):
    plt.errorbar(bar.get_x() + bar.get_width() / 2, values[i], yerr=error,
                 color=color, capsize=5, capthick=2, elinewidth=i+1)

plt.title('Bar Plot with Custom Error Bar Line Widths - how2matplotlib.com')
plt.xlabel('Categories')
plt.ylabel('Values')
plt.show()
Output:
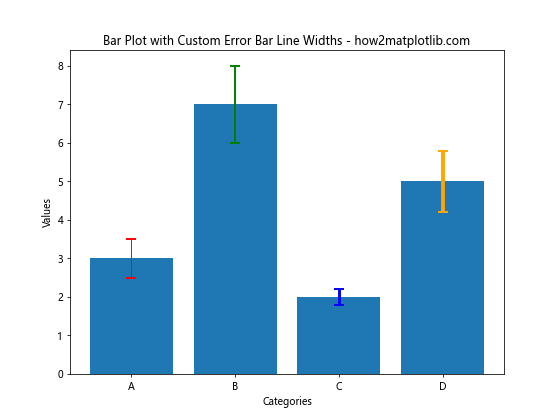
In this example, we use the elinewidth parameter to set different line widths for each error bar.
Adding Error Bar Caps
Error bar caps are the horizontal lines at the ends of error bars. You can customize their appearance using the capsize and capthick parameters:
import matplotlib.pyplot as plt
import numpy as np

# Data for the bar plot
categories = ['A', 'B', 'C', 'D']
values = [3, 7, 2, 5]
errors = [0.5, 1, 0.2, 0.8]
colors = ['red', 'green', 'blue', 'orange']

# Create the bar plot
plt.figure(figsize=(8, 6))
bars = plt.bar(categories, values)

# Add error bars with different colors and cap styles
for i, (bar, error, color) in enumerate(zip(bars, errors, colors)):
    plt.errorbar(bar.get_x() + bar.get_width() / 2, values[i], yerr=error,
                 color=color, capsize=(i+1)*5, capthick=(i+1))

plt.title('Bar Plot with Custom Error Bar Caps - how2matplotlib.com')
plt.xlabel('Categories')
plt.ylabel('Values')
plt.show()
Output:
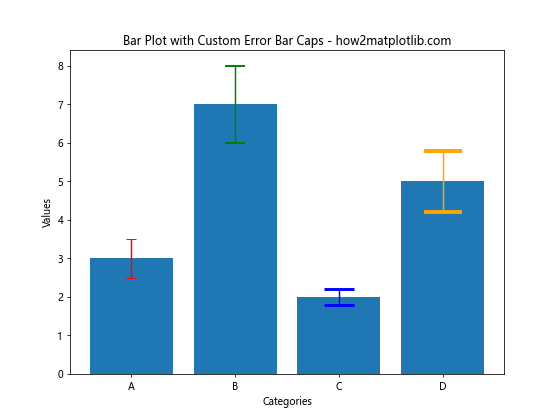
In this example, we vary the capsize and capthick parameters for each error bar to create different cap styles.
Handling Asymmetric Error Bars
So far, we’ve dealt with symmetric error bars, where the upper and lower error values are the same. However, in some cases, you might need to represent asymmetric errors. Matplotlib allows you to do this by specifying separate upper and lower error values.
Here’s an example of how to create a bar plot with asymmetric error bars and different colors:
import matplotlib.pyplot as plt
import numpy as np

# Data for the bar plot
categories = ['A', 'B', 'C', 'D']
values = [3, 7, 2, 5]
errors_lower = [0.3, 0.8, 0.1, 0.5]
errors_upper = [0.7, 1.2, 0.3, 1.0]
colors = ['red', 'green', 'blue', 'orange']

# Create the bar plot
plt.figure(figsize=(8, 6))
bars = plt.bar(categories, values)

# Add asymmetric error bars with different colors
for i, (bar, error_lower, error_upper, color) in enumerate(zip(bars, errors_lower, errors_upper, colors)):
    plt.errorbar(bar.get_x() + bar.get_width() / 2, values[i],
                 yerr=[[error_lower], [error_upper]], color=color,
                 capsize=5, capthick=2)

plt.title('Bar Plot with Asymmetric Error Bars - how2matplotlib.com')
plt.xlabel('Categories')
plt.ylabel('Values')
plt.show()
Output:
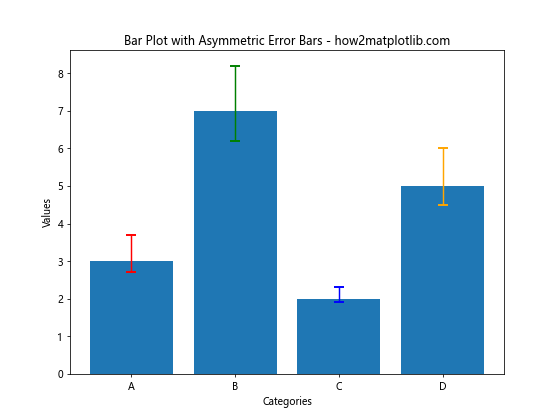
In this example, we specify separate lists for lower and upper error values. The yerr parameter takes a 2D array-like object where the first row represents the lower errors and the second row represents the upper errors.
Creating Grouped Bar Plots with Different Error Bar Colors
When working with more complex datasets, you might need to create grouped bar plots. Setting different error bar colors in grouped bar plots can help distinguish between different categories or groups. Here’s an example of how to achieve this:
import matplotlib.pyplot as plt
import numpy as np

# Data for the grouped bar plot
categories = ['A', 'B', 'C', 'D']
group1_values = [3, 7, 2, 5]
group2_values = [4, 6, 3, 7]
group1_errors = [0.5, 1, 0.2, 0.8]
group2_errors = [0.6, 0.9, 0.3, 1.1]

# Set up the bar positions
x = np.arange(len(categories))
width = 0.35

# Create the grouped bar plot
fig, ax = plt.subplots(figsize=(10, 6))
bars1 = ax.bar(x - width/2, group1_values, width, label='Group 1')
bars2 = ax.bar(x + width/2, group2_values, width, label='Group 2')

# Add error bars with different colors
ax.errorbar(x - width/2, group1_values, yerr=group1_errors, fmt='none', ecolor='red', capsize=5)
ax.errorbar(x + width/2, group2_values, yerr=group2_errors, fmt='none', ecolor='blue', capsize=5)

# Customize the plot
ax.set_xlabel('Categories')
ax.set_ylabel('Values')
ax.set_title('Grouped Bar Plot with Different Error Bar Colors - how2matplotlib.com')
ax.set_xticks(x)
ax.set_xticklabels(categories)
ax.legend()

plt.tight_layout()
plt.show()
Output:
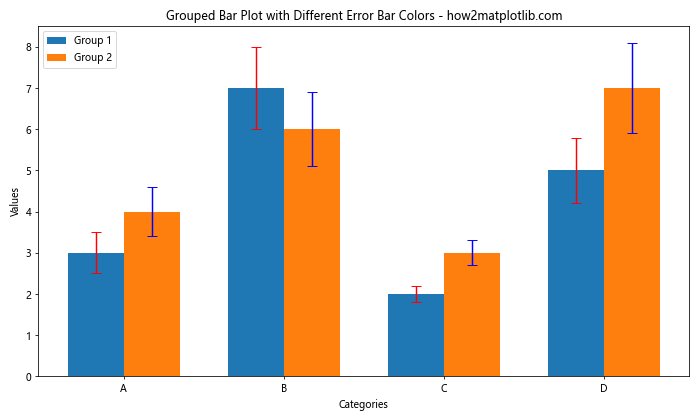
In this example, we create a grouped bar plot with two groups. We use different colors (red and blue) for the error bars of each group to make them easily distinguishable.
Combining Error Bar Colors with Bar Colors
Sometimes, you might want to match the color of the error bars with the color of the corresponding bars. This can create a cohesive and visually appealing plot. Here’s how you can achieve this:
import matplotlib.pyplot as plt
import numpy as np

# Data for the bar plot
categories = ['A', 'B', 'C', 'D']
values = [3, 7, 2, 5]
errors = [0.5, 1, 0.2, 0.8]
colors = ['#FF9999', '#66B2FF', '#99FF99', '#FFCC99']

# Create the bar plot
plt.figure(figsize=(8, 6))
bars = plt.bar(categories, values, color=colors, capsize=5)

# Add error bars with matching colors
for bar, error in zip(bars, errors):
    plt.errorbar(bar.get_x() + bar.get_width() / 2, bar.get_height(), yerr=error,
                 color=bar.get_facecolor(), capsize=5, capthick=2)

plt.title('Bar Plot with Matching Error Bar Colors - how2matplotlib.com')
plt.xlabel('Categories')
plt.ylabel('Values')
plt.show()
Output:
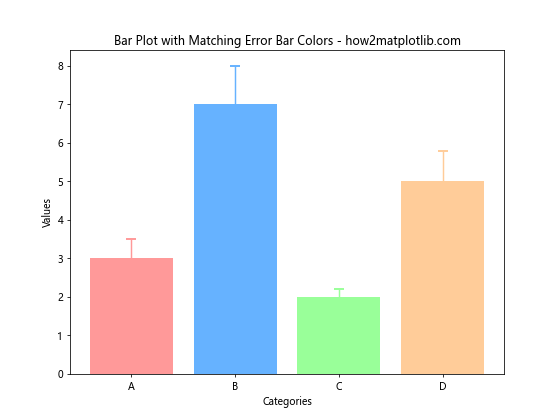
In this example, we set the color of each bar using the color parameter in plt.bar(). Then, when adding the error bars, we use bar.get_facecolor() to match the error bar color with the corresponding bar color.
Using Error Bar Colors to Represent Statistical Significance
Error bar colors can also be used to represent statistical significance or other important data characteristics. Here’s an example of how you might use different colors to indicate statistically significant differences:
import matplotlib.pyplot as plt
import numpy as np

# Data for the bar plot
categories = ['A', 'B', 'C', 'D', 'E']
values = [3, 7, 2, 5, 4]
errors = [0.5, 1, 0.2, 0.8, 0.6]
significant = [True, False, True, False, True]

# Create the bar plot
plt.figure(figsize=(10, 6))
bars = plt.bar(categories, values, capsize=5)

# Add error bars with colors based on significance
for bar, error, is_significant in zip(bars, errors, significant):
    color = 'red' if is_significant else 'gray'
    plt.errorbar(bar.get_x() + bar.get_width() / 2, bar.get_height(), yerr=error,
                 color=color, capsize=5, capthick=2)

plt.title('Bar Plot with Error Bar Colors Indicating Significance - how2matplotlib.com')
plt.xlabel('Categories')
plt.ylabel('Values')
plt.legend(['Significant', 'Not Significant'], loc='upper right')
plt.show()
Output:
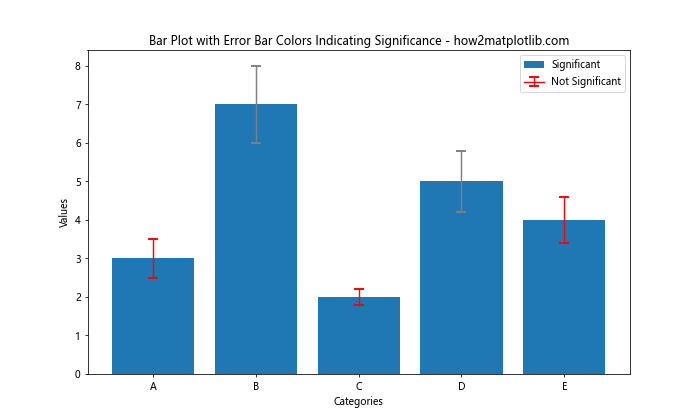
In this example, we use red error bars for statistically significant results and gray error bars for non-significant results. This visual cue can quickly draw attention to the most important findings in your data.
Best Practices for Setting Different Error Bar Colors
When setting different error bar colors in your Matplotlib bar plots, keep these best practices in mind:
- Color Consistency: If your error bar colors represent specific categories or groups, maintain consistency throughout your visualization and any related plots.
Color Contrast: Ensure that your error bar colors contrast well with both the bar colors and the background for optimal visibility.
Color Meaning: If you’re using colors to convey meaning (e.g., statistical significance), clearly explain the color coding in your legend or caption.
Color Accessibility: Consider color-blind friendly palettes when choosing your error bar colors, especially if your visualization will be widely distributed.
Avoid Overuse: While different colors can be informative, too many colors can be overwhelming. Use color judiciously to highlight the most important aspects of your data.
Match Aesthetic: Choose error bar colors that complement the overall aesthetic of your plot and any broader design scheme you’re working within.
Consider Data Type: The nature of your data should influence your color choices. For instance, sequential data might be better represented with a color gradient.
Balance with Other Elements: Ensure that your error bar colors don’t overshadow other important elements of your plot, such as the bars themselves or axis labels.
Troubleshooting Common Issues
When setting different error bar colors in Matplotlib, you might encounter some common issues. Here are a few problems you might face and how to solve them: