How to Radially Displace Pie Chart Wedges in Matplotlib
Radially displace pie chart wedge in Matplotlib is a powerful technique to enhance the visual appeal and readability of your pie charts. This article will explore various methods and techniques to radially displace pie chart wedges using Matplotlib, a popular data visualization library in Python. We’ll cover everything from basic concepts to advanced customization options, providing you with the knowledge and tools to create stunning pie charts with radially displaced wedges.
Understanding Radial Displacement in Pie Charts
Radially displace pie chart wedge in Matplotlib refers to the process of moving individual wedges of a pie chart outward from the center. This technique is particularly useful when you want to emphasize specific segments of your pie chart or create a more visually appealing representation of your data.
Let’s start with a basic example of how to radially displace pie chart wedge in Matplotlib:
import matplotlib.pyplot as plt

# Data for the pie chart
sizes = [30, 20, 25, 15, 10]
labels = ['A', 'B', 'C', 'D', 'E']

# Create a list to store the explode values
explode = [0.1, 0, 0, 0, 0]  # Explode the first wedge

# Create the pie chart with radial displacement
plt.pie(sizes, labels=labels, explode=explode, autopct='%1.1f%%', startangle=90)

# Add a title
plt.title('Radially Displaced Pie Chart - how2matplotlib.com')

# Show the plot
plt.show()
Output:
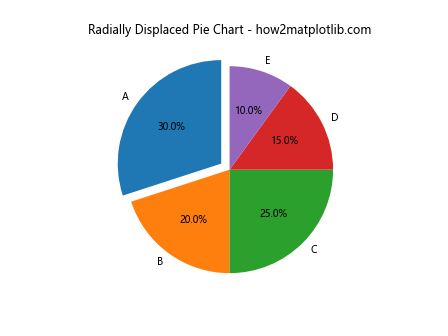
In this example, we use the explode parameter to radially displace pie chart wedge in Matplotlib. The explode list corresponds to the sizes list, and each value represents the fraction of the radius to offset that wedge. Here, we’re displacing the first wedge by 10% of the radius.
Benefits of Radially Displacing Pie Chart Wedges
Radially displace pie chart wedge in Matplotlib offers several advantages:
- Emphasis: It draws attention to specific segments of the pie chart.
- Clarity: It can help separate closely sized wedges for better visibility.
- Aesthetics: It adds visual interest to otherwise plain pie charts.
- Data storytelling: It can be used to highlight important data points or trends.
Advanced Techniques for Radial Displacement
Now that we understand the basics, let’s explore more advanced techniques to radially displace pie chart wedge in Matplotlib.
Multiple Wedge Displacement
You can radially displace multiple wedges simultaneously:
import matplotlib.pyplot as plt

sizes = [25, 20, 30, 15, 10]
labels = ['A', 'B', 'C', 'D', 'E']
explode = [0.1, 0.05, 0.15, 0, 0]  # Displace multiple wedges

plt.pie(sizes, labels=labels, explode=explode, autopct='%1.1f%%', startangle=90)
plt.title('Multiple Wedge Displacement - how2matplotlib.com')
plt.show()
Output:
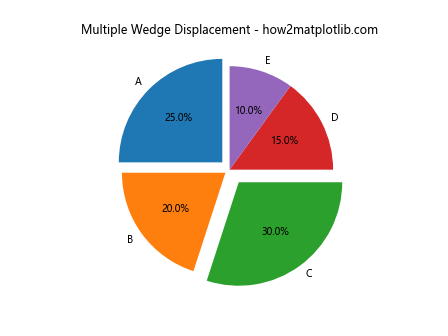
This example demonstrates how to radially displace pie chart wedge in Matplotlib for multiple segments. We’ve displaced the first three wedges by different amounts.
Customizing Wedge Properties
When you radially displace pie chart wedge in Matplotlib, you can also customize other properties of the wedges:
import matplotlib.pyplot as plt

sizes = [30, 25, 20, 15, 10]
labels = ['A', 'B', 'C', 'D', 'E']
colors = ['#ff9999', '#66b3ff', '#99ff99', '#ffcc99', '#ff99cc']
explode = [0.1, 0, 0, 0, 0]

plt.pie(sizes, labels=labels, colors=colors, explode=explode, autopct='%1.1f%%',
        shadow=True, startangle=90, wedgeprops={'edgecolor': 'black'})
plt.title('Customized Radially Displaced Pie Chart - how2matplotlib.com')
plt.show()
Output:
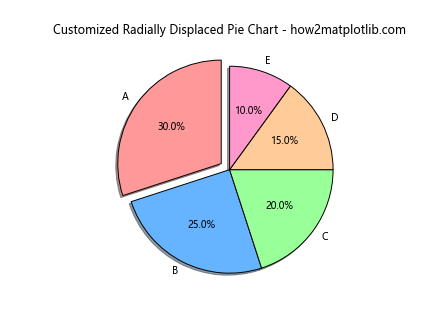
In this example, we’ve added custom colors, a shadow effect, and black edges to the wedges while radially displacing the first wedge.
Dynamic Wedge Displacement
You can also radially displace pie chart wedge in Matplotlib based on data values:
import matplotlib.pyplot as plt

sizes = [35, 25, 20, 15, 5]
labels = ['A', 'B', 'C', 'D', 'E']

# Calculate explode values based on sizes
max_size = max(sizes)
explode = [0.05 * (size / max_size) for size in sizes]

plt.pie(sizes, labels=labels, explode=explode, autopct='%1.1f%%', startangle=90)
plt.title('Dynamic Wedge Displacement - how2matplotlib.com')
plt.show()
Output:
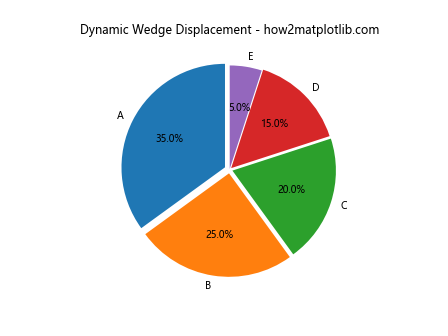
This script demonstrates how to radially displace pie chart wedge in Matplotlib dynamically based on the size of each wedge. Larger wedges are displaced more than smaller ones.
Combining Radial Displacement with Other Pie Chart Features
Radially displace pie chart wedge in Matplotlib can be combined with other pie chart features to create even more informative visualizations.
Adding a Legend
Here’s how to radially displace pie chart wedge in Matplotlib while also adding a legend:
import matplotlib.pyplot as plt

sizes = [30, 25, 20, 15, 10]
labels = ['A', 'B', 'C', 'D', 'E']
colors = ['#ff9999', '#66b3ff', '#99ff99', '#ffcc99', '#ff99cc']
explode = [0.1, 0, 0, 0, 0]

plt.pie(sizes, explode=explode, colors=colors, autopct='%1.1f%%', startangle=90)
plt.title('Radially Displaced Pie Chart with Legend - how2matplotlib.com')
plt.legend(labels, title="Categories", loc="center left", bbox_to_anchor=(1, 0, 0.5, 1))
plt.axis('equal')
plt.tight_layout()
plt.show()
Output:
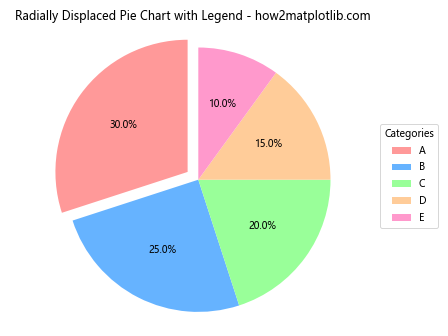
This example shows how to radially displace pie chart wedge in Matplotlib and add a legend to the side of the chart for better labeling.
Nested Pie Charts
You can create nested pie charts with radial displacement:
import matplotlib.pyplot as plt

# Outer pie chart data
sizes_outer = [40, 30, 30]
labels_outer = ['Group A', 'Group B', 'Group C']
colors_outer = ['#ff9999', '#66b3ff', '#99ff99']
explode_outer = [0.1, 0, 0]

# Inner pie chart data
sizes_inner = [15, 25, 35, 25]
labels_inner = ['A1', 'A2', 'B1', 'C1']
colors_inner = ['#ff9999', '#ffcc99', '#66b3ff', '#99ff99']

# Create the figure and axis
fig, ax = plt.subplots()

# Outer pie chart
ax.pie(sizes_outer, explode=explode_outer, labels=labels_outer, colors=colors_outer,
       autopct='%1.1f%%', startangle=90, radius=1.2, wedgeprops=dict(width=0.3, edgecolor='white'))

# Inner pie chart
ax.pie(sizes_inner, labels=labels_inner, colors=colors_inner,
       autopct='%1.1f%%', startangle=90, radius=0.9, wedgeprops=dict(width=0.4, edgecolor='white'))

ax.set_title('Nested Pie Chart with Radial Displacement - how2matplotlib.com')
plt.show()
Output:
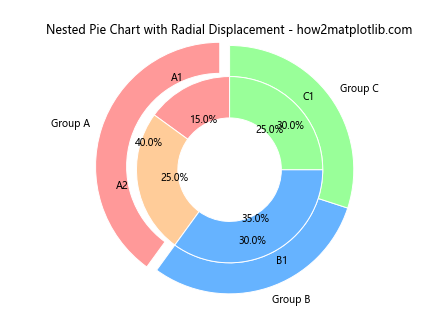
This complex example demonstrates how to radially displace pie chart wedge in Matplotlib for the outer ring of a nested pie chart, creating a visually striking representation of hierarchical data.
Animating Radial Displacement
You can create animations to show the process of radially displacing pie chart wedges:
import matplotlib.pyplot as plt
import matplotlib.animation as animation

# Data for the pie chart
sizes = [30, 25, 20, 15, 10]
labels = ['A', 'B', 'C', 'D', 'E']
colors = ['#ff9999', '#66b3ff', '#99ff99', '#ffcc99', '#ff99cc']

# Create the figure and axis
fig, ax = plt.subplots()

def animate(frame):
    explode = [0, 0, 0, 0, 0]
    explode[frame % 5] = 0.1  # Displace one wedge at a time
    ax.clear()
    ax.pie(sizes, explode=explode, labels=labels, colors=colors, autopct='%1.1f%%', startangle=90)
    ax.set_title(f'Animated Radial Displacement - how2matplotlib.com (Frame {frame})')

# Create the animation
anim = animation.FuncAnimation(fig, animate, frames=20, interval=500, repeat=True)

plt.show()
Output:
This animation shows how to radially displace pie chart wedge in Matplotlib sequentially, creating a dynamic and engaging visualization.
Customizing Text and Labels
When you radially displace pie chart wedge in Matplotlib, you may need to adjust the position and formatting of labels and percentage text:
import matplotlib.pyplot as plt

sizes = [30, 25, 20, 15, 10]
labels = ['Category A', 'Category B', 'Category C', 'Category D', 'Category E']
explode = [0.1, 0, 0, 0, 0]

def make_autopct(values):
    def my_autopct(pct):
        total = sum(values)
        val = int(round(pct*total/100.0))
        return f'{pct:.1f}%\n({val:d})'
    return my_autopct

plt.pie(sizes, explode=explode, labels=labels, autopct=make_autopct(sizes),
        startangle=90, textprops={'fontsize': 8, 'fontweight': 'bold'})
plt.title('Customized Labels in Radially Displaced Pie Chart - how2matplotlib.com')
plt.show()
Output:
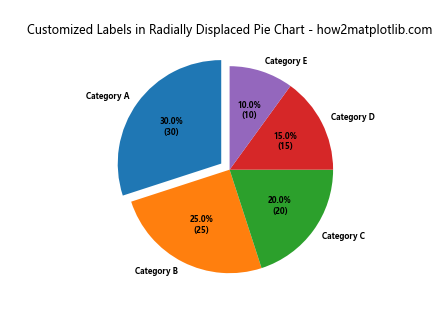
This example demonstrates how to radially displace pie chart wedge in Matplotlib while customizing the text displayed on each wedge to show both percentage and absolute values.
Handling Large Numbers of Categories
When dealing with many categories, radial displacement can help separate wedges:
import matplotlib.pyplot as plt
import numpy as np

# Generate random data
np.random.seed(42)
sizes = np.random.randint(1, 100, 15)
labels = [f'Category {i}' for i in range(1, 16)]

# Calculate explode values
total = sum(sizes)
explode = [0.05 * (size / total) for size in sizes]

# Create the pie chart
plt.figure(figsize=(10, 10))
plt.pie(sizes, labels=labels, explode=explode, autopct='%1.1f%%',
        startangle=90, labeldistance=1.05, pctdistance=0.8)
plt.title('Radially Displaced Pie Chart with Many Categories - how2matplotlib.com')
plt.show()
Output:
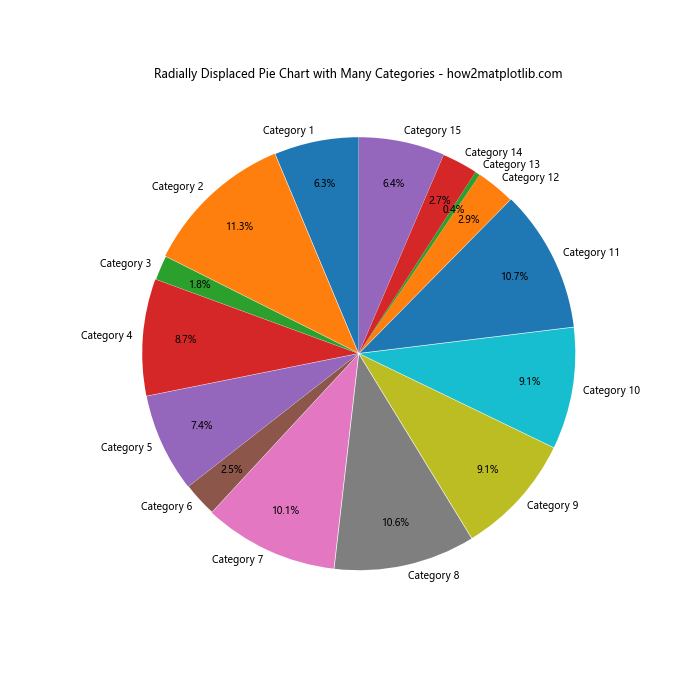
This example shows how to radially displace pie chart wedge in Matplotlib for a large number of categories, using the size of each wedge to determine the amount of displacement.
Combining with Other Chart Types
You can combine radially displaced pie charts with other chart types for more complex visualizations:
import matplotlib.pyplot as plt
import numpy as np

# Data for pie chart
sizes = [30, 25, 20, 15, 10]
labels = ['A', 'B', 'C', 'D', 'E']
explode = [0.1, 0, 0, 0, 0]

# Data for bar chart
categories = ['Category 1', 'Category 2', 'Category 3']
values = [4, 7, 3]

# Create subplots
fig, (ax1, ax2) = plt.subplots(1, 2, figsize=(12, 5))

# Pie chart
ax1.pie(sizes, explode=explode, labels=labels, autopct='%1.1f%%', startangle=90)
ax1.set_title('Radially Displaced Pie Chart - how2matplotlib.com')

# Bar chart
ax2.bar(categories, values)
ax2.set_title('Bar Chart - how2matplotlib.com')
ax2.set_ylabel('Values')

plt.tight_layout()
plt.show()
Output:
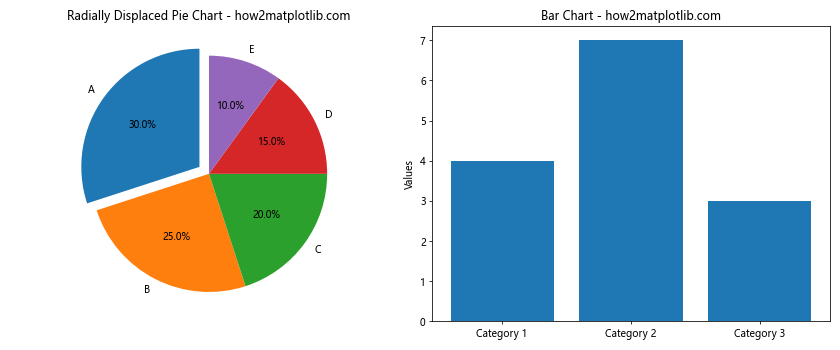
This example demonstrates how to radially displace pie chart wedge in Matplotlib alongside a bar chart, allowing for comparison between different data representations.
Using Radial Displacement for Data Comparison
Radial displacement can be used to compare multiple datasets:
import matplotlib.pyplot as plt

# Data for two datasets
sizes1 = [30, 25, 20, 15, 10]
sizes2 = [25, 30, 15, 20, 10]
labels = ['A', 'B', 'C', 'D', 'E']

# Create subplots
fig, (ax1, ax2) = plt.subplots(1, 2, figsize=(12, 5))

# First pie chart
explode1 = [0.1 if s == max(sizes1) else 0 for s in sizes1]
ax1.pie(sizes1, explode=explode1, labels=labels, autopct='%1.1f%%', startangle=90)
ax1.set_title('Dataset 1 - how2matplotlib.com')

# Second pie chart
explode2 = [0.1 if s == max(sizes2) else 0 for s in sizes2]
ax2.pie(sizes2, explode=explode2, labels=labels, autopct='%1.1f%%', startangle=90)
ax2.set_title('Dataset 2 - how2matplotlib.com')

plt.suptitle('Comparing Datasets with Radial Displacement', fontsize=16)
plt.tight_layout()
plt.show()
Output:
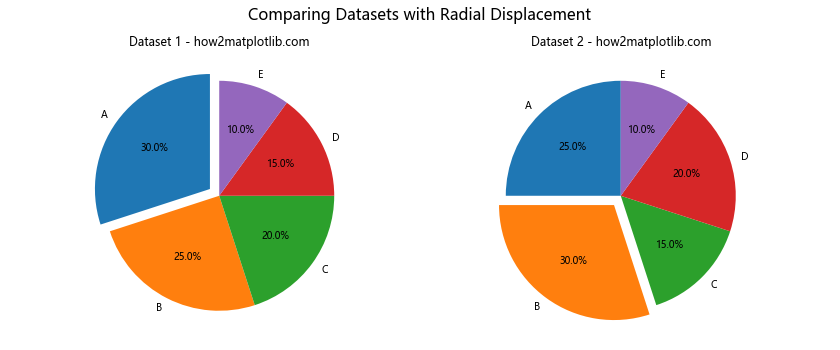
This example shows how to radially displace pie chart wedge in Matplotlib for two different datasets, highlighting the largest segment in each for easy comparison.
Advanced Styling Techniques
You can apply advanced styling techniques when you radially displace pie chart wedge in Matplotlib:
import matplotlib.pyplot as plt

sizes = [30, 25, 20, 15, 10]
labels = ['A', 'B', 'C', 'D', 'E']
colors = ['#ff9999', '#66b3ff', '#99ff99', '#ffcc99', '#ff99cc']
explode = [0.1, 0.05, 0, 0, 0]

# Create the pie chart with custom styling
plt.figure(figsize=(10, 8))
wedges, texts, autotexts = plt.pie(sizes, explode=explode, labels=labels, colors=colors,
                                   autopct='%1.1f%%', startangle=90, pctdistance=0.85,
                                   wedgeprops=dict(width=0.7, edgecolor='white', linewidth=2))

# Customize wedge appearance
for w in wedges:
    w.set_linewidth(2)
    w.set_edgecolor('black')

# Customize label and percentage text
for text in texts + autotexts:
    text.set_fontsize(12)
    text.set_fontweight('bold')

plt.title('Advanced Styled Radially Displaced Pie Chart - how2matplotlib.com', fontsize=16, fontweight='bold')
plt.show()
Output:
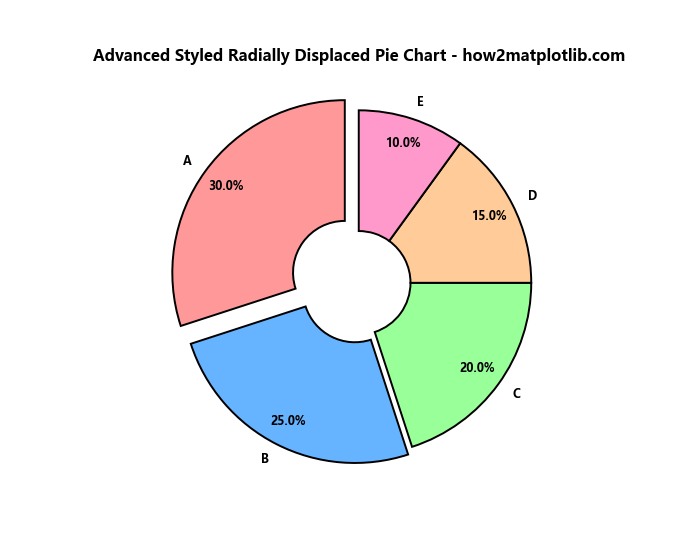
This example demonstrates advanced styling techniques when you radially displace pie chartwedge in Matplotlib, including custom colors, wedge widths, and text formatting.
Handling Special Cases
When you radially displace pie chart wedge in Matplotlib, you may encounter special cases that require additional handling:
Dealing with Very Small Wedges
Sometimes, you may have data with very small values that create tiny wedges:
import matplotlib.pyplot as plt

sizes = [50, 30, 15, 4, 1]
labels = ['A', 'B', 'C', 'D', 'E']
explode = [0.1, 0, 0, 0, 0]

def autopct_format(values):
    def my_format(pct):
        total = sum(values)
        val = int(round(pct*total/100.0))
        return f'{pct:.1f}%\n({val:d})' if pct > 1 else ''
    return my_format

plt.figure(figsize=(10, 8))
plt.pie(sizes, explode=explode, labels=labels, autopct=autopct_format(sizes),
        startangle=90, pctdistance=0.85, labeldistance=1.05)
plt.title('Handling Small Wedges in Radially Displaced Pie Chart - how2matplotlib.com')
plt.show()
Output:
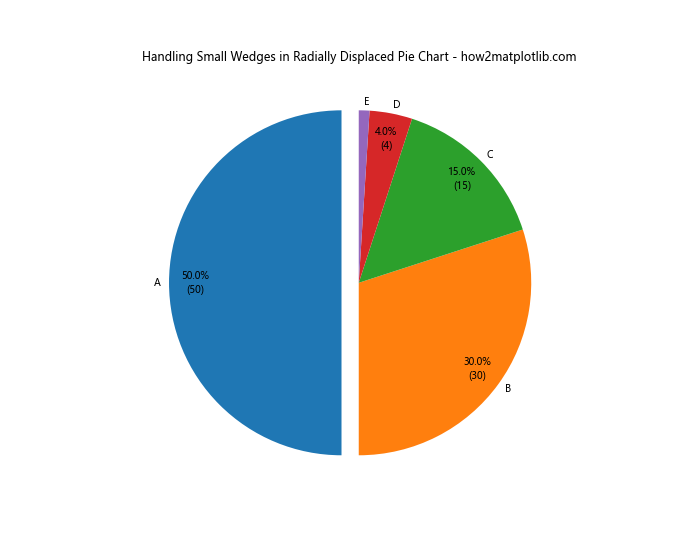
This example shows how to radially displace pie chart wedge in Matplotlib while handling very small wedges by only displaying labels and percentages for wedges above a certain threshold.
Handling Negative Values
While pie charts typically represent parts of a whole, you might encounter situations with negative values:
import matplotlib.pyplot as plt

sizes = [30, 25, -10, 15, 10]
labels = ['A', 'B', 'C', 'D', 'E']
colors = ['#ff9999', '#66b3ff', '#ff0000', '#ffcc99', '#ff99cc']
explode = [0.1, 0, 0.2, 0, 0]

plt.figure(figsize=(10, 8))
wedges, texts, autotexts = plt.pie(sizes, explode=explode, labels=labels, colors=colors,
                                   autopct=lambda pct: f'{pct:.1f}%' if pct > 0 else '',
                                   startangle=90, pctdistance=0.85)

# Highlight negative value
wedges[2].set_hatch('///')

plt.title('Handling Negative Values in Radially Displaced Pie Chart - how2matplotlib.com')
plt.show()
This example demonstrates how to radially displace pie chart wedge in Matplotlib when dealing with negative values, using a different color and hatching pattern to highlight the negative segment.
Interactive Radial Displacement
You can create interactive pie charts where users can dynamically adjust the radial displacement:
import matplotlib.pyplot as plt
from matplotlib.widgets import Slider

sizes = [30, 25, 20, 15, 10]
labels = ['A', 'B', 'C', 'D', 'E']
colors = ['#ff9999', '#66b3ff', '#99ff99', '#ffcc99', '#ff99cc']

fig, ax = plt.subplots(figsize=(10, 8))
plt.subplots_adjust(bottom=0.25)

wedges, texts, autotexts = ax.pie(sizes, labels=labels, colors=colors, autopct='%1.1f%%', startangle=90)

ax_slider = plt.axes([0.2, 0.1, 0.6, 0.03])
slider = Slider(ax_slider, 'Explode', 0, 0.3, valinit=0)

def update(val):
    explode = [val if i == 0 else 0 for i in range(len(sizes))]
    wedges, texts, autotexts = ax.pie(sizes, explode=explode, labels=labels, colors=colors, autopct='%1.1f%%', startangle=90)
    fig.canvas.draw_idle()

slider.on_changed(update)

plt.suptitle('Interactive Radially Displaced Pie Chart - how2matplotlib.com', fontsize=16)
plt.show()
Output:
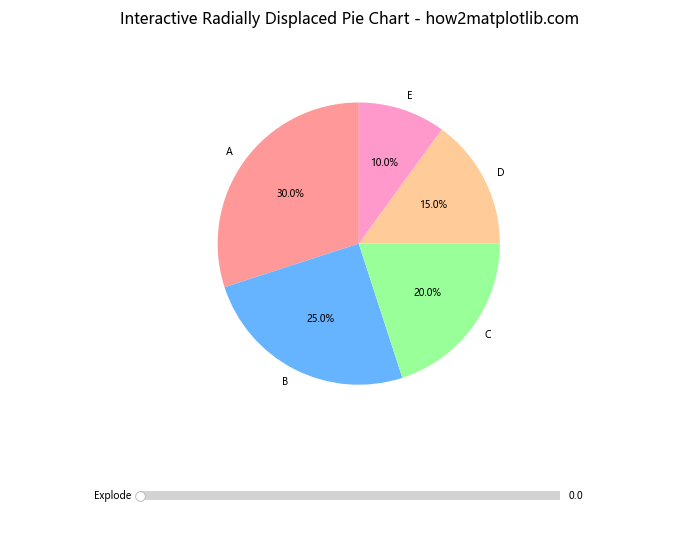
This interactive example allows users to adjust the radial displacement of the first wedge using a slider, demonstrating a dynamic way to radially displace pie chart wedge in Matplotlib.
Best Practices for Radial Displacement
When you radially displace pie chart wedge in Matplotlib, consider these best practices:
- Use sparingly: Radial displacement is most effective when used to highlight one or a few key segments.
- Maintain proportions: Ensure that the displacement doesn’t distort the perceived sizes of the wedges.
- Consider color: Use contrasting colors to further emphasize displaced wedges.
- Label carefully: Adjust label positions to avoid overlapping with displaced wedges.
- Explain the significance: Provide context for why certain wedges are displaced in your chart’s title or caption.
Troubleshooting Common Issues
When you radially displace pie chart wedge in Matplotlib, you might encounter some common issues:
Overlapping Labels
If labels overlap when you radially displace pie chart wedge in Matplotlib, try adjusting the labeldistance parameter:
import matplotlib.pyplot as plt

sizes = [30, 28, 25, 10, 7]
labels = ['Category A', 'Category B', 'Category C', 'Category D', 'Category E']
explode = [0.1, 0.05, 0, 0, 0]

plt.figure(figsize=(10, 8))
plt.pie(sizes, explode=explode, labels=labels, autopct='%1.1f%%',
        startangle=90, labeldistance=1.1, pctdistance=0.8)
plt.title('Adjusted Label Positions in Radially Displaced Pie Chart - how2matplotlib.com')
plt.show()
Output:
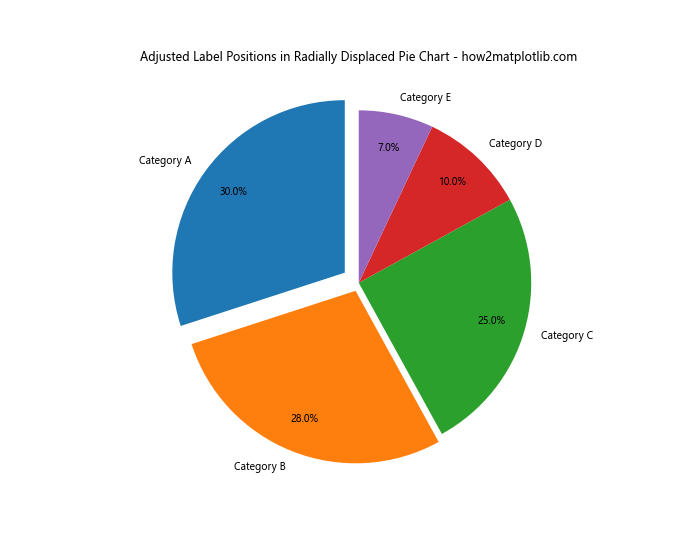
This example demonstrates how to adjust label positions when you radially displace pie chart wedge in Matplotlib to prevent overlapping.
Maintaining Aspect Ratio
To ensure your pie chart remains circular when you radially displace pie chart wedge in Matplotlib, use the axis('equal') command:
import matplotlib.pyplot as plt

sizes = [30, 25, 20, 15, 10]
labels = ['A', 'B', 'C', 'D', 'E']
explode = [0.1, 0, 0, 0, 0]

plt.figure(figsize=(10, 8))
plt.pie(sizes, explode=explode, labels=labels, autopct='%1.1f%%', startangle=90)
plt.axis('equal')  # Equal aspect ratio ensures that pie is drawn as a circle
plt.title('Maintaining Aspect Ratio in Radially Displaced Pie Chart - how2matplotlib.com')
plt.show()
Output:
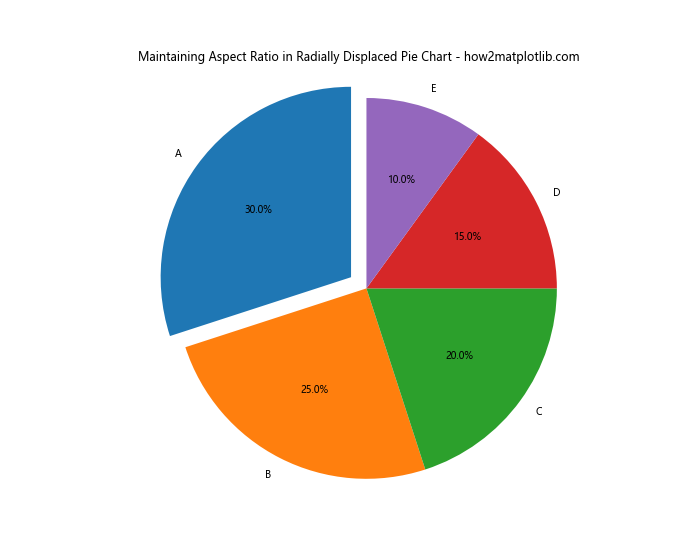
This example ensures that the pie chart remains circular when you radially displace pie chart wedge in Matplotlib.
Advanced Applications of Radial Displacement
Radial displacement can be used in more complex data visualizations:
Sunburst Charts
A sunburst chart is a multi-level pie chart that can benefit from radial displacement:
import matplotlib.pyplot as plt
import numpy as np

def sunburst(nodes, total=np.pi * 2, offset=0, level=0, ax=None):
    ax = ax or plt.subplot(111, projection='polar')

    if level == 0 and len(nodes) == 1:
        label, value, subnodes = nodes[0]
        ax.bar([0], [0.5], [np.pi * 2], color='w')
        ax.text(0, 0, label, ha='center', va='center')
        sunburst(subnodes, total=value, level=level + 1, ax=ax)
    elif nodes:
        d = np.pi * 2 / total
        labels = []
        widths = []
        local_offset = offset
        for label, value, subnodes in nodes:
            labels.append(label)
            widths.append(value * d)
            sunburst(subnodes, total=total, offset=local_offset, level=level + 1, ax=ax)
            local_offset += value * d

        values = [value for _, value, _ in nodes]
        colors = plt.cm.viridis(np.linspace(0, 1, len(nodes)))
        ax.bar(x=[offset + w / 2 for w in widths],
               width=widths,
               bottom=level,
               height=1,
               color=colors,
               edgecolor='w',
               linewidth=2,
               align="center")

    if level == 0:
        ax.set_ylim(0, level + 1)
        ax.set_title('Sunburst Chart with Radial Displacement - how2matplotlib.com')
        ax.axis('off')

data = [
    ('A', 100, [
        ('A1', 60, []),
        ('A2', 40, [])
    ]),
    ('B', 80, [
        ('B1', 30, []),
        ('B2', 50, [])
    ]),
    ('C', 60, [
        ('C1', 25, []),
        ('C2', 35, [])
    ])
]

plt.figure(figsize=(10, 10))
sunburst(data)
plt.show()
Output:
This advanced example shows how to create a sunburst chart, which is an extension of the concept to radially displace pie chart wedge in Matplotlib, allowing for hierarchical data representation.
Conclusion
Radially displacing pie chart wedges in Matplotlib is a powerful technique that can significantly enhance the visual appeal and readability of your data visualizations. Throughout this comprehensive guide, we’ve explored various methods to radially displace pie chart wedge in Matplotlib, from basic implementations to advanced customizations and interactive features.
We’ve covered topics such as:
- Basic radial displacement techniques
- Customizing wedge properties
- Handling special cases like small wedges and negative values
- Creating animated and interactive pie charts
- Combining radial displacement with other chart types
- Best practices and troubleshooting common issues