Matplotlib Label Font Size
Matplotlib is a popular data visualization library in Python that provides various functions to create high-quality plots, charts, and figures. When creating visualizations, it’s crucial to customize the fonts, including the font size of labels, to enhance readability and improve the overall appearance of the plot.
In this article, we will explore different ways to modify the font size of labels in Matplotlib. We will discuss how to change the font size globally and individually for different elements such as titles, axis labels, and legends. Additionally, we will provide code examples with execution results to illustrate the impact of changing the font size dynamically.
Changing the Font Size Globally in Matplotlib Label
To change the font size globally in Matplotlib, we can make use of the rcParams dictionary provided by the library. rcParams allows us to customize various aspects of the plot’s appearance, including the font size.
Here is an example that demonstrates how to change the font size globally:
import matplotlib.pyplot as plt

# Set the font size globally
plt.rcParams.update({'font.size': 12})

# Creating a simple line plot
x = [1, 2, 3, 4, 5]
y = [1, 4, 9, 16, 25]
plt.plot(x, y)

# Display the plot
plt.show()
Output:
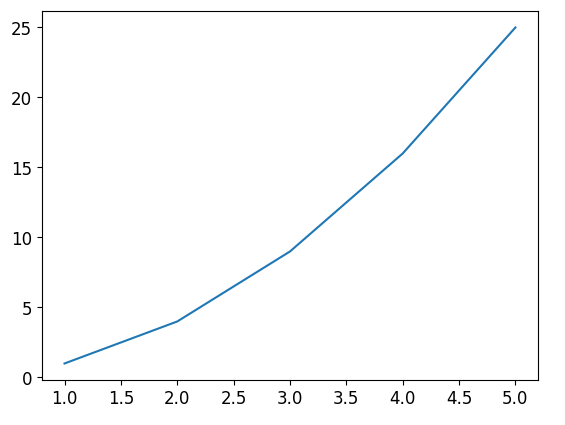
As you can see, the font size of the axis labels and the title of the plot has changed to 12.
Changing the Font Size of Titles in Matplotlib Label
Matplotlib provides a fontsize parameter that allows us to specify the font size of titles. We can use this parameter to modify the font size of the plot title, as shown in the example below:
import matplotlib.pyplot as plt

# Creating a simple line plot
x = [1, 2, 3, 4, 5]
y = [1, 4, 9, 16, 25]
plt.plot(x, y)

# Modifying the font size of the title
plt.title("Sample Plot", fontsize=16)

# Display the plot
plt.show()
Output:
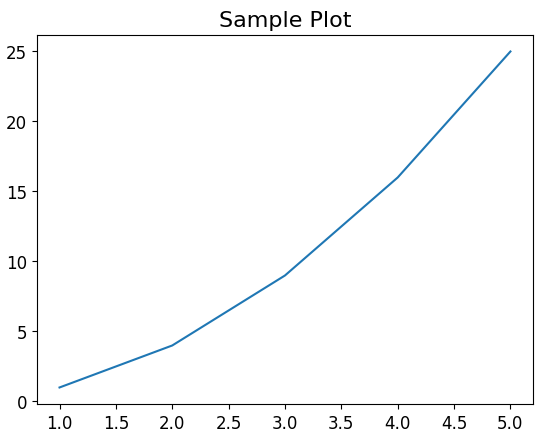
In this example, the font size of the title is set to 16.
Changing the Font Size of Axis Labels in Matplotlib Label
To change the font size of the axis labels, we can use the xlabel and ylabel functions provided by Matplotlib. These functions allow us to modify the font size individually for each axis label.
Here’s an example that demonstrates how to change the font size of the x-axis and y-axis labels:
import matplotlib.pyplot as plt

# Creating a simple line plot
x = [1, 2, 3, 4, 5]
y = [1, 4, 9, 16, 25]
plt.plot(x, y)

# Modifying the font size of the x-axis and y-axis labels
plt.xlabel("X Values", fontsize=12)
plt.ylabel("Y Values", fontsize=12)

# Display the plot
plt.show()
Output:
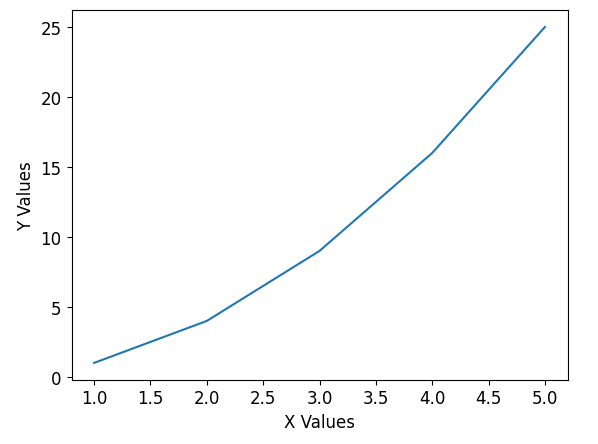
As you can see, the font size of both the x-axis and y-axis labels has been changed to 12.
Changing the Font Size of Legends in Matplotlib Label
Legends are essential when it comes to providing information about the elements present in a plot. Matplotlib allows us to customize the font size of legends using the fontsize parameter.
Consider the following code example:
import matplotlib.pyplot as plt

# Creating a simple line plot
x = [1, 2, 3, 4, 5]
y = [1, 4, 9, 16, 25]
plt.plot(x, y, label="Line 1")

# Adding a legend and modifying its font size
plt.legend(fontsize=12)

# Display the plot
plt.show()
Output:
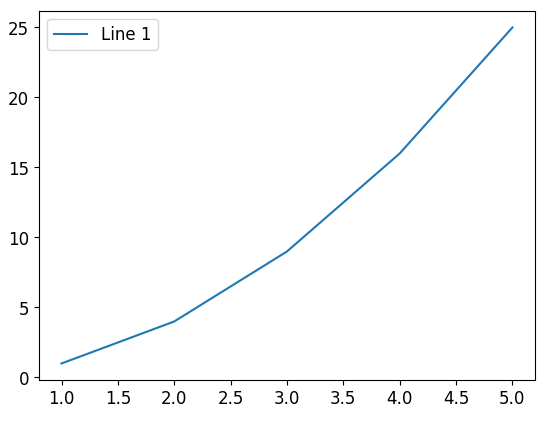
In this example, the font size of the legend has been set to 12.
Changing Font Size in Subplots in Matplotlib Label
Matplotlib also allows us to create subplots, which enable the display of multiple plots in a single figure. When dealing with subplots, we can modify the font size individually for each plot.
Let’s consider an example where we create two subplots and change the font size of their titles and axis labels:
import matplotlib.pyplot as plt

# Creating the subplots
fig, (ax1, ax2) = plt.subplots(1, 2)

# Plotting data in the first subplot
ax1.plot([1, 2, 3, 4, 5], [1, 4, 9, 16, 25])
ax1.set_title("subplot 1", fontsize=12)
ax1.set_xlabel("X values", fontsize=10)
ax1.set_ylabel("Y values", fontsize=10)

# Plotting data in the second subplot
ax2.plot([1, 3, 5, 7, 9], [1, 9, 25, 49, 81])
ax2.set_title("subplot 2", fontsize=12)
ax2.set_xlabel("X values", fontsize=10)
ax2.set_ylabel("Y values", fontsize=10)

# Adjust the layout
plt.tight_layout()

# Display the subplots
plt.show()
Output:
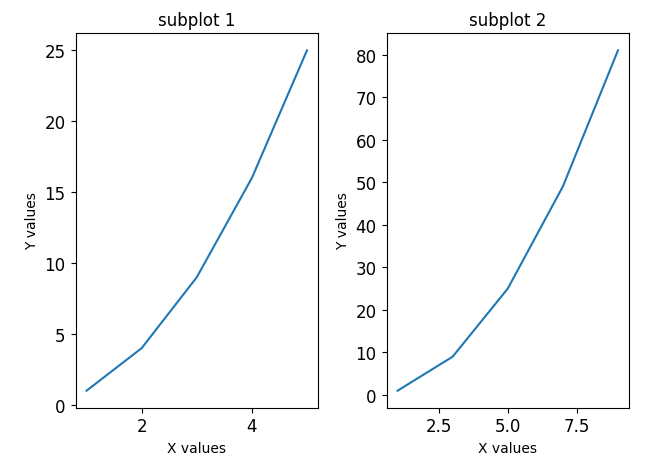
In this example, the font size of the titles is set to 12, and the font size of the axis labels is set to 10.
Matplotlib Label Font Size Conclusion
In this article, we explored different ways to change the font size of labels in Matplotlib. We discussed how to modify the font size globally and individually for titles, axis labels, legends, and subplots. Customizing the font size of labels can significantly improve the clarity and aesthetics of your data visualizations. Armed with this knowledge, you can create visually appealing plots that effectively communicate your insights.