Matplotlib label points
Matplotlib is a powerful Python library widely used for creating static, animated, and interactive visualizations in Python. It provides a wide range of plotting options, such as line plots, scatter plots, bar plots, histograms, and more. When creating scatter plots, it is often useful to label specific data points to provide additional information or make the visualization more informative. In this article, we will explore different methods to label points in Matplotlib.
Method 1: Using the annotate() function
The annotate() function in Matplotlib is a versatile tool to add annotations, including labels, to a plot. Using this function, you can specify the text, position, and style of the label. Here’s an example:
import matplotlib.pyplot as plt

x = [1, 2, 3]
y = [4, 5, 6]
labels = ['point 1', 'point 2', 'point 3']

fig, ax = plt.subplots()

# Scatter plot
ax.scatter(x, y)

# Add labels using annotate()
for i, label in enumerate(labels):
    ax.annotate(label, (x[i], y[i]))

plt.show()
Output:
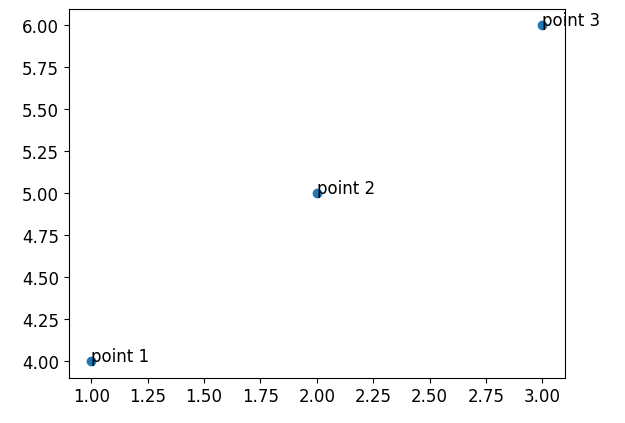
In this example, we first create a scatter plot using the scatter() function. Then, using a for loop, we iterate over the labels and coordinates and use the annotate() function to add each label to the corresponding point.
Method 2: Using the text() function
Another approach to label points is by using the text() function. This function allows you to add text to the plot at specific coordinates. Here’s an example:
import matplotlib.pyplot as plt

x = [1, 2, 3]
y = [4, 5, 6]
labels = ['point 1', 'point 2', 'point 3']

fig, ax = plt.subplots()

# Scatter plot
ax.scatter(x, y)

# Add labels using text()
for i, label in enumerate(labels):
    ax.text(x[i], y[i], label)

plt.show()
Output:
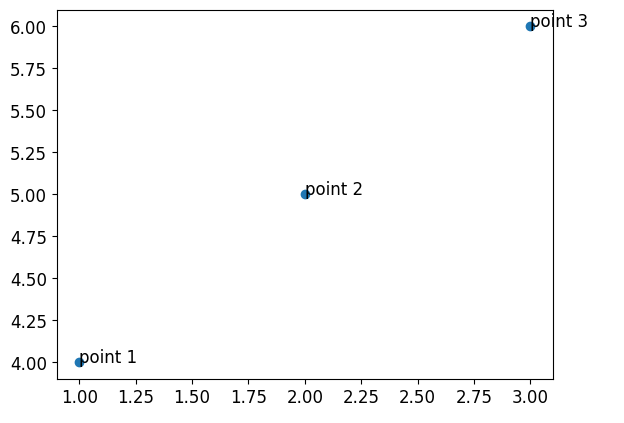
In this example, we first create a scatter plot using the scatter() function. Then, using a for loop, we iterate over the labels and coordinates and use the text() function to add each label to the corresponding point.
Method 3: Using the plot() function
The plot() function in Matplotlib can also be used to label points by plotting individual data points as markers. Here’s an example:
import matplotlib.pyplot as plt

x = [1, 2, 3]
y = [4, 5, 6]
labels = ['point 1', 'point 2', 'point 3']

fig, ax = plt.subplots()

# Scatter plot using plot()
ax.plot(x, y, 'ko')  # 'ko' represents black dots

# Add labels using text()
for i, label in enumerate(labels):
    ax.text(x[i], y[i], label)

plt.show()
Output:
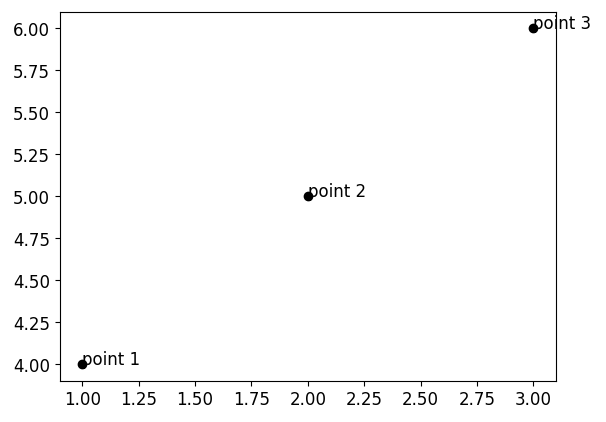
In this example, instead of using the scatter() function, we use the plot() function with the marker style 'ko', which represents black dots. Then, we add labels to the points using the text() function.
Method 4: Using the scatter() function with labels as tooltips
Sometimes, labeling points directly on the plot can lead to overcrowding, especially when dealing with large datasets. An alternative approach is to use tooltips, where the label appears when hovering over a point. The scatter() function in Matplotlib provides this functionality through the 'tooltip' parameter. Here’s an example:
import matplotlib.pyplot as plt

x = [1, 2, 3]
y = [4, 5, 6]
labels = ['point 1', 'point 2', 'point 3']

fig, ax = plt.subplots()

# Scatter plot with labels as tooltips
sc = ax.scatter(x, y, picker=True)

# Add labels using text()
for i, label in enumerate(labels):
    ax.text(x[i], y[i], label, alpha=0)  # Set alpha=0 to hide the labels initially

# Function to handle tooltip display
def onpick(event):
    ind = event.ind[0]
    text = ax.texts[ind]
    text.set_visible(not text.get_visible())
    plt.draw()

fig.canvas.mpl_connect('pick_event', onpick)

plt.show()
Output:
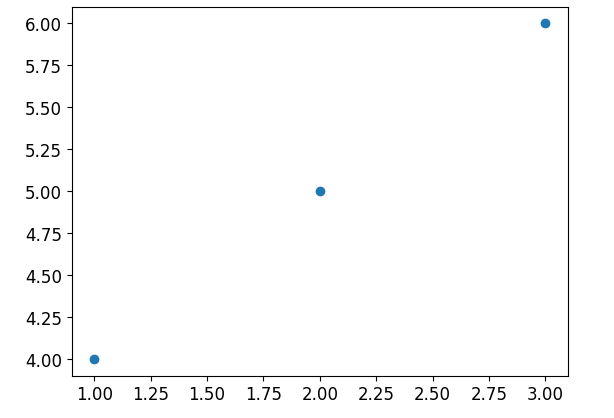
In this example, we create a scatter plot using the scatter() function with the 'picker=True' parameter to enable picking events. Then, we add labels to the points using the text() function, but set the alpha value to 0 to hide the labels initially. By connecting a function to the pick_event of the canvas, we can toggle the visibility of the labels when hovering over the points.
Method 5: Using the annotate() function with arrow-style labels
The annotate() function in Matplotlib also allows us to create arrow-style labels. This type of label is useful when there is limited space to place the text directly next to the point. Here’s an example:
import matplotlib.pyplot as plt

x = [1, 2, 3]
y = [4, 5, 6]
labels = ['point 1', 'point 2', 'point 3']

fig, ax = plt.subplots()

# Scatter plot
ax.scatter(x, y)

# Add arrow-style labels using annotate()
for i, label in enumerate(labels):
    ax.annotate(label, (x[i], y[i]), xytext=(20, -20),
                textcoords='offset points', arrowprops=dict(arrowstyle='->'))

plt.show()
Output:
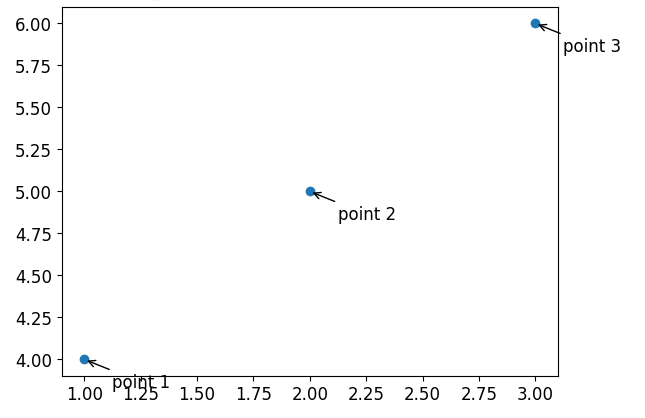
In this example, we create a scatter plot using the scatter() function. Then, using the annotate() function, we add arrow-style labels. The xytext parameter specifies the text position with respect to the point, and arrowprops is used to specify the arrow style.
Method 6: Using the text() function with arrow-style labels
Similar to the annotate() function, the text() function can also be used to create arrow-style labels. Here’s an example:
import matplotlib.pyplot as plt

x = [1, 2, 3]
y = [4, 5, 6]
labels = ['point 1', 'point 2', 'point 3']

fig, ax = plt.subplots()

# Scatter plot
ax.scatter(x, y)

# Add arrow-style labels using text()
for i, label in enumerate(labels):
    ax.text(x[i], y[i], label, va='center', ha='center',
            bbox=dict(boxstyle='round', facecolor='white', edgecolor='black'),
            arrowprops=dict(arrowstyle='->'))

plt.show()
In this example, we create a scatter plot using the scatter() function. Then, using the text() function, we add arrow-style labels. The va and ha parameters center the text vertically and horizontally, respectively. The bbox parameter is used to create a round box around the label, and arrowprops specifies the arrow style.
Method 7: Using the plot() function with customized markers
The plot() function in Matplotlib allows you to specify custom markers to represent the data points. This feature can be used effectively to label specific points. Here’s an example:
import matplotlib.pyplot as plt

x = [1, 2, 3]
y = [4, 5, 6]
labels = ['point 1', 'point 2', 'point 3']

fig, ax = plt.subplots()

# Plot with customized markers
ax.plot(x, y, marker='o', linestyle='None', label='Points')

# Add labels using text()
for i, label in enumerate(labels):
    ax.text(x[i], y[i], label)

ax.legend()

plt.show()
Output:
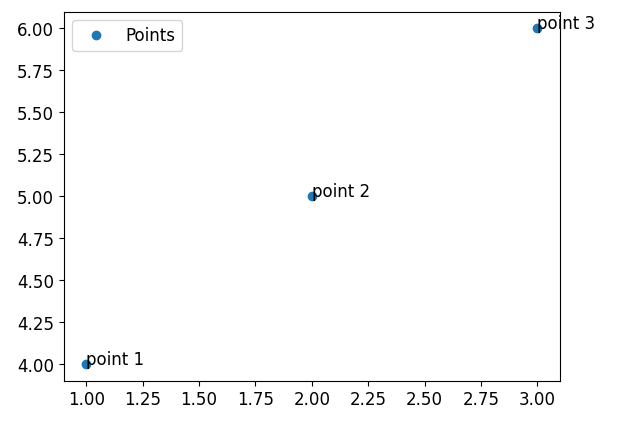
In this example, we use the plot() function with the 'o' marker style to plot individual points with customized markers. By setting linestyle='None', we remove the lines between the points,which gives the appearance of a scatter plot. Then, using the text() function, we add labels to each point. Finally, we include a legend to indicate that the markers represent the points.
Method 8: Using the scatter() function with different marker colors
In addition to customizing markers, you can also assign different colors to specific markers in a scatter plot. This can be useful when you want to highlight certain data points with color-coded labels. Here’s an example:
import matplotlib.pyplot as plt

x = [1, 2, 3, 4, 5]
y = [4, 5, 6, 7, 8]
labels = ['point 1', 'point 2', 'point 3', 'point 4', 'point 5']
colors = ['red', 'blue', 'green', 'purple', 'orange']

fig, ax = plt.subplots()

# Scatter plot with different marker colors
for i in range(len(x)):
    ax.scatter(x[i], y[i], color=colors[i])
    ax.text(x[i], y[i], labels[i])

plt.show()
Output:
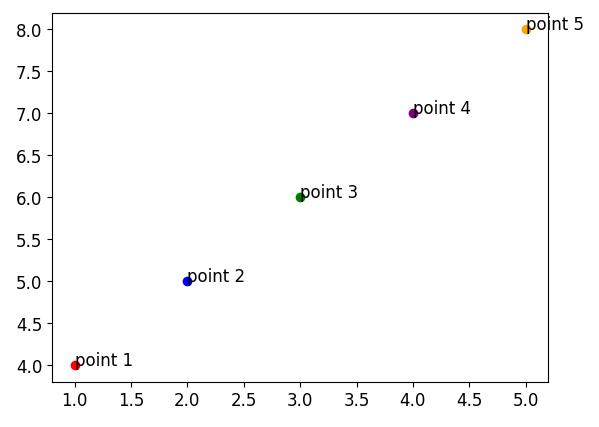
In this example, we create a scatter plot using the scatter() function. Inside a loop, we scatter each point independently and assign different colors to the markers based on the colors list. We also add labels to each point using the text() function.
Method 9: Using the text() function with colored boxes
To provide a clear visual distinction between the labels and the points, you can enclose the labels in colored boxes. This allows you to highlight the labels and make them more easily readable. Here’s an example:
import matplotlib.pyplot as plt

x = [1, 2, 3]
y = [4, 5, 6]
labels = ['point 1', 'point 2', 'point 3']
colors = ['yellow', 'cyan', 'magenta']

fig, ax = plt.subplots()

# Scatter plot
ax.scatter(x, y)

# Add labels with colored boxes using text()
for i, label in enumerate(labels):
    bbox_props = dict(boxstyle='square,pad=0.3', facecolor=colors[i], alpha=0.5)
    ax.text(x[i], y[i], label, bbox=bbox_props)

plt.show()
Output:
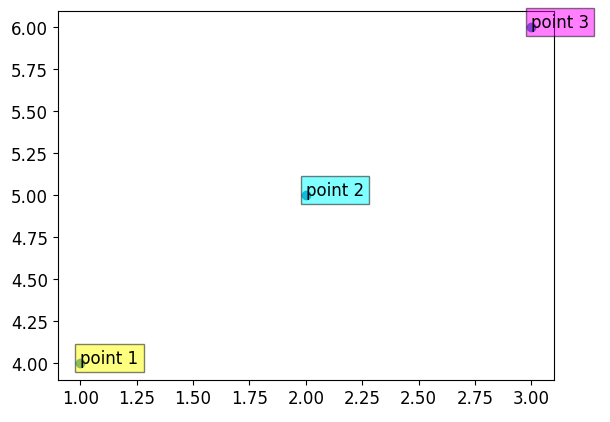
In this example, we create a scatter plot using the scatter() function. Then, using the text() function, we add labels enclosed in colored boxes. The bbox_props parameter is used to customize the box style, including the shape, padding, face color, and transparency.
Method 10: Using the legend() function
If you want to label multiple points and distinguish them using different markers or colors, you can use the legend() function in Matplotlib. This function creates a legend that associates specific markers or colors with corresponding labels. Here’s an example:
import matplotlib.pyplot as plt

x = [1, 2, 3, 4, 5]
y = [4, 5, 6, 7, 8]
labels = ['point 1', 'point 2', 'point 3', 'point 4', 'point 5']
colors = ['red', 'blue', 'green', 'purple', 'orange']

fig, ax = plt.subplots()

# Scatter plot with different marker colors and labels
for i in range(len(x)):
    ax.scatter(x[i], y[i], color=colors[i], label=labels[i])

ax.legend()

plt.show()
Output:
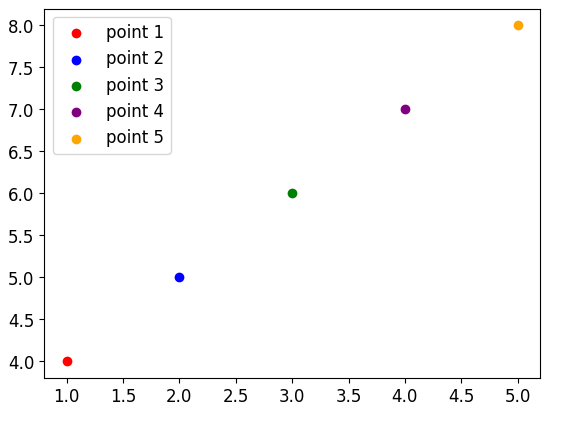
In this example, we create a scatter plot using the scatter() function. Inside a loop, we scatter each point independently and assign different colors to the markers based on the colors list. We also assign labels to each point using the label parameter. Finally, we include a legend using the legend() function to indicate the association between the markers and labels.
Matplotlib label points Conclusion
Labeling points in Matplotlib can greatly enhance the understanding and visual appeal of your scatter plots. We have discussed various methods to label points, such as using the annotate() function, the text() function, the plot() function, and customized markers and colors. Additionally, we explored advanced techniques like using tooltips, arrow-style labels, and colored boxes. By leveraging these techniques, you can create informative and visually appealing scatter plots in Matplotlib.