How to Create and Customize Text Boxes in Matplotlib: A Comprehensive Guide
Matplotlib text box is a powerful feature that allows you to add annotations, labels, and explanatory text to your plots. Text boxes in Matplotlib provide a way to enhance your visualizations with additional information, making them more informative and easier to understand. In this comprehensive guide, we’ll explore various aspects of Matplotlib text boxes, from basic usage to advanced customization techniques.
Introduction to Matplotlib Text Boxes
Matplotlib text boxes are versatile elements that can be added to plots to provide context, explanations, or annotations. They are particularly useful when you need to highlight specific data points, explain trends, or add metadata to your visualizations. Text boxes in Matplotlib can be customized in terms of their position, size, style, and content, making them a flexible tool for data visualization.
Let’s start with a simple example of adding a text box to a Matplotlib plot:
import matplotlib.pyplot as plt

fig, ax = plt.subplots()
ax.plot([1, 2, 3, 4], [1, 4, 2, 3])
ax.text(2, 3, 'This is a Matplotlib text box\nfrom how2matplotlib.com', bbox=dict(facecolor='white', edgecolor='black'))
plt.show()
Output:
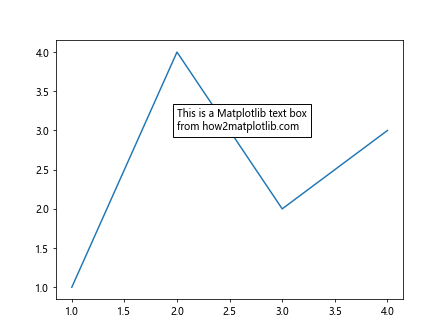
In this example, we create a simple line plot and add a text box using the text() method. The text box is positioned at coordinates (2, 3) and contains two lines of text. The bbox parameter is used to add a bounding box around the text.
Creating Basic Text Boxes in Matplotlib
Matplotlib offers several ways to create text boxes, each with its own set of features and use cases. Let’s explore some of the most common methods for adding text boxes to your plots.
Using the text() Method
The text() method is the most straightforward way to add a text box to a Matplotlib plot. It allows you to specify the position, content, and various styling options for your text box.
import matplotlib.pyplot as plt

fig, ax = plt.subplots()
ax.set_xlim(0, 10)
ax.set_ylim(0, 10)
ax.text(5, 5, 'Matplotlib text box\nfrom how2matplotlib.com',
        bbox=dict(facecolor='lightblue', edgecolor='blue', alpha=0.7))
plt.show()
Output:
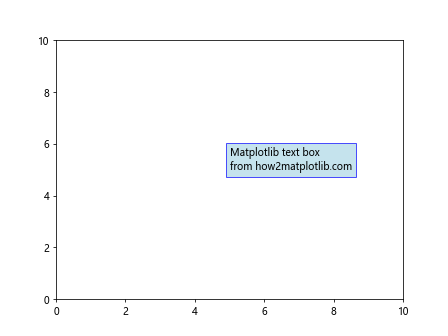
In this example, we create a text box at the center of the plot (5, 5) with a light blue background and blue edge. The alpha parameter controls the transparency of the box.
Using annotate() for Text Boxes with Arrows
The annotate() method is particularly useful when you want to create a text box that points to a specific location on your plot. This is often used to highlight data points or features of interest.
import matplotlib.pyplot as plt

fig, ax = plt.subplots()
ax.plot([1, 2, 3, 4], [1, 4, 2, 3])
ax.annotate('Peak value\nhow2matplotlib.com', xy=(2, 4), xytext=(3, 3.5),
            arrowprops=dict(facecolor='black', shrink=0.05),
            bbox=dict(boxstyle='round,pad=0.5', fc='yellow', ec='k', lw=1, alpha=0.8))
plt.show()
Output:
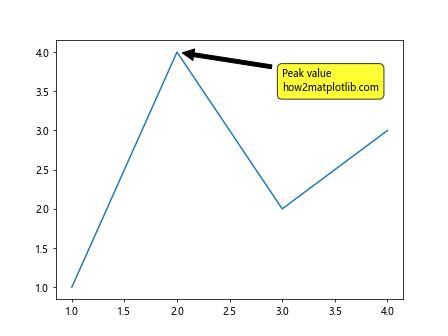
This example creates an annotation pointing to the peak value of the plot. The xy parameter specifies the point to annotate, while xytext determines the position of the text box. The arrowprops parameter is used to customize the arrow connecting the text box to the annotated point.
Customizing Matplotlib Text Boxes
Matplotlib provides a wide range of options for customizing text boxes to suit your specific needs. Let’s explore some of the most common customization techniques.
Changing Text Box Style
You can modify the appearance of your text box by adjusting its style, including the box shape, padding, and border properties.
import matplotlib.pyplot as plt

fig, ax = plt.subplots()
ax.set_xlim(0, 10)
ax.set_ylim(0, 10)
ax.text(5, 5, 'Styled Matplotlib text box\nhow2matplotlib.com',
        bbox=dict(boxstyle='round,pad=1', fc='pink', ec='r', lw=2),
        ha='center', va='center', fontsize=12, fontweight='bold')
plt.show()
Output:
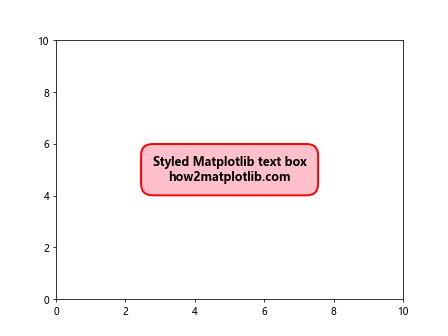
In this example, we create a round text box with pink background, red edge, and increased padding. The text is centered both horizontally and vertically within the box.
Adding Multiple Text Boxes
You can add multiple text boxes to a single plot to provide different pieces of information or to create a legend-like structure.
import matplotlib.pyplot as plt

fig, ax = plt.subplots()
ax.set_xlim(0, 10)
ax.set_ylim(0, 10)

styles = ['round', 'square', 'sawtooth', 'roundtooth']
for i, style in enumerate(styles):
    ax.text(2, 8-i*2, f'{style} style\nhow2matplotlib.com',
            bbox=dict(boxstyle=f'{style},pad=0.5', fc='w', ec='g', lw=1))

plt.show()
Output:
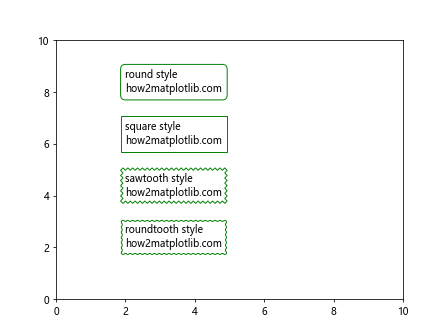
This example demonstrates four different text box styles: round, square, sawtooth, and roundtooth. Each text box is positioned at a different location on the plot.
Advanced Techniques for Matplotlib Text Boxes
Now that we’ve covered the basics, let’s explore some advanced techniques for working with Matplotlib text boxes.
Creating Rotated Text Boxes
Sometimes, you may need to rotate your text boxes to fit them into tight spaces or to create a specific visual effect.
import matplotlib.pyplot as plt
import numpy as np

fig, ax = plt.subplots()
ax.set_xlim(0, 10)
ax.set_ylim(0, 10)

for angle in range(0, 360, 45):
    ax.text(5, 5, f'Rotated {angle}°\nhow2matplotlib.com',
            rotation=angle, ha='center', va='center',
            bbox=dict(boxstyle='round,pad=0.5', fc='lightgreen', ec='g', alpha=0.8))

plt.show()
Output:
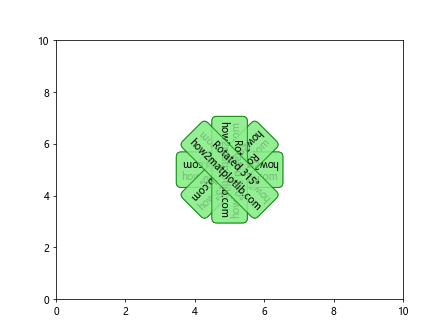
This example creates multiple rotated text boxes at different angles around a central point, demonstrating how rotation can be applied to text boxes.
Using LaTeX in Text Boxes
Matplotlib supports LaTeX rendering for text, allowing you to include mathematical equations and symbols in your text boxes.
import matplotlib.pyplot as plt

plt.rcParams['text.usetex'] = True
plt.rcParams['font.family'] = 'serif'

fig, ax = plt.subplots()
ax.set_xlim(0, 10)
ax.set_ylim(0, 10)

ax.text(5, 5, r'$\int_0^\infty e^{-x^2} dx = \frac{\sqrt{\pi}}{2}$\nhow2matplotlib.com',
        ha='center', va='center', fontsize=14,
        bbox=dict(boxstyle='round,pad=1', fc='lightyellow', ec='orange', lw=1))

plt.show()
This example demonstrates how to use LaTeX rendering to display a mathematical equation within a Matplotlib text box.
Creating Linked Text Boxes
You can create linked text boxes that are connected by lines or arrows to show relationships between different pieces of information.
import matplotlib.pyplot as plt
from matplotlib.patches import ConnectionPatch

fig, ax = plt.subplots()
ax.set_xlim(0, 10)
ax.set_ylim(0, 10)

# Create two text boxes
box1 = ax.text(2, 8, 'Box 1\nhow2matplotlib.com', ha='center', va='center',
               bbox=dict(boxstyle='round,pad=0.5', fc='lightblue', ec='blue'))
box2 = ax.text(8, 2, 'Box 2\nhow2matplotlib.com', ha='center', va='center',
               bbox=dict(boxstyle='round,pad=0.5', fc='lightgreen', ec='green'))

# Create a connection between the boxes
con = ConnectionPatch(xyA=(2, 8), xyB=(8, 2), coordsA='data', coordsB='data',
                      axesA=ax, axesB=ax, arrowstyle='->', color='red')
ax.add_artist(con)

plt.show()
Output:
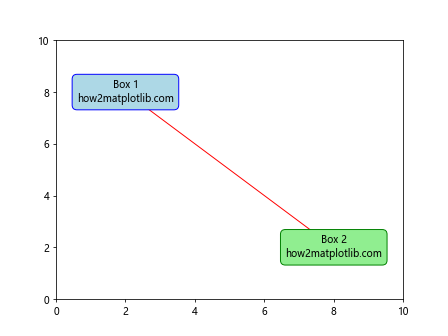
This example creates two text boxes and connects them with an arrow using the ConnectionPatch class.
Handling Text Overflow in Matplotlib Text Boxes
When working with long text in Matplotlib text boxes, you may encounter issues with text overflow. Here are some techniques to handle this problem.
Wrapping Text Automatically
You can use the textwrap module to automatically wrap long text within a text box.
import matplotlib.pyplot as plt
import textwrap

fig, ax = plt.subplots()
ax.set_xlim(0, 10)
ax.set_ylim(0, 10)

long_text = "This is a very long text that needs to be wrapped within a Matplotlib text box. Visit how2matplotlib.com for more information."
wrapped_text = textwrap.fill(long_text, width=20)

ax.text(5, 5, wrapped_text, ha='center', va='center',
        bbox=dict(boxstyle='round,pad=1', fc='lightgray', ec='gray'))

plt.show()
Output:
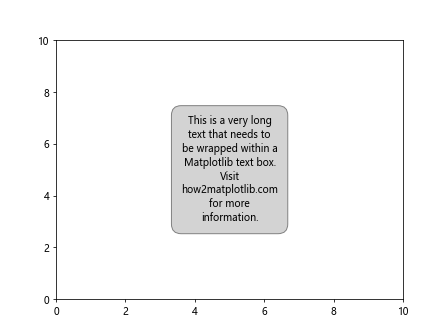
This example demonstrates how to use textwrap.fill() to automatically wrap long text within a specified width.
Creating Scrollable Text Boxes
For very long text, you can create a scrollable text box using Matplotlib’s widgets.
import matplotlib.pyplot as plt
from matplotlib.widgets import TextBox, Button

fig, ax = plt.subplots()
ax.set_xlim(0, 10)
ax.set_ylim(0, 10)

long_text = "This is a very long text that will be displayed in a scrollable text box. " * 10 + "Visit how2matplotlib.com for more information."

text_box = TextBox(plt.axes([0.1, 0.1, 0.8, 0.8]), "Scrollable Text:")
text_box.set_val(long_text)

scroll_up = Button(plt.axes([0.9, 0.5, 0.1, 0.4]), "↑")
scroll_down = Button(plt.axes([0.9, 0.1, 0.1, 0.4]), "↓")

def scroll(direction):
    current_position = text_box.text.get_position()
    new_position = (current_position[0], current_position[1] + direction * 0.1)
    text_box.text.set_position(new_position)
    plt.draw()

scroll_up.on_clicked(lambda event: scroll(1))
scroll_down.on_clicked(lambda event: scroll(-1))

plt.show()
Output:
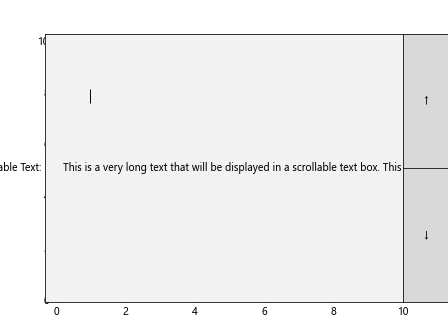
This example creates a scrollable text box with up and down buttons to navigate through long text.
Animating Matplotlib Text Boxes
Adding animations to your text boxes can make your visualizations more dynamic and engaging. Let’s explore some techniques for animating Matplotlib text boxes.
Fading Text Boxes
You can create a fade-in effect for your text boxes using Matplotlib’s animation capabilities.
import matplotlib.pyplot as plt
import matplotlib.animation as animation

fig, ax = plt.subplots()
ax.set_xlim(0, 10)
ax.set_ylim(0, 10)

text_box = ax.text(5, 5, 'Fading text box\nhow2matplotlib.com',
                   ha='center', va='center', alpha=0,
                   bbox=dict(boxstyle='round,pad=0.5', fc='yellow', ec='orange', alpha=0))

def update(frame):
    text_box.set_alpha(frame / 100)
    text_box.get_bbox_patch().set_alpha(frame / 100)
    return text_box,

ani = animation.FuncAnimation(fig, update, frames=100, interval=50, blit=True)
plt.show()
Output:
This example creates a text box that gradually fades in over time.
Moving Text Boxes
You can also animate the position of text boxes to create dynamic effects.
import matplotlib.pyplot as plt
import matplotlib.animation as animation
import numpy as np

fig, ax = plt.subplots()
ax.set_xlim(0, 10)
ax.set_ylim(0, 10)

text_box = ax.text(0, 5, 'Moving text box\nhow2matplotlib.com',
                   ha='center', va='center',
                   bbox=dict(boxstyle='round,pad=0.5', fc='lightblue', ec='blue'))

def update(frame):
    x = 5 + 3 * np.sin(frame / 10)
    y = 5 + 3 * np.cos(frame / 10)
    text_box.set_position((x, y))
    return text_box,

ani = animation.FuncAnimation(fig, update, frames=200, interval=50, blit=True)
plt.show()
Output:
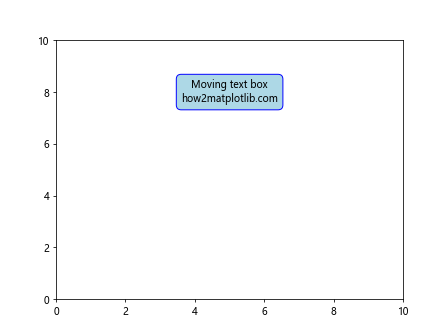
This example creates a text box that moves in a circular pattern around the center of the plot.
Using Text Boxes for Data Visualization
Text boxes can be powerful tools for enhancing data visualizations. Let’s explore some ways to use text boxes to add context and information to your plots.
Adding Statistical Information
You can use text boxes to display statistical information about your data directly on the plot.
import matplotlib.pyplot as plt
import numpy as np

np.random.seed(42)
data = np.random.normal(0, 1, 1000)

fig, ax = plt.subplots()
ax.hist(data, bins=30)

stats_text = f"Mean: {np.mean(data):.2f}\n"
stats_text += f"Std Dev: {np.std(data):.2f}\n"
stats_text += f"Median: {np.median(data):.2f}\n"
stats_text += "how2matplotlib.com"

ax.text(0.95, 0.95, stats_text, transform=ax.transAxes, va='top', ha='right',
        bbox=dict(boxstyle='round,pad=0.5', fc='white', ec='gray', alpha=0.8))

plt.show()
Output:
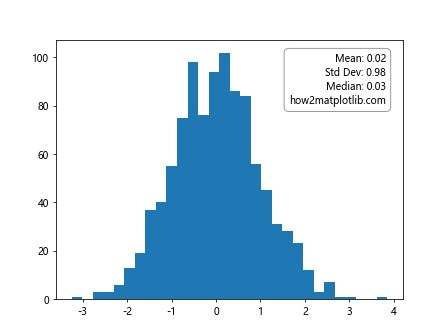
This example creates a histogram and adds a text box with statistical information about the data.
Creating Dynamic Legends
Text boxes can be used to create dynamic legends that update based on user interactions.
import matplotlib.pyplot as plt
from matplotlib.widgets import CheckButtons

fig, ax = plt.subplots()
ax.set_xlim(0, 10)
ax.set_ylim(0, 10)

lines = [ax.plot(range(10), [i]*10, label=f'Line {i+1}')[0] for i in range(3)]
legend_text = ax.text(0.95, 0.95, '', transform=ax.transAxes, va='top', ha='right',
        bbox=dict(boxstyle='round,pad=0.5', fc='white', ec='gray', alpha=0.8))

def update_legend(label):
    visible_lines = [line for line in lines if line.get_visible()]
    legend_text.set_text('\n'.join([f"{line.get_label()}: Visible" for line in visible_lines] + ['how2matplotlib.com']))
    plt.draw()

check = CheckButtons(plt.axes([0.02, 0.05, 0.15, 0.15]), [f'Line {i+1}' for i in range(3)], [True, True, True])
check.on_clicked(update_legend)

update_legend(None)
plt.show()
Output:
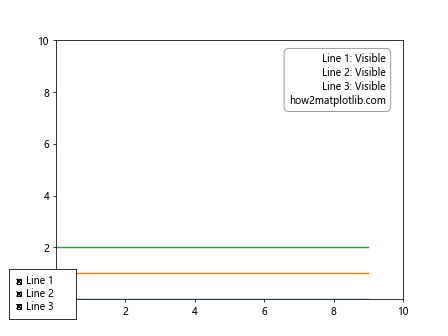
This example creates a plot with multiple lines and a dynamic legend that updates based on which lines are visible.
Handling Text Box Overlaps
When working with multiple text boxes, you may encounter issues with overlapping. Here are some techniques to handle this problem.
Creating a Text Box Layout Manager
You can create a custom layout manager to organize your text boxes and prevent overlaps.
import matplotlib.pyplot as plt

class TextBoxLayoutManager:
    def __init__(self, ax):
        self.ax = ax
        self.boxes = []

    def add_box(self, x, y, text):
        box = self.ax.text(x, y, text, ha='center', va='center',
                           bbox=dict(boxstyle='round,pad=0.5', fc='white', ec='gray', alpha=0.8))
        self.boxes.append(box)
        self._adjust_layout()

    def _adjust_layout(self):
        for i, box in enumerate(self.boxes):
            box.set_position((0.1, 0.9 - i * 0.1))

fig, ax = plt.subplots()
ax.set_xlim(0, 10)
ax.set_ylim(0, 10)

layout_manager = TextBoxLayoutManager(ax)

for i in range(5):
    layout_manager.add_box(5, 5, f'Text Box {i+1}\nhow2matplotlib.com')

plt.show()
Output:
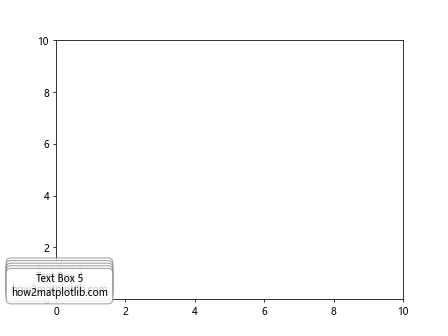
This example creates a simple layout manager that stacks text boxes vertically to avoid overlaps.
Integrating Text Boxes with Interactive Plots
Text boxes can be integrated with interactive plots to create dynamic and informative visualizations.
Hover Information Display
You can use text boxes to display information when hovering over data points.
import matplotlib.pyplot as plt
import numpy as np

fig, ax = plt.subplots()
ax.set_xlim(0, 10)
ax.set_ylim(0, 10)

x = np.random.rand(20) * 10
y = np.random.rand(20) * 10
scatter = ax.scatter(x, y)

annot = ax.annotate("", xy=(0,0), xytext=(20,20), textcoords="offset points",
                    bbox=dict(boxstyle="round", fc="w"),
                    arrowprops=dict(arrowstyle="->"))
annot.set_visible(False)

def update_annot(ind):
    pos = scatter.get_offsets()[ind["ind"][0]]
    annot.xy = pos
    text = f"Point: {pos}\nhow2matplotlib.com"
    annot.set_text(text)

def hover(event):
    vis = annot.get_visible()
    if event.inaxes == ax:
        cont, ind = scatter.contains(event)
        if cont:
            update_annot(ind)
            annot.set_visible(True)
            fig.canvas.draw_idle()
        else:
            if vis:
                annot.set_visible(False)
                fig.canvas.draw_idle()

fig.canvas.mpl_connect("motion_notify_event", hover)

plt.show()
Output:
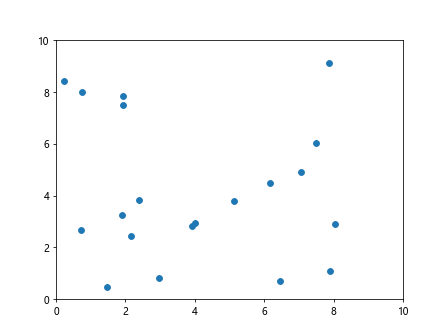
This example creates a scatter plot where hovering over a point displays a text box with information about that point.
Text Box Input for Plot Manipulation
You can use text boxes to allow users to input values that affect the plot.
import matplotlib.pyplot as plt
from matplotlib.widgets import TextBox
import numpy as np

fig, ax = plt.subplots()
ax.set_xlim(0, 10)
ax.set_ylim(0, 10)

x = np.linspace(0, 10, 100)
line, = ax.plot(x, np.sin(x))

def submit(text):
    try:
        freq = float(text)
        line.set_ydata(np.sin(freq * x))
        fig.canvas.draw_idle()
    except ValueError:
        pass

axbox = fig.add_axes([0.1, 0.05, 0.8, 0.075])
text_box = TextBox(axbox, 'Frequency', initial='1.0')
text_box.on_submit(submit)

plt.text(0.5, 0.95, 'Enter frequency to update sine wave\nhow2matplotlib.com',
         ha='center', va='center', transform=fig.transFigure)

plt.show()
Output:
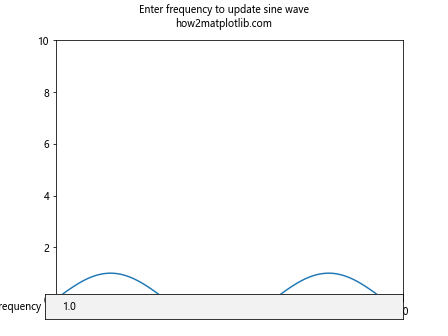
This example creates a sine wave plot with a text box that allows the user to input a frequency value to update the plot.
Best Practices for Using Matplotlib Text Boxes
When working with Matplotlib text boxes, it’s important to follow some best practices to ensure your visualizations are effective and professional.
Consistency in Style
Maintain a consistent style for your text boxes throughout your visualization or across multiple plots.
import matplotlib.pyplot as plt

def create_styled_text_box(ax, x, y, text):
    return ax.text(x, y, text, ha='center', va='center',
                   bbox=dict(boxstyle='round,pad=0.5', fc='#F0F0F0', ec='#404040', lw=1, alpha=0.9),
                   fontsize=10, fontweight='bold', color='#202020')

fig, (ax1, ax2) = plt.subplots(1, 2, figsize=(12, 5))

create_styled_text_box(ax1, 0.5, 0.5, 'Consistent Style\nPlot 1\nhow2matplotlib.com')
create_styled_text_box(ax2, 0.5, 0.5, 'Consistent Style\nPlot 2\nhow2matplotlib.com')

ax1.set_xlim(0, 1)
ax1.set_ylim(0, 1)
ax2.set_xlim(0, 1)
ax2.set_ylim(0, 1)

plt.show()
Output:
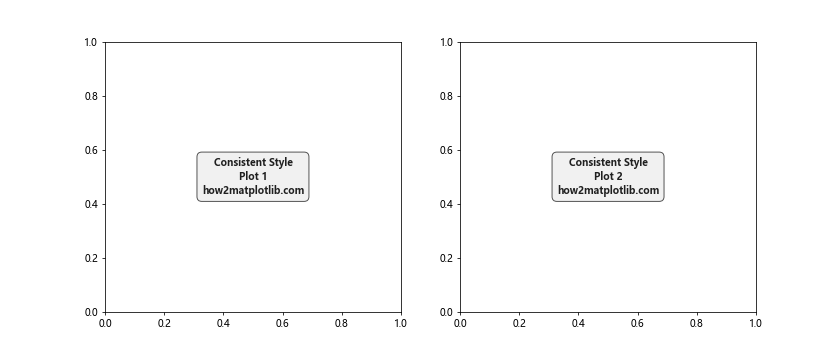
This example demonstrates how to create a consistent style for text boxes across multiple subplots.
Responsive Design
Consider how your text boxes will appear on different screen sizes and in different contexts (e.g., presentations, publications).
import matplotlib.pyplot as plt

def create_responsive_plot(figsize):
    fig, ax = plt.subplots(figsize=figsize)
    ax.set_xlim(0, 10)
    ax.set_ylim(0, 10)

    fontsize = min(figsize) * 1.5

    ax.text(5, 5, 'Responsive Text Box\nhow2matplotlib.com', ha='center', va='center',
            bbox=dict(boxstyle='round,pad=0.5', fc='lightblue', ec='blue', lw=1, alpha=0.8),
            fontsize=fontsize)

    return fig

sizes = [(6, 4), (8, 6), (10, 8)]

for size in sizes:
    fig = create_responsive_plot(size)
    plt.show()
Output:
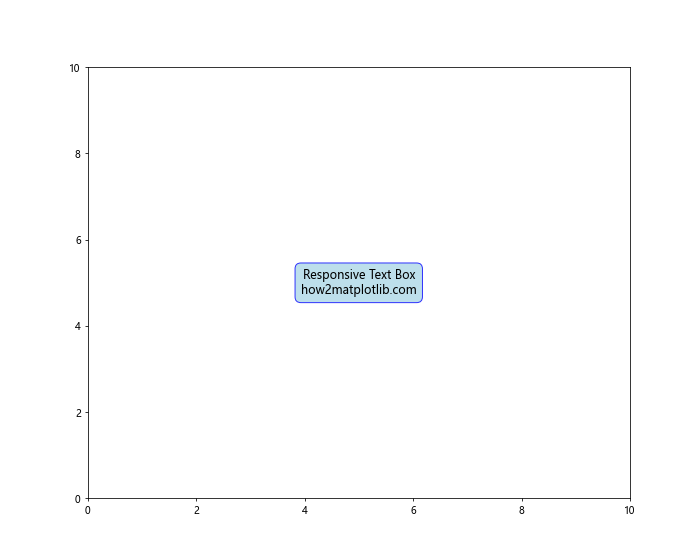
This example demonstrates how to create text boxes that adjust their size based on the figure dimensions, ensuring readability across different display sizes.
Troubleshooting Common Issues with Matplotlib Text Boxes
When working with Matplotlib text boxes, you may encounter some common issues. Here are some solutions to these problems.
Text Box Positioning
Sometimes, text boxes may not appear where you expect them to. This can often be resolved by adjusting the coordinate system or using different positioning methods.
import matplotlib.pyplot as plt

fig, ax = plt.subplots()
ax.set_xlim(0, 10)
ax.set_ylim(0, 10)

# Data coordinates
ax.text(5, 5, 'Data Coordinates\nhow2matplotlib.com', ha='center', va='center',
        bbox=dict(boxstyle='round,pad=0.5', fc='lightblue', ec='blue'))

# Axes coordinates
ax.text(0.2, 0.8, 'Axes Coordinates\nhow2matplotlib.com', ha='center', va='center',
        transform=ax.transAxes,
        bbox=dict(boxstyle='round,pad=0.5', fc='lightgreen', ec='green'))

# Figure coordinates
fig.text(0.8, 0.2, 'Figure Coordinates\nhow2matplotlib.com', ha='center', va='center',
         bbox=dict(boxstyle='round,pad=0.5', fc='lightyellow', ec='orange'))

plt.show()
Output:
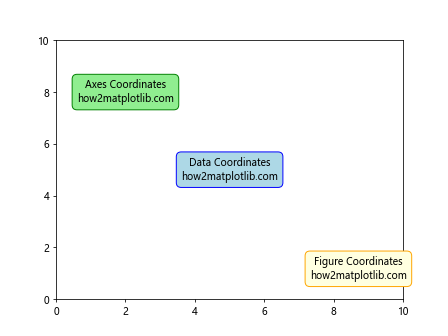
This example demonstrates three different methods of positioning text boxes: using data coordinates, axes coordinates, and figure coordinates.
Text Box Clipping
Text boxes may be clipped if they extend beyond the axes limits. You can resolve this by adjusting the axes limits or using the clip_on parameter.
import matplotlib.pyplot as plt

fig, ax = plt.subplots()
ax.set_xlim(0, 10)
ax.set_ylim(0, 10)

# Clipped text box
ax.text(9.5, 9.5, 'Clipped Text Box\nhow2matplotlib.com', ha='center', va='center',
        bbox=dict(boxstyle='round,pad=0.5', fc='lightcoral', ec='red'))

# Unclipped text box
ax.text(9.5, 9.5, 'Unclipped Text Box\nhow2matplotlib.com', ha='center', va='center',
        bbox=dict(boxstyle='round,pad=0.5', fc='lightgreen', ec='green'),
        clip_on=False)

plt.show()
Output:
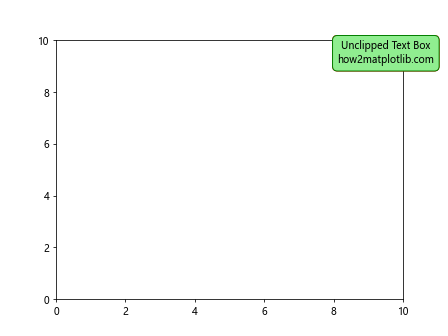
This example shows the difference between a clipped text box and an unclipped text box that extends beyond the axes limits.
Text Box Formatting Issues
Sometimes, text within text boxes may not appear as expected due to formatting issues. You can resolve this by adjusting text properties or using raw strings for special characters.
import matplotlib.pyplot as plt

fig, ax = plt.subplots()
ax.set_xlim(0, 10)
ax.set_ylim(0, 10)

# Regular string (may cause issues with backslashes)
ax.text(2, 8, 'Regular String: \n \t \alpha',
        bbox=dict(boxstyle='round,pad=0.5', fc='lightblue', ec='blue'))

# Raw string (preserves backslashes)
ax.text(2, 5, r'Raw String: \n \t \alpha',
        bbox=dict(boxstyle='round,pad=0.5', fc='lightgreen', ec='green'))

# Formatted string with LaTeX
ax.text(2, 2, r'LaTeX: $\alpha = \frac{\beta}{\gamma}$\nhow2matplotlib.com',
        bbox=dict(boxstyle='round,pad=0.5', fc='lightyellow', ec='orange'))

plt.show()
Output:
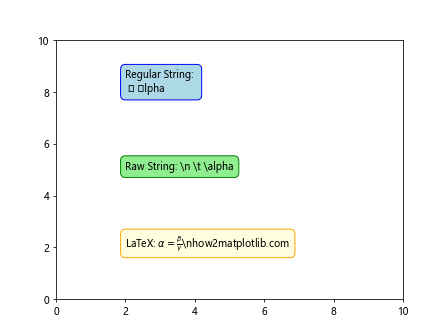
This example demonstrates different ways of handling text formatting within text boxes, including the use of raw strings and LaTeX formatting.
Matplotlib text box Conclusion
Matplotlib text boxes are a powerful tool for enhancing your data visualizations with annotations, explanations, and interactive elements. By mastering the techniques covered in this comprehensive guide, you’ll be able to create more informative and engaging plots that effectively communicate your data insights.
Remember to consider the following key points when working with Matplotlib text boxes:
- Choose the appropriate method for adding text boxes based on your specific needs (e.g.,
text(),annotate(), orTextBoxwidget). - Customize the appearance of your text boxes to match your visualization style and enhance readability.
- Use text boxes to provide context, highlight important data points, and display statistical information.
- Implement interactive features to create dynamic and responsive visualizations.
- Follow best practices for consistency, clarity, and responsive design.
- Troubleshoot common issues related to positioning, clipping, and formatting.
By incorporating these techniques into your Matplotlib workflows, you’ll be able to create more effective and professional-looking visualizations that clearly communicate your data stories. Whether you’re creating static plots for publications or interactive visualizations for presentations, mastering Matplotlib text boxes will significantly enhance your data visualization capabilities.