How to Master Matplotlib Figure Size Units
Matplotlib figure size units are essential for controlling the dimensions and appearance of your plots. Understanding how to manipulate figure size units in Matplotlib is crucial for creating visually appealing and professional-looking visualizations. In this comprehensive guide, we’ll explore various aspects of Matplotlib figure size units, providing detailed explanations and practical examples to help you master this fundamental concept.
Introduction to Matplotlib Figure Size Units
Matplotlib figure size units refer to the measurements used to define the dimensions of a figure or plot. These units play a crucial role in determining the overall size and proportions of your visualizations. By default, Matplotlib uses inches as the standard unit for figure sizes, but it also supports other units such as centimeters and points.
Let’s start with a basic example to illustrate how to set the figure size using inches:
import matplotlib.pyplot as plt

# Create a figure with a specific size in inches
plt.figure(figsize=(8, 6))

# Plot some data
plt.plot([1, 2, 3, 4], [1, 4, 2, 3])

# Add labels and title
plt.xlabel('X-axis')
plt.ylabel('Y-axis')
plt.title('How2Matplotlib.com: Basic Figure Size Example')

# Display the plot
plt.show()
Output:
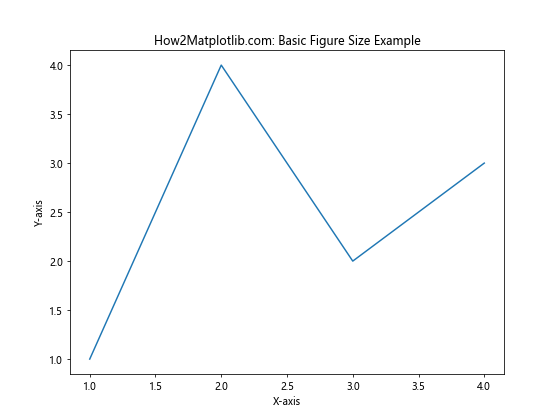
In this example, we use the figsize parameter to set the figure size to 8 inches wide and 6 inches tall. This is a common starting point for many visualizations, but you can adjust these values to suit your specific needs.
Understanding Matplotlib Figure Size Units
Before diving deeper into Matplotlib figure size units, it’s important to understand the different units available and how they relate to each other. Matplotlib supports the following units for figure sizes:
- Inches (default)
- Centimeters
- Millimeters
- Points
To convert between these units, you can use the following relationships:
- 1 inch = 2.54 centimeters
- 1 inch = 25.4 millimeters
- 1 inch = 72 points
Let’s create an example that demonstrates how to use different units for figure sizes:
import matplotlib.pyplot as plt

# Create figures with different size units
fig1, ax1 = plt.subplots(figsize=(8, 6))  # Inches (default)
fig2, ax2 = plt.subplots(figsize=(20, 15))  # Centimeters
fig3, ax3 = plt.subplots(figsize=(200, 150))  # Millimeters
fig4, ax4 = plt.subplots(figsize=(576, 432))  # Points

# Plot data on each figure
for ax in [ax1, ax2, ax3, ax4]:
    ax.plot([1, 2, 3, 4], [1, 4, 2, 3])
    ax.set_xlabel('X-axis')
    ax.set_ylabel('Y-axis')
    ax.set_title('How2Matplotlib.com: Figure Size Units Example')

# Adjust layout and display the plots
plt.tight_layout()
plt.show()
In this example, we create four figures with the same proportions but using different units. Note that the values for centimeters, millimeters, and points are calculated based on the inch values (8×6 inches) using the conversion factors mentioned earlier.
Setting Matplotlib Figure Size Units
Now that we understand the basics of Matplotlib figure size units, let’s explore different ways to set and manipulate these units in your plots.
Using the figsize Parameter
The most common way to set the figure size is by using the figsize parameter when creating a new figure. This parameter accepts a tuple of two values representing the width and height of the figure.
import matplotlib.pyplot as plt

# Create a figure with a specific size
plt.figure(figsize=(10, 5))

# Plot some data
plt.plot([1, 2, 3, 4], [1, 4, 2, 3])

# Add labels and title
plt.xlabel('X-axis')
plt.ylabel('Y-axis')
plt.title('How2Matplotlib.com: Custom Figure Size Example')

# Display the plot
plt.show()
Output:
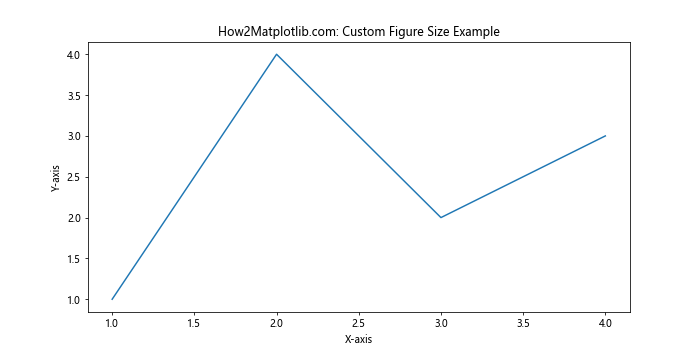
In this example, we create a figure that is 10 inches wide and 5 inches tall. You can adjust these values to create figures of different sizes and aspect ratios.
Using rcParams to Set Default Figure Size
If you want to set a default figure size for all your plots in a script or notebook, you can use Matplotlib’s rcParams configuration:
import matplotlib.pyplot as plt

# Set the default figure size
plt.rcParams['figure.figsize'] = [10, 5]

# Create multiple figures
for i in range(3):
    plt.figure()
    plt.plot([1, 2, 3, 4], [i+1, i+4, i+2, i+3])
    plt.xlabel('X-axis')
    plt.ylabel('Y-axis')
    plt.title(f'How2Matplotlib.com: Plot {i+1}')

# Display the plots
plt.show()
Output:
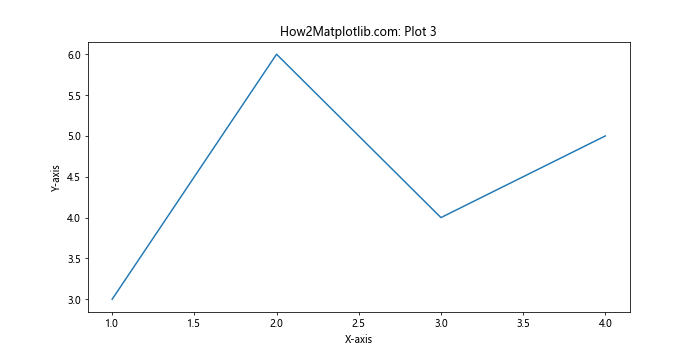
In this example, we set the default figure size to 10×5 inches using rcParams. All subsequent figures created in the script will use this size unless explicitly overridden.
Changing Figure Size After Creation
Sometimes you may need to change the figure size after creating it. You can do this using the set_size_inches() method:
import matplotlib.pyplot as plt

# Create a figure with an initial size
fig, ax = plt.subplots(figsize=(8, 6))

# Plot some data
ax.plot([1, 2, 3, 4], [1, 4, 2, 3])

# Add labels and title
ax.set_xlabel('X-axis')
ax.set_ylabel('Y-axis')
ax.set_title('How2Matplotlib.com: Changing Figure Size Example')

# Change the figure size
fig.set_size_inches(12, 4)

# Display the plot
plt.show()
Output:
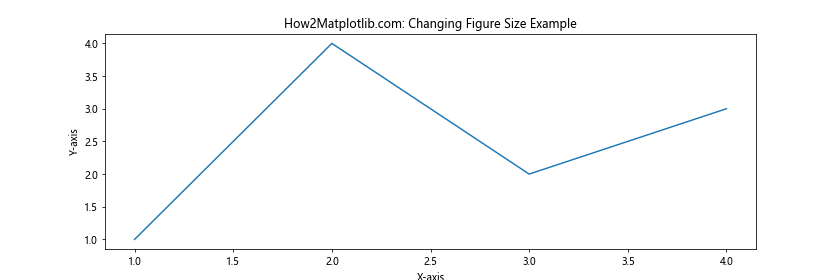
In this example, we initially create a figure with an 8×6 inch size, but then change it to 12×4 inches using the set_size_inches() method.
Working with DPI and Figure Size Units
DPI (Dots Per Inch) is another important concept related to figure size units in Matplotlib. DPI determines the resolution of your plot and affects how the figure size translates to pixel dimensions.
Setting DPI for Better Resolution
You can set the DPI when creating a figure or saving it to a file. Here’s an example:
import matplotlib.pyplot as plt

# Create a figure with a specific size and DPI
fig, ax = plt.subplots(figsize=(8, 6), dpi=300)

# Plot some data
ax.plot([1, 2, 3, 4], [1, 4, 2, 3])

# Add labels and title
ax.set_xlabel('X-axis')
ax.set_ylabel('Y-axis')
ax.set_title('How2Matplotlib.com: High DPI Example')

# Save the figure with high DPI
plt.savefig('high_dpi_plot.png', dpi=300)

# Display the plot
plt.show()
Output:
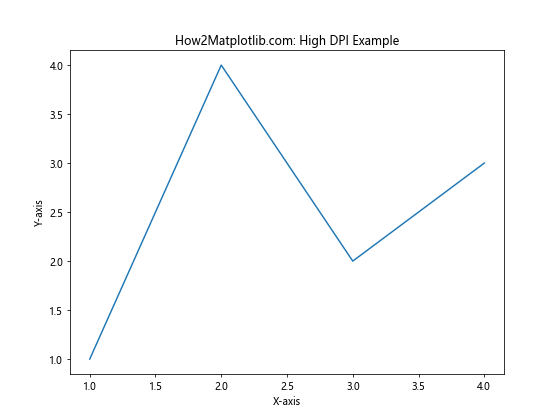
In this example, we create a figure with a DPI of 300, which will result in a higher-resolution image when saved or displayed.
Calculating Pixel Dimensions
To calculate the pixel dimensions of your figure, you can multiply the figure size by the DPI. Here’s an example that demonstrates this:
import matplotlib.pyplot as plt

# Set figure size and DPI
fig_width = 8  # inches
fig_height = 6  # inches
dpi = 100

# Calculate pixel dimensions
pixel_width = fig_width * dpi
pixel_height = fig_height * dpi

# Create the figure
fig, ax = plt.subplots(figsize=(fig_width, fig_height), dpi=dpi)

# Plot some data
ax.plot([1, 2, 3, 4], [1, 4, 2, 3])

# Add labels and title
ax.set_xlabel('X-axis')
ax.set_ylabel('Y-axis')
ax.set_title(f'How2Matplotlib.com: {pixel_width}x{pixel_height} pixels')

# Display the plot
plt.show()
Output:
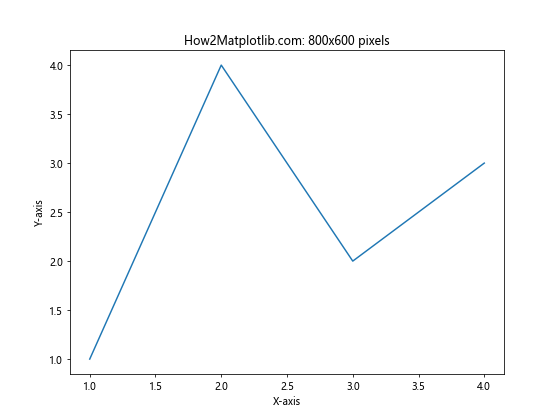
This example creates a figure with specific dimensions in inches and a given DPI, then calculates and displays the resulting pixel dimensions in the plot title.
Adjusting Matplotlib Figure Size Units for Different Plot Types
Different types of plots may require different figure size units to achieve the best visual results. Let’s explore how to adjust figure size units for various plot types.
Bar Plots
For bar plots, you might want to adjust the figure size based on the number of bars and their width. Here’s an example:
import matplotlib.pyplot as plt
import numpy as np

# Generate data
categories = ['A', 'B', 'C', 'D', 'E']
values = np.random.randint(1, 10, len(categories))

# Calculate figure size based on number of bars
bar_width = 0.5
fig_width = max(6, len(categories) * bar_width * 2)
fig_height = 6

# Create the figure
fig, ax = plt.subplots(figsize=(fig_width, fig_height))

# Create the bar plot
ax.bar(categories, values, width=bar_width)

# Add labels and title
ax.set_xlabel('Categories')
ax.set_ylabel('Values')
ax.set_title('How2Matplotlib.com: Adjusted Figure Size for Bar Plot')

# Display the plot
plt.tight_layout()
plt.show()
Output:
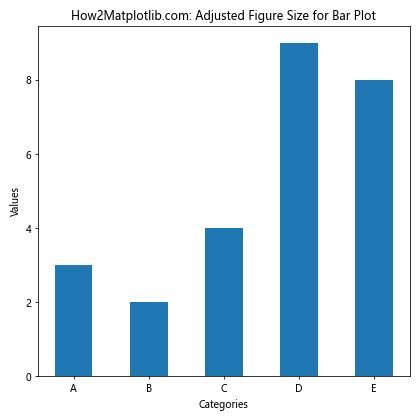
In this example, we calculate the figure width based on the number of bars and their width, ensuring that the plot has enough space for all bars.
Scatter Plots
For scatter plots, you might want to maintain a square aspect ratio to avoid distorting the relationships between data points. Here’s an example:
import matplotlib.pyplot as plt
import numpy as np

# Generate data
np.random.seed(42)
x = np.random.rand(50)
y = np.random.rand(50)

# Create a square figure
fig, ax = plt.subplots(figsize=(8, 8))

# Create the scatter plot
ax.scatter(x, y)

# Add labels and title
ax.set_xlabel('X-axis')
ax.set_ylabel('Y-axis')
ax.set_title('How2Matplotlib.com: Square Figure for Scatter Plot')

# Set equal aspect ratio
ax.set_aspect('equal')

# Display the plot
plt.show()
Output:
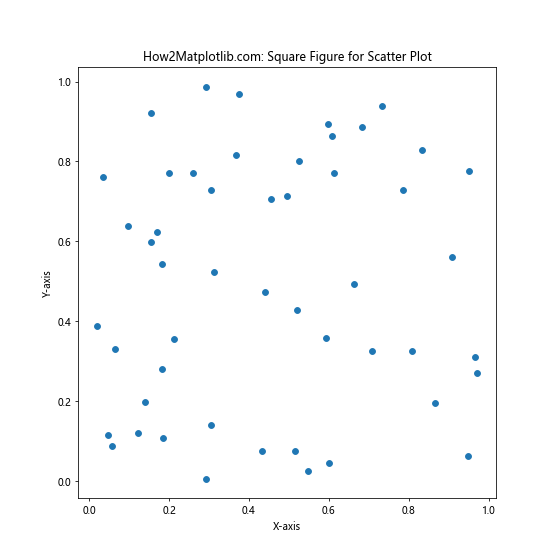
In this example, we create a square figure (8×8 inches) to ensure that the scatter plot maintains its proportions.
Subplots
When working with subplots, you may need to adjust the overall figure size to accommodate multiple plots. Here’s an example:
import matplotlib.pyplot as plt
import numpy as np

# Generate data
x = np.linspace(0, 10, 100)
y1 = np.sin(x)
y2 = np.cos(x)
y3 = np.tan(x)
y4 = x**2

# Create a figure with subplots
fig, axs = plt.subplots(2, 2, figsize=(12, 10))

# Plot data on each subplot
axs[0, 0].plot(x, y1)
axs[0, 0].set_title('How2Matplotlib.com: Sine')

axs[0, 1].plot(x, y2)
axs[0, 1].set_title('How2Matplotlib.com: Cosine')

axs[1, 0].plot(x, y3)
axs[1, 0].set_title('How2Matplotlib.com: Tangent')

axs[1, 1].plot(x, y4)
axs[1, 1].set_title('How2Matplotlib.com: Square')

# Adjust layout and display the plot
plt.tight_layout()
plt.show()
Output:
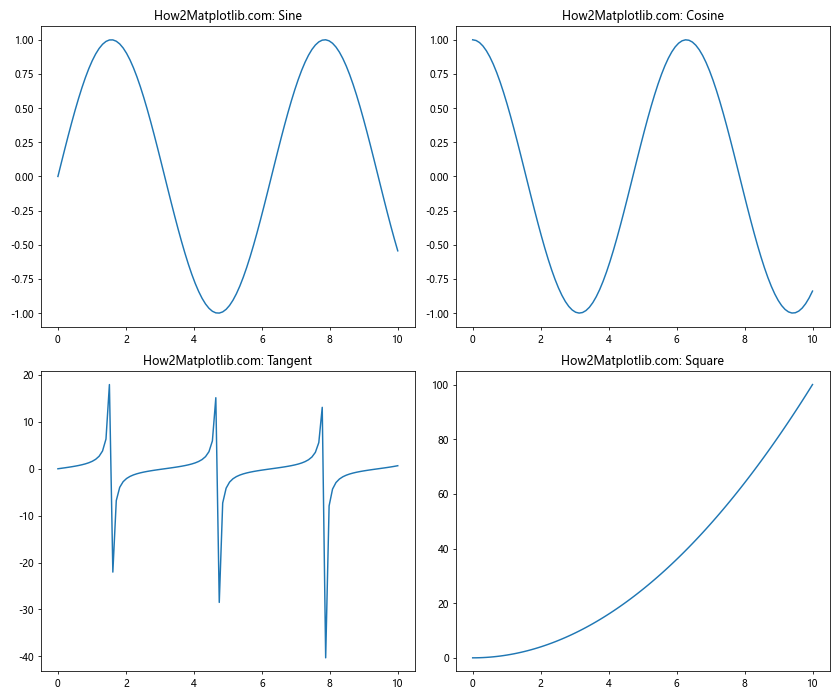
In this example, we create a larger figure (12×10 inches) to accommodate four subplots arranged in a 2×2 grid.
Advanced Techniques for Matplotlib Figure Size Units
Now that we’ve covered the basics of Matplotlib figure size units, let’s explore some advanced techniques to give you even more control over your plot dimensions.
Using Relative Units
Instead of specifying absolute sizes in inches or other units, you can use relative units based on the size of your screen or window. This can be particularly useful when creating responsive visualizations. Here’s an example:
import matplotlib.pyplot as plt
from matplotlib.figure import Figure
from matplotlib.backends.backend_agg import FigureCanvasAgg

# Create a figure with relative size
fig = Figure(figsize=(0.8, 0.6), dpi=100)
canvas = FigureCanvasAgg(fig)

# Get the size of the canvas in pixels
width, height = canvas.get_width_height()

# Create an axes instance
ax = fig.add_subplot(111)

# Plot some data
ax.plot([1, 2, 3, 4], [1, 4, 2, 3])

# Add labels and title
ax.set_xlabel('X-axis')
ax.set_ylabel('Y-axis')
ax.set_title(f'How2Matplotlib.com: Relative Size ({width}x{height} pixels)')

# Display the plot
plt.show()
In this example, we create a figure with a size relative to the default figure size (80% width, 60% height). The actual pixel dimensions will depend on your screen resolution and DPI settings.
Adjusting Figure Size Based on Content
Sometimes you may want to adjust the figure size based on the content of your plot. For example, you might want to ensure that all tick labels are visible without overlapping. Here’s an example that demonstrates this:
import matplotlib.pyplot as plt
import numpy as np

# Generate data
categories = ['Category A', 'Category B', 'Category C', 'Category D', 'Category E']
values = np.random.randint(1, 10, len(categories))

# Create the initial figure
fig, ax = plt.subplots(figsize=(8, 6))

# Create the bar plot
ax.bar(categories, values)

# Add labels and title
ax.set_xlabel('Categories')
ax.set_ylabel('Values')
ax.set_title('How2Matplotlib.com: Adjusting Figure Size for Content')

# Rotate x-axis labels
plt.xticks(rotation=45, ha='right')

# Adjust figure size to fit content
plt.tight_layout()
fig.canvas.draw()

# Get the tight bbox
bbox = fig.get_tightbbox(fig.canvas.get_renderer())
fig.set_size_inches(bbox.width / fig.dpi, bbox.height / fig.dpi)

# Display the plot
plt.show()
In this example, we create an initial figure, plot the data, and then adjust the figure size based on the content, ensuring that all labels are visible without overlapping.
Creating Figures with Golden Ratio Proportions
The golden ratio (approximately 1.618) is often considered aesthetically pleasing in design. You can use this ratio to create figures with pleasing proportions. Here’s an example:
import matplotlib.pyplot as plt
import numpy as np

# Define the golden ratio
golden_ratio = (1 + 5**0.5) / 2

# Set the width of the figure
width = 10

# Calculate the height based on the golden ratio
height = width / golden_ratio

# Create the figure
fig, ax = plt.subplots(figsize=(width, height))

# Generate and plot some data
x = np.linspace(0, 10, 100)
y = np.sin(x) * np.exp(-0.1 * x)
ax.plot(x, y)

# Add labels and title
ax.set_xlabel('X-axis')
ax.set_ylabel('Y-axis')
ax.set_title('How2Matplotlib.com: Golden Ratio Figure')

# Display the plot
plt.show()
Output:
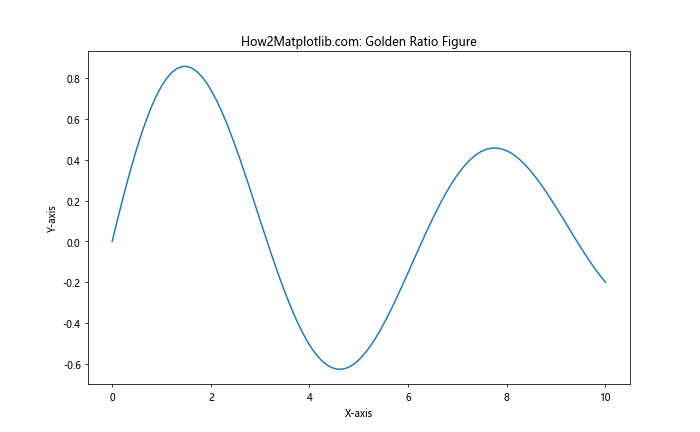
This example creates a figure with dimensions based on the golden ratio, resulting in a visually pleasing aspect ratio.
Best## Best Practices for Matplotlib Figure Size Units
When working with Matplotlib figure size units, it’s important to follow some best practices to ensure your visualizations are consistent, readable, and visually appealing. Here are some tips to keep in mind:
1. Maintain Consistency Across Projects
When working on a series of plots or a larger project, it’s a good idea to maintain consistent figure sizes. This helps create a cohesive look and feel across your visualizations. You can achieve this by defining standard sizes at the beginning of your project:
import matplotlib.pyplot as plt

# Define standard figure sizes
SMALL_FIG = (6, 4)
MEDIUM_FIG = (8, 6)
LARGE_FIG = (12, 8)

# Use these sizes throughout your project
plt.figure(figsize=MEDIUM_FIG)
plt.plot([1, 2, 3, 4], [1, 4, 2, 3])
plt.title('How2Matplotlib.com: Consistent Figure Size')
plt.show()
Output:
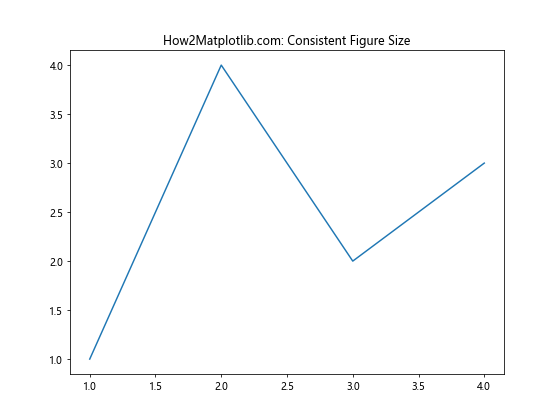
By using predefined sizes, you ensure consistency across your visualizations and make it easier to adjust sizes globally if needed.
2. Consider the Output Medium
The intended output medium for your plot should influence your choice of figure size units. For example:
- For print: Use inches or centimeters and a higher DPI (e.g., 300 DPI)
- For web: Use pixels or a lower DPI (e.g., 72-150 DPI)
- For presentations: Consider the aspect ratio of the presentation slides
Here’s an example of creating a plot optimized for print:
import matplotlib.pyplot as plt
import numpy as np

# Create a figure optimized for print
fig, ax = plt.subplots(figsize=(8, 6), dpi=300)

# Generate and plot some data
x = np.linspace(0, 10, 100)
y = np.sin(x)
ax.plot(x, y)

# Add labels and title
ax.set_xlabel('X-axis')
ax.set_ylabel('Y-axis')
ax.set_title('How2Matplotlib.com: Print-Optimized Figure')

# Save the figure as a high-quality PNG
plt.savefig('print_optimized_figure.png', dpi=300, bbox_inches='tight')

plt.show()
Output:
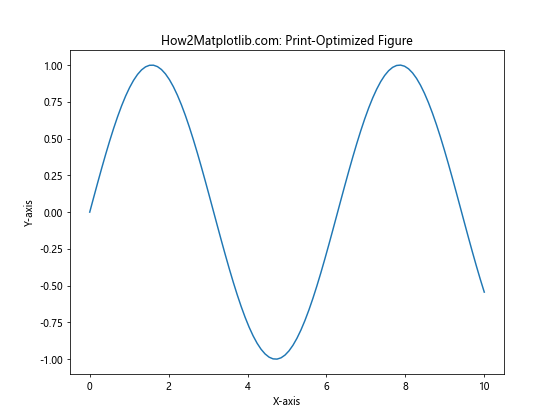
This example creates a figure with a size suitable for print and saves it as a high-resolution PNG file.
3. Use Aspect Ratios Wisely
The aspect ratio of your figure can significantly impact the perception of your data. For certain types of plots, maintaining specific aspect ratios is crucial:
- Scatter plots: Often benefit from a 1:1 aspect ratio
- Time series: May require wider figures to show trends clearly
- Comparison plots: Should have consistent aspect ratios for fair comparisons
Here’s an example of creating a time series plot with an appropriate aspect ratio:
import matplotlib.pyplot as plt
import numpy as np

# Generate time series data
dates = pd.date_range(start='2023-01-01', end='2023-12-31', freq='D')
values = np.cumsum(np.random.randn(len(dates)))

# Create a wide figure for the time series
fig, ax = plt.subplots(figsize=(12, 5))

# Plot the time series
ax.plot(dates, values)

# Add labels and title
ax.set_xlabel('Date')
ax.set_ylabel('Value')
ax.set_title('How2Matplotlib.com: Time Series with Appropriate Aspect Ratio')

# Rotate x-axis labels for better readability
plt.xticks(rotation=45)

# Adjust layout and display the plot
plt.tight_layout()
plt.show()
This example creates a wide figure that’s suitable for displaying time series data, allowing trends to be easily observed.
4. Adapt to Data Complexity
As the complexity of your data increases, you may need to adjust your figure size to accommodate more information. For example, when creating plots with multiple subplots or complex annotations, consider increasing the overall figure size:
import matplotlib.pyplot as plt
import numpy as np

# Generate complex data
x = np.linspace(0, 10, 100)
y1 = np.sin(x)
y2 = np.cos(x)
y3 = np.tan(x)
y4 = x**2

# Create a larger figure to accommodate complex data
fig, axs = plt.subplots(2, 2, figsize=(12, 10))

# Plot data on each subplot
axs[0, 0].plot(x, y1)
axs[0, 0].set_title('How2Matplotlib.com: Sine')

axs[0, 1].plot(x, y2)
axs[0, 1].set_title('How2Matplotlib.com: Cosine')

axs[1, 0].plot(x, y3)
axs[1, 0].set_title('How2Matplotlib.com: Tangent')

axs[1, 1].plot(x, y4)
axs[1, 1].set_title('How2Matplotlib.com: Square')

# Add a main title
fig.suptitle('Complex Data Visualization', fontsize=16)

# Adjust layout and display the plot
plt.tight_layout()
plt.show()
Output:
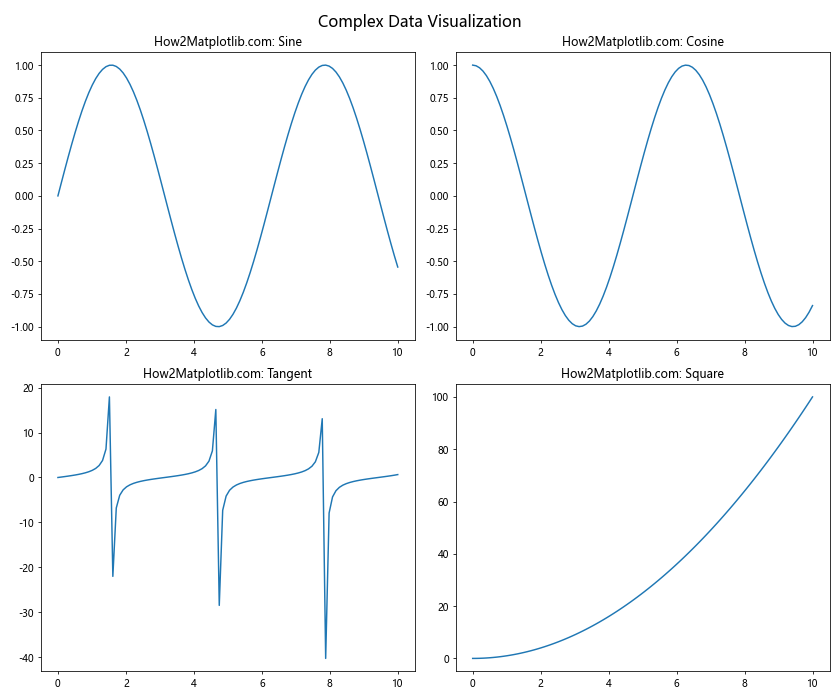
This example uses a larger figure size to accommodate four subplots, ensuring that each subplot has enough space to be clearly visible.
Troubleshooting Common Issues with Matplotlib Figure Size Units
Even with a good understanding of Matplotlib figure size units, you may encounter some common issues. Let’s explore these problems and their solutions.
Issue 1: Overlapping Labels or Titles
Sometimes, labels or titles may overlap when the figure size is too small. Here’s how to address this issue:
import matplotlib.pyplot as plt
import numpy as np

# Generate data
categories = ['Category A', 'Category B', 'Category C', 'Category D', 'Category E']
values = np.random.randint(1, 10, len(categories))

# Create the figure
fig, ax = plt.subplots(figsize=(8, 6))

# Create the bar plot
ax.bar(categories, values)

# Add labels and title
ax.set_xlabel('Categories')
ax.set_ylabel('Values')
ax.set_title('How2Matplotlib.com: Addressing Overlapping Labels')

# Rotate x-axis labels
plt.xticks(rotation=45, ha='right')

# Adjust layout to prevent overlapping
plt.tight_layout()

# Display the plot
plt.show()
Output:
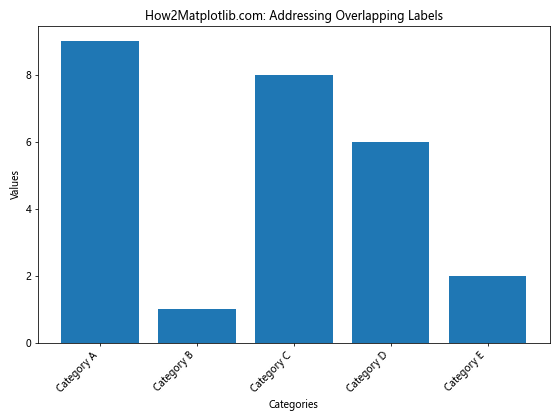
In this example, we use plt.tight_layout() to automatically adjust the layout and prevent overlapping. We also rotate the x-axis labels to save space.
Issue 2: Inconsistent Sizes Across Different Plotting Functions
Different Matplotlib functions may interpret figure sizes differently. To ensure consistency, always set the figure size explicitly:
import matplotlib.pyplot as plt
import numpy as np

# Set a consistent figure size
fig_size = (8, 6)

# Create plots using different functions
fig, (ax1, ax2) = plt.subplots(1, 2, figsize=fig_size)

# Plot 1: Using plot()
x = np.linspace(0, 10, 100)
ax1.plot(x, np.sin(x))
ax1.set_title('How2Matplotlib.com: plot()')

# Plot 2: Using scatter()
x = np.random.rand(50)
y = np.random.rand(50)
ax2.scatter(x, y)
ax2.set_title('How2Matplotlib.com: scatter()')

# Adjust layout and display the plot
plt.tight_layout()
plt.show()
Output:
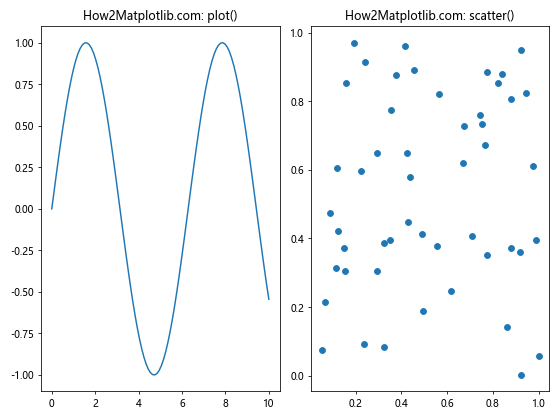
By explicitly setting the figure size when creating subplots, we ensure that both plots have consistent dimensions.
Issue 3: Figure Size Changes When Saving
Sometimes, the figure size may change when saving the plot to a file. To prevent this, use the bbox_inches='tight' parameter when saving:
import matplotlib.pyplot as plt
import numpy as np

# Create a figure with a specific size
fig, ax = plt.subplots(figsize=(8, 6))

# Generate and plot some data
x = np.linspace(0, 10, 100)
y = np.sin(x)
ax.plot(x, y)

# Add labels and title
ax.set_xlabel('X-axis')
ax.set_ylabel('Y-axis')
ax.set_title('How2Matplotlib.com: Consistent Figure Size When Saving')

# Save the figure with consistent size
plt.savefig('consistent_size_figure.png', dpi=300, bbox_inches='tight')

plt.show()
Output:
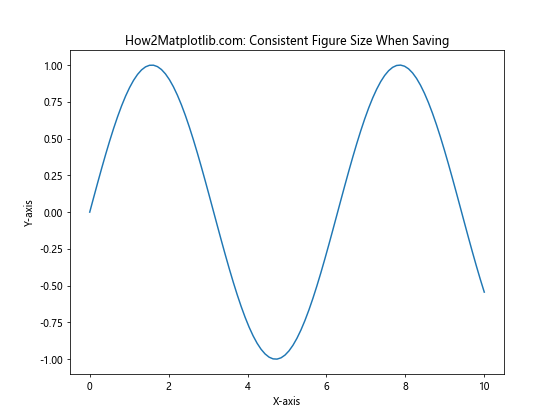
The bbox_inches='tight' parameter ensures that the saved figure includes all elements without changing the specified figure size.
Conclusion
Mastering Matplotlib figure size units is crucial for creating professional and visually appealing data visualizations. Throughout this comprehensive guide, we’ve explored various aspects of working with figure size units in Matplotlib, including:
- Understanding different units (inches, centimeters, millimeters, and points)
- Setting and adjusting figure sizes using various methods
- Working with DPI and pixel dimensions
- Adapting figure sizes for different plot types
- Advanced techniques for fine-tuning figure dimensions
- Best practices for consistent and effective visualizations
- Troubleshooting common issues related to figure size units
By applying the concepts and techniques discussed in this guide, you’ll be well-equipped to create high-quality visualizations that effectively communicate your data insights. Remember to consider the context of your visualization, the intended audience, and the medium of presentation when deciding on figure sizes.