How to Change Matplotlib Figure Size
How to change matplotlib figure size is an essential skill for anyone working with data visualization in Python. Matplotlib is a powerful library that allows you to create a wide variety of plots and charts, and controlling the figure size is crucial for producing visually appealing and informative graphics. In this comprehensive guide, we’ll explore various methods and techniques to change matplotlib figure size, providing you with the knowledge and tools to customize your plots effectively.
Understanding Matplotlib Figure Size
Before we dive into the specifics of how to change matplotlib figure size, it’s important to understand what figure size means in the context of Matplotlib. The figure size refers to the overall dimensions of the plot, including any axes, titles, and labels. By default, Matplotlib creates figures with a size of 6.4 inches by 4.8 inches. However, you may often need to adjust this size to better suit your specific visualization needs.
Let’s start with a basic example of how to change matplotlib figure size:
import matplotlib.pyplot as plt

# Create a figure with a custom size
plt.figure(figsize=(10, 6))

# Plot some data
plt.plot([1, 2, 3, 4], [1, 4, 2, 3])

# Add a title
plt.title("How to change matplotlib figure size - how2matplotlib.com")

# Display the plot
plt.show()
Output:
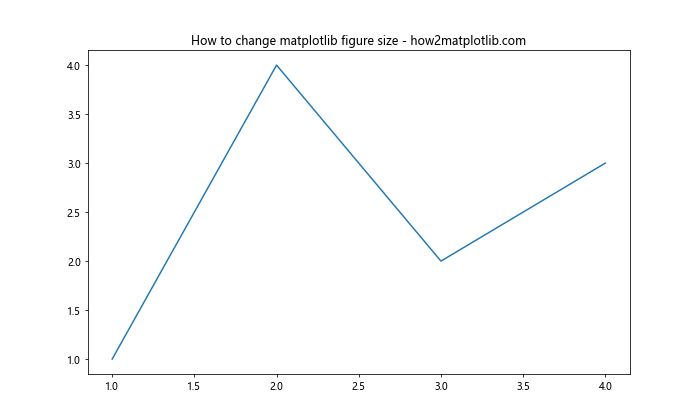
In this example, we use the figsize parameter of the plt.figure() function to set the figure size to 10 inches wide and 6 inches tall. This is one of the most straightforward ways to change matplotlib figure size.
Methods to Change Matplotlib Figure Size
There are several methods you can use to change matplotlib figure size. Let’s explore each of them in detail.
1. Using plt.figure()
As we saw in the previous example, the plt.figure() function is a common way to change matplotlib figure size. Here’s another example that demonstrates how to use this method:
import matplotlib.pyplot as plt
import numpy as np

# Generate some data
x = np.linspace(0, 10, 100)
y = np.sin(x)

# Create a figure with a custom size
plt.figure(figsize=(12, 8))

# Plot the data
plt.plot(x, y)

# Add labels and title
plt.xlabel("X-axis")
plt.ylabel("Y-axis")
plt.title("How to change matplotlib figure size using plt.figure() - how2matplotlib.com")

# Display the plot
plt.show()
Output:
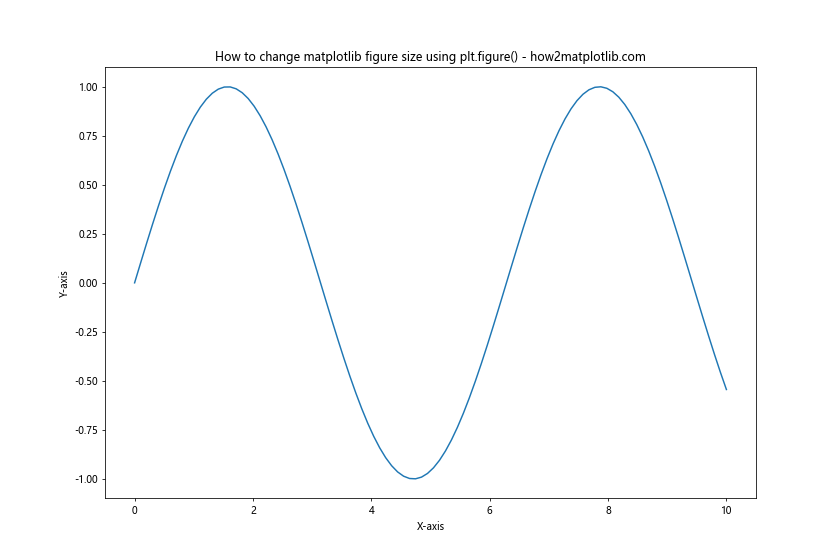
In this example, we set the figure size to 12 inches wide and 8 inches tall. This method is particularly useful when you want to create a new figure with a specific size.
2. Using fig.set_size_inches()
Another way to change matplotlib figure size is by using the set_size_inches() method of the figure object. This method allows you to change the size of an existing figure. Here’s an example:
import matplotlib.pyplot as plt
import numpy as np

# Generate some data
x = np.linspace(0, 10, 100)
y = np.cos(x)

# Create a figure
fig = plt.figure()

# Change the figure size
fig.set_size_inches(10, 5)

# Plot the data
plt.plot(x, y)

# Add labels and title
plt.xlabel("X-axis")
plt.ylabel("Y-axis")
plt.title("How to change matplotlib figure size using set_size_inches() - how2matplotlib.com")

# Display the plot
plt.show()
Output:
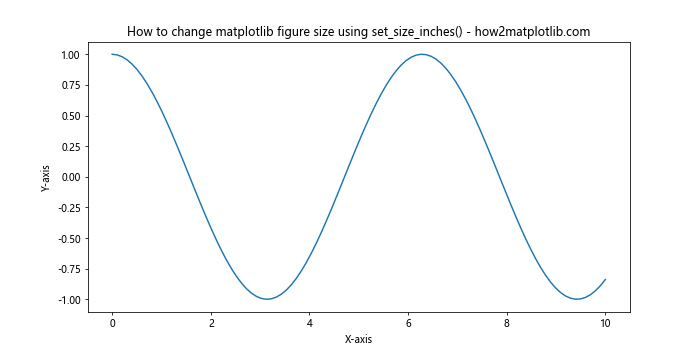
In this example, we first create a figure using plt.figure(), then use fig.set_size_inches(10, 5) to change the figure size to 10 inches wide and 5 inches tall.
3. Using rcParams
Matplotlib’s rcParams (runtime configuration parameters) provide a way to set default values for various plot settings, including figure size. Here’s how you can use rcParams to change matplotlib figure size:
import matplotlib.pyplot as plt
import numpy as np

# Set the default figure size
plt.rcParams['figure.figsize'] = [8, 6]

# Generate some data
x = np.linspace(0, 10, 100)
y = np.tan(x)

# Create a plot
plt.plot(x, y)

# Add labels and title
plt.xlabel("X-axis")
plt.ylabel("Y-axis")
plt.title("How to change matplotlib figure size using rcParams - how2matplotlib.com")

# Display the plot
plt.show()
Output:
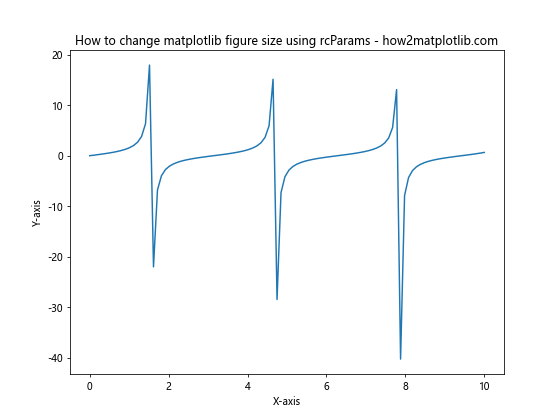
In this example, we set the default figure size to 8 inches wide and 6 inches tall using plt.rcParams['figure.figsize'] = [8, 6]. This setting will apply to all subsequent plots in your script unless you explicitly override it.
Changing Figure Size for Subplots
When working with subplots, you might want to change matplotlib figure size for the entire figure containing multiple subplots. Here’s how you can do that:
import matplotlib.pyplot as plt
import numpy as np

# Create a figure with a custom size and subplots
fig, (ax1, ax2) = plt.subplots(1, 2, figsize=(12, 5))

# Generate some data
x = np.linspace(0, 10, 100)
y1 = np.sin(x)
y2 = np.cos(x)

# Plot data on the first subplot
ax1.plot(x, y1)
ax1.set_title("Sine Wave")

# Plot data on the second subplot
ax2.plot(x, y2)
ax2.set_title("Cosine Wave")

# Add a main title
fig.suptitle("How to change matplotlib figure size for subplots - how2matplotlib.com")

# Adjust the layout
plt.tight_layout()

# Display the plot
plt.show()
Output:
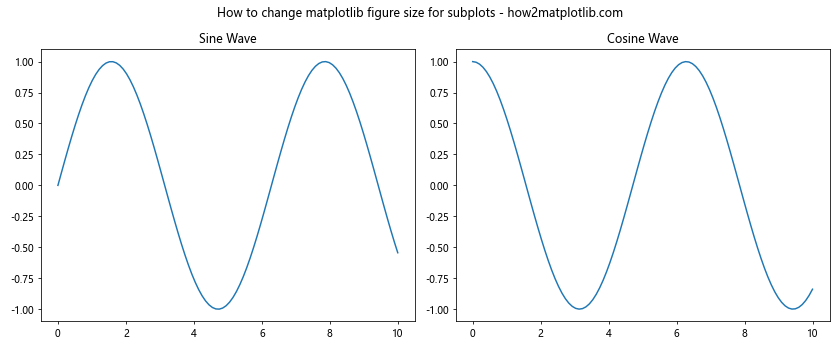
In this example, we use plt.subplots(1, 2, figsize=(12, 5)) to create a figure with two subplots side by side, and set the overall figure size to 12 inches wide and 5 inches tall.
Changing Figure Size for Specific Plot Types
Different types of plots may require different approaches to change matplotlib figure size. Let’s explore how to adjust figure size for some common plot types.
Changing Figure Size for Histograms
When creating histograms, you might want to adjust the figure size to better display the distribution of your data. Here’s an example:
import matplotlib.pyplot as plt
import numpy as np

# Generate some random data
data = np.random.randn(1000)

# Create a figure with a custom size
plt.figure(figsize=(10, 6))

# Create the histogram
plt.hist(data, bins=30, edgecolor='black')

# Add labels and title
plt.xlabel("Value")
plt.ylabel("Frequency")
plt.title("How to change matplotlib figure size for histograms - how2matplotlib.com")

# Display the plot
plt.show()
Output:
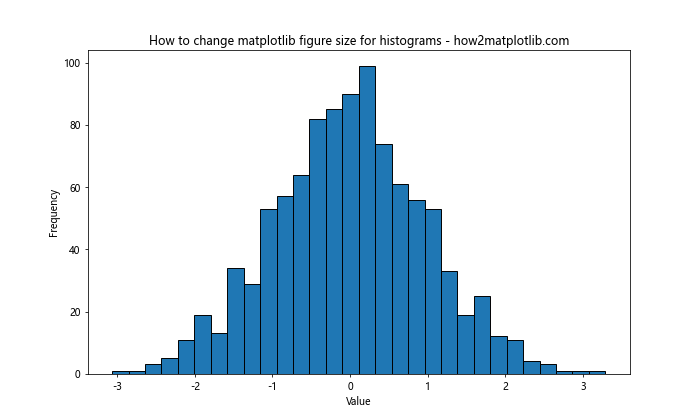
In this example, we set the figure size to 10 inches wide and 6 inches tall, which provides a good aspect ratio for displaying the histogram.
Changing Figure Size for Scatter Plots
Scatter plots often benefit from a square aspect ratio. Here’s how you can change matplotlib figure size for a scatter plot:
import matplotlib.pyplot as plt
import numpy as np

# Generate some random data
x = np.random.rand(100)
y = np.random.rand(100)

# Create a figure with a square aspect ratio
plt.figure(figsize=(8, 8))

# Create the scatter plot
plt.scatter(x, y)

# Add labels and title
plt.xlabel("X-axis")
plt.ylabel("Y-axis")
plt.title("How to change matplotlib figure size for scatter plots - how2matplotlib.com")

# Display the plot
plt.show()
Output:
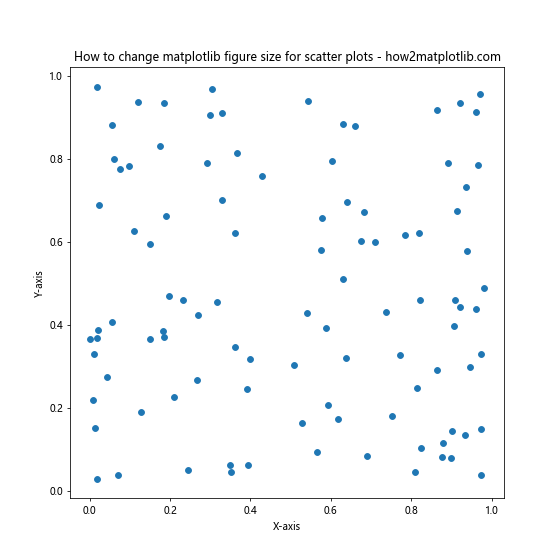
In this example, we set the figure size to 8 inches by 8 inches, creating a square plot that’s well-suited for scatter plots.
Changing Figure Size for Bar Charts
Bar charts often require more horizontal space, especially when dealing with many categories. Here’s an example of how to change matplotlib figure size for a bar chart:
import matplotlib.pyplot as plt
import numpy as np

# Define categories and values
categories = ['Category A', 'Category B', 'Category C', 'Category D', 'Category E']
values = [23, 45, 56, 78, 32]

# Create a figure with a wide aspect ratio
plt.figure(figsize=(12, 6))

# Create the bar chart
plt.bar(categories, values)

# Add labels and title
plt.xlabel("Categories")
plt.ylabel("Values")
plt.title("How to change matplotlib figure size for bar charts - how2matplotlib.com")

# Rotate x-axis labels for better readability
plt.xticks(rotation=45)

# Adjust layout to prevent cutting off labels
plt.tight_layout()

# Display the plot
plt.show()
Output:
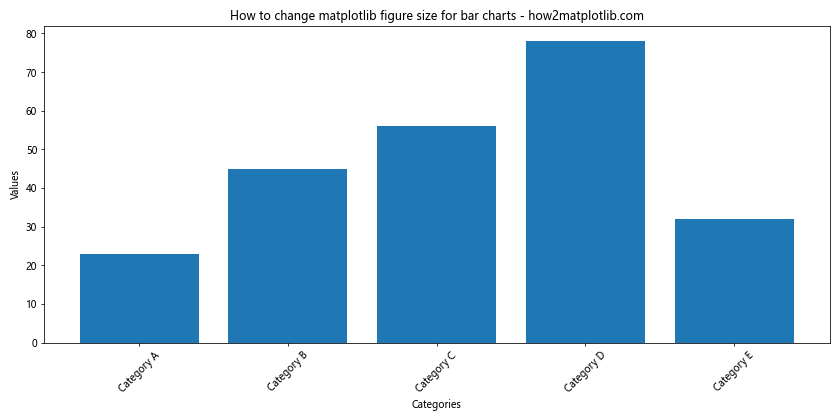
In this example, we set the figure size to 12 inches wide and 6 inches tall, providing ample space for the bars and labels.
Advanced Techniques for Changing Matplotlib Figure Size
Now that we’ve covered the basics of how to change matplotlib figure size, let’s explore some more advanced techniques that can give you even greater control over your plot dimensions.
Using Inches vs. Pixels
By default, Matplotlib uses inches for figure size. However, you can also specify the size in pixels. Here’s an example of how to change matplotlib figure size using pixels:
import matplotlib.pyplot as plt
import numpy as np

# Set DPI (dots per inch)
dpi = 100

# Calculate figure size in inches
width_inches = 800 / dpi
height_inches = 600 / dpi

# Create a figure with the calculated size
fig = plt.figure(figsize=(width_inches, height_inches), dpi=dpi)

# Generate some data
x = np.linspace(0, 10, 100)
y = np.sin(x)

# Plot the data
plt.plot(x, y)

# Add labels and title
plt.xlabel("X-axis")
plt.ylabel("Y-axis")
plt.title("How to change matplotlib figure size using pixels - how2matplotlib.com")

# Display the plot
plt.show()
Output:
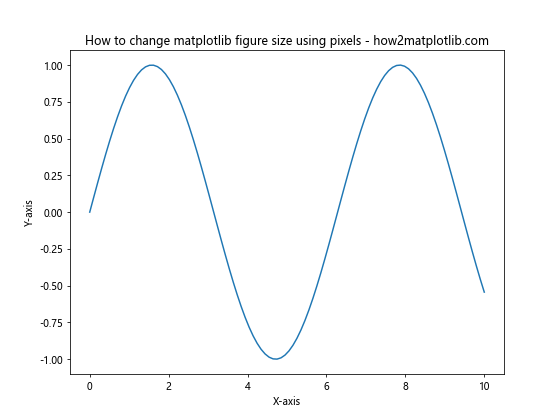
In this example, we first set the desired DPI (dots per inch). Then, we calculate the figure size in inches by dividing the desired pixel dimensions by the DPI. This approach allows you to specify the exact pixel dimensions of your plot.
Adjusting Figure Size Based on Screen Resolution
When creating plots for different screen resolutions, you might want to adjust the figure size accordingly. Here’s an example of how to change matplotlib figure size based on screen resolution:
import matplotlib.pyplot as plt
import numpy as np
import tkinter as tk

def get_screen_resolution():
    root = tk.Tk()
    screen_width = root.winfo_screenwidth()
    screen_height = root.winfo_screenheight()
    root.destroy()
    return screen_width, screen_height

# Get screen resolution
screen_width, screen_height = get_screen_resolution()

# Calculate figure size (e.g., 80% of screen width, maintaining aspect ratio)
fig_width = screen_width * 0.8 / 100  # Convert pixels to inches (assuming 100 DPI)
fig_height = fig_width * 9 / 16  # 16:9 aspect ratio

# Create a figure with the calculated size
plt.figure(figsize=(fig_width, fig_height))

# Generate some data
x = np.linspace(0, 10, 100)
y = np.cos(x)

# Plot the data
plt.plot(x, y)

# Add labels and title
plt.xlabel("X-axis")
plt.ylabel("Y-axis")
plt.title("How to change matplotlib figure size based on screen resolution - how2matplotlib.com")

# Display the plot
plt.show()
Output:
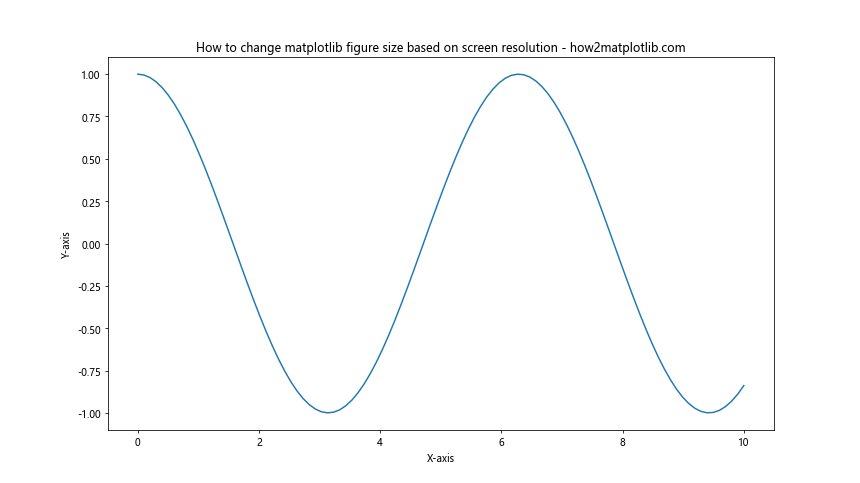
In this example, we use the tkinter library to get the screen resolution. We then calculate the figure size based on a percentage of the screen width and maintain a 16:9 aspect ratio. This approach ensures that your plots look good on different screen sizes.
Using Constrained Layout
When changing matplotlib figure size, you might encounter issues with labels or titles being cut off. Matplotlib’s constrained layout feature can help address this problem. Here’s an example:
import matplotlib.pyplot as plt
import numpy as np

# Create a figure with constrained layout
fig, ax = plt.subplots(figsize=(10, 6), constrained_layout=True)

# Generate some data
x = np.linspace(0, 10, 100)
y = np.sin(x) * np.exp(-0.1 * x)

# Plot the data
ax.plot(x, y)

# Add labels and title
ax.set_xlabel("X-axis")
ax.set_ylabel("Y-axis")
ax.set_title("How to change matplotlib figure size with constrained layout - how2matplotlib.com")

# Add a long x-axis label that might get cut off
ax.text(5, -0.8, "This is a very long label that might get cut off without constrained layout",
        ha='center', va='center', rotation=0, wrap=True)

# Display the plot
plt.show()
Output:
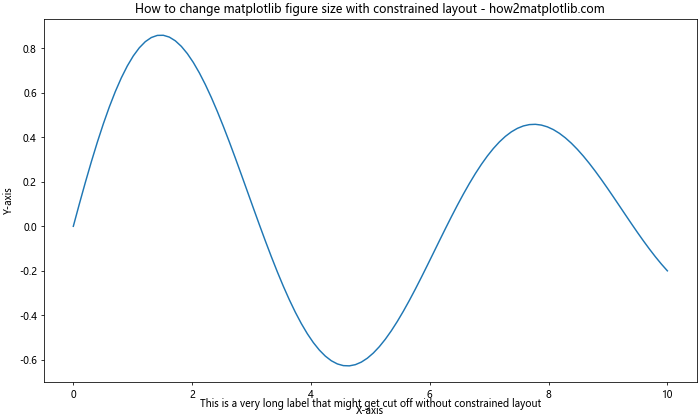
In this example, we use constrained_layout=True when creating the figure. This ensures that all elements of the plot, including labels and titles, are properly accommodated within the figure size.
Best Practices for Changing Matplotlib Figure Size
When learning how to change matplotlib figure size, it’s important to keep some best practices in mind:
- Consider the content: The ideal figure size depends on the type of plot and the amount of data you’re visualizing. Complex plots with many elements may require larger sizes.
Maintain aspect ratio: For certain types of plots (e.g., scatter plots), maintaining a square aspect ratio can be important for accurate visual interpretation.
Think about the output medium: Consider where your plot will be displayed or published. A figure size that looks good on a computer screen might not be suitable for a printed document.
Use relative units: When possible, use relative units (e.g., percentages of screen size) rather than fixed sizes to ensure your plots look good on different devices.
Test different sizes: Don’t be afraid to experiment with different figure sizes to find what works best for your specific visualization.
Be consistent: If you’re creating multiple plots for the same project or publication, try to maintain consistent figure sizes for a cohesive look.
Use tight layout: Utilize
plt.tight_layout()orconstrained_layout=Trueto ensure all elements of your plot fit within the figure boundaries.
Troubleshooting Common Issues
When learning how to change matplotlib figure size, you might encounter some common issues. Here are some problems and their solutions: