How to Mark Different Color Points on Matplotlib
Mark different color points on matplotlib is a powerful technique for visualizing data in Python. This article will explore various methods and techniques to effectively mark different color points on matplotlib plots. We’ll cover everything from basic concepts to advanced customization options, providing you with a thorough understanding of how to create visually appealing and informative plots using matplotlib.
Introduction to Marking Different Color Points on Matplotlib
Matplotlib is a widely-used plotting library in Python that allows users to create a variety of static, animated, and interactive visualizations. One of the most common tasks when working with matplotlib is to mark different color points on plots. This technique is particularly useful when you want to distinguish between different categories of data or highlight specific points of interest in your visualization.
To begin our journey into marking different color points on matplotlib, let’s start with a simple example:
import matplotlib.pyplot as plt
import numpy as np

# Generate random data
np.random.seed(42)
x = np.random.rand(50)
y = np.random.rand(50)

# Create a scatter plot with different color points
plt.figure(figsize=(8, 6))
plt.scatter(x, y, c=np.random.rand(50), cmap='viridis')
plt.title('Scatter Plot with Different Color Points - how2matplotlib.com')
plt.xlabel('X-axis')
plt.ylabel('Y-axis')
plt.colorbar(label='Random Values')
plt.show()
Output:
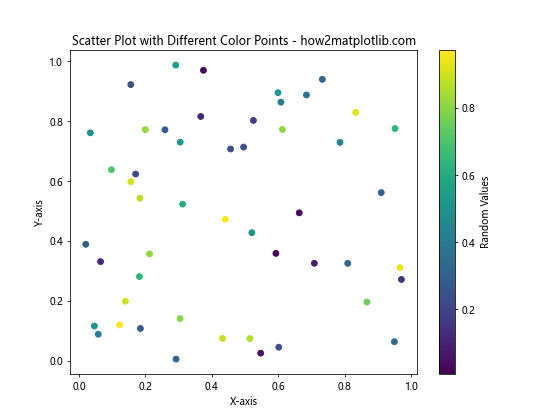
In this example, we use the scatter() function to create a plot with different color points. The c parameter is set to random values, which are then mapped to colors using the ‘viridis’ colormap. This creates a visually appealing plot with points of varying colors.
Understanding Color Mapping in Matplotlib
When marking different color points on matplotlib, it’s essential to understand how color mapping works. Matplotlib provides various colormaps that can be used to assign colors to data points based on their values. Let’s explore this concept further with another example:
import matplotlib.pyplot as plt
import numpy as np

# Generate data
x = np.linspace(0, 10, 100)
y = np.sin(x)

# Create a scatter plot with color mapping based on y values
plt.figure(figsize=(10, 6))
scatter = plt.scatter(x, y, c=y, cmap='coolwarm', s=50)
plt.title('Sine Wave with Color Mapping - how2matplotlib.com')
plt.xlabel('X-axis')
plt.ylabel('Y-axis')
plt.colorbar(scatter, label='Y values')
plt.show()
Output:
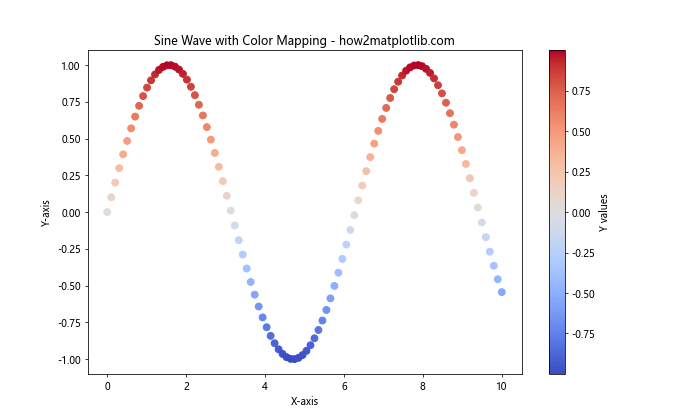
In this example, we create a scatter plot of a sine wave, where the color of each point is determined by its y-value. The ‘coolwarm’ colormap is used to map the y-values to colors, with blue representing lower values and red representing higher values.
Customizing Point Colors and Sizes
Marking different color points on matplotlib often involves customizing both the colors and sizes of the points. Let’s explore how to achieve this with a more complex example:
import matplotlib.pyplot as plt
import numpy as np

# Generate random data
np.random.seed(42)
x = np.random.rand(100)
y = np.random.rand(100)
colors = np.random.rand(100)
sizes = 1000 * np.random.rand(100)

# Create a scatter plot with custom colors and sizes
plt.figure(figsize=(10, 8))
scatter = plt.scatter(x, y, c=colors, s=sizes, alpha=0.6, cmap='viridis')
plt.title('Custom Color and Size Points - how2matplotlib.com')
plt.xlabel('X-axis')
plt.ylabel('Y-axis')
plt.colorbar(scatter, label='Color Values')
plt.show()
Output:
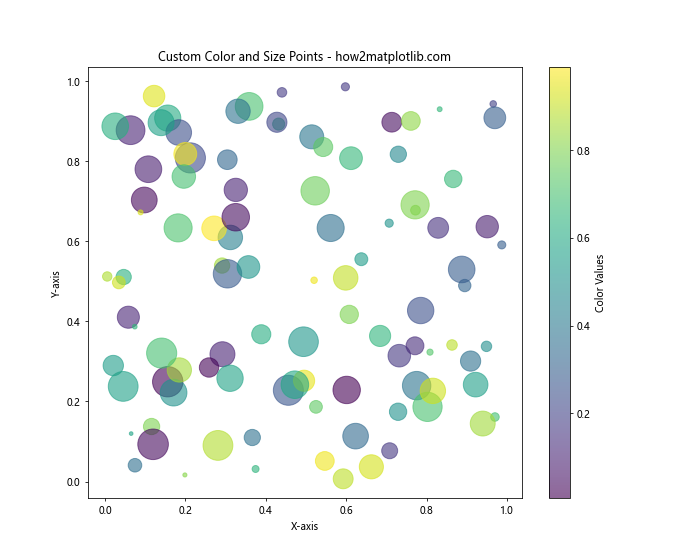
In this example, we create a scatter plot where both the color and size of each point are determined by random values. The alpha parameter is used to set the transparency of the points, allowing overlapping points to be visible.
Using Categorical Colors for Different Point Groups
When working with categorical data, it’s often useful to mark different color points on matplotlib based on these categories. Let’s see how to achieve this:
import matplotlib.pyplot as plt
import numpy as np

# Generate random data for three categories
np.random.seed(42)
categories = ['A', 'B', 'C']
colors = ['red', 'green', 'blue']
data = {cat: (np.random.rand(20), np.random.rand(20)) for cat in categories}

# Create a scatter plot with different colors for each category
plt.figure(figsize=(10, 8))
for cat, color in zip(categories, colors):
    x, y = data[cat]
    plt.scatter(x, y, c=color, label=cat, alpha=0.7)

plt.title('Categorical Color Points - how2matplotlib.com')
plt.xlabel('X-axis')
plt.ylabel('Y-axis')
plt.legend()
plt.show()
Output:
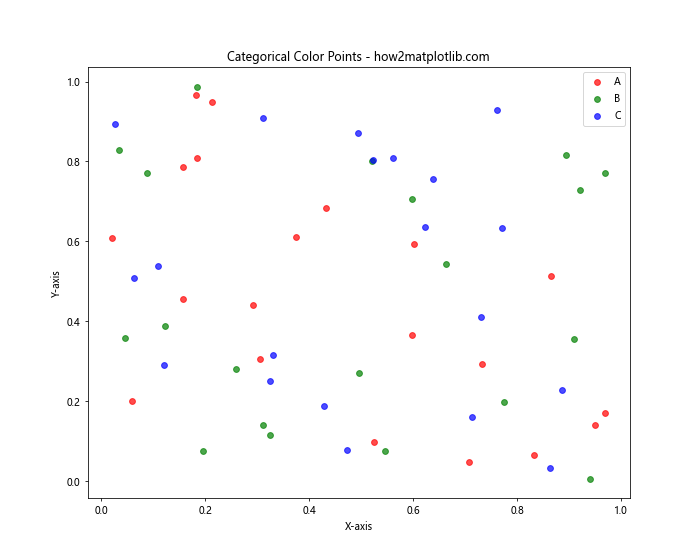
This example demonstrates how to create a scatter plot with different colors for each category of data. We use a dictionary to store the data for each category and then iterate through the categories to plot the points with their respective colors.
Creating a Custom Colormap for Marking Different Color Points
Sometimes, the built-in colormaps in matplotlib may not suit your specific needs. In such cases, you can create a custom colormap to mark different color points on matplotlib. Here’s an example of how to do this:
import matplotlib.pyplot as plt
import numpy as np
from matplotlib.colors import LinearSegmentedColormap

# Generate random data
np.random.seed(42)
x = np.random.rand(100)
y = np.random.rand(100)
z = np.random.rand(100)

# Create a custom colormap
colors = ['darkred', 'red', 'orange', 'yellow', 'green', 'blue', 'purple']
n_bins = len(colors)
cmap = LinearSegmentedColormap.from_list('custom_cmap', colors, N=n_bins)

# Create a scatter plot with the custom colormap
plt.figure(figsize=(10, 8))
scatter = plt.scatter(x, y, c=z, cmap=cmap, s=100)
plt.title('Custom Colormap for Different Color Points - how2matplotlib.com')
plt.xlabel('X-axis')
plt.ylabel('Y-axis')
plt.colorbar(scatter, label='Custom Color Values')
plt.show()
Output:
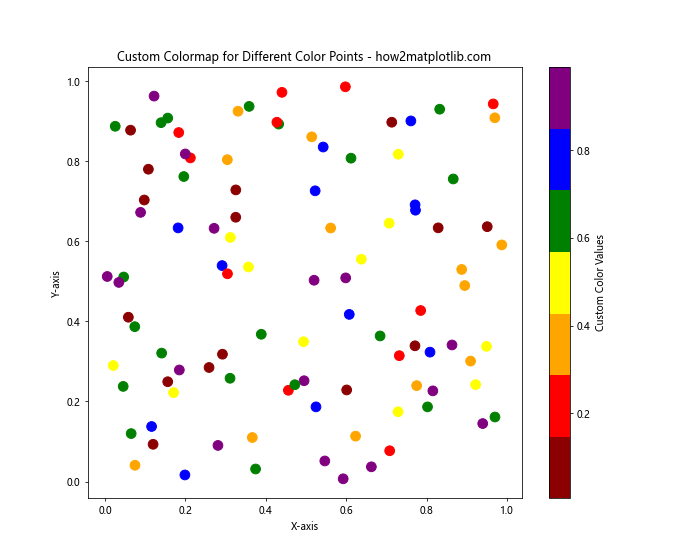
In this example, we create a custom colormap using LinearSegmentedColormap.from_list(). This allows us to define our own color sequence and use it to mark different color points on the plot.
Using Color Gradients for Continuous Data
When working with continuous data, it’s often useful to use color gradients to represent the range of values. Let’s explore how to mark different color points on matplotlib using a color gradient:
import matplotlib.pyplot as plt
import numpy as np

# Generate data
x = np.linspace(0, 10, 100)
y = np.sin(x)
z = np.cos(x)

# Create a scatter plot with color gradient
plt.figure(figsize=(12, 8))
scatter = plt.scatter(x, y, c=z, cmap='plasma', s=50)
plt.title('Color Gradient for Continuous Data - how2matplotlib.com')
plt.xlabel('X-axis')
plt.ylabel('Y-axis')
plt.colorbar(scatter, label='Cosine Values')
plt.show()
Output:
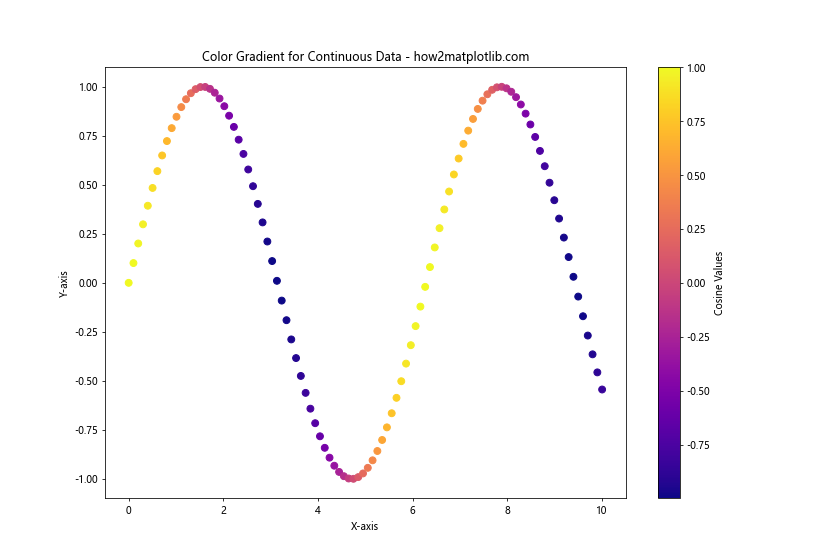
In this example, we use the cosine values (z) to determine the color of each point in the scatter plot of a sine wave. The ‘plasma’ colormap provides a smooth color gradient that effectively represents the range of cosine values.
Combining Multiple Plots with Different Color Points
Often, you may want to combine multiple plots with different color points to compare or contrast different datasets. Here’s an example of how to achieve this:
import matplotlib.pyplot as plt
import numpy as np

# Generate data for two datasets
np.random.seed(42)
x1 = np.random.rand(50)
y1 = np.random.rand(50)
x2 = np.random.rand(50) + 0.5
y2 = np.random.rand(50) + 0.5

# Create a figure with two subplots
fig, (ax1, ax2) = plt.subplots(1, 2, figsize=(16, 6))

# Plot the first dataset
scatter1 = ax1.scatter(x1, y1, c=y1, cmap='viridis', s=100)
ax1.set_title('Dataset 1 - how2matplotlib.com')
ax1.set_xlabel('X-axis')
ax1.set_ylabel('Y-axis')
fig.colorbar(scatter1, ax=ax1, label='Y values')

# Plot the second dataset
scatter2 = ax2.scatter(x2, y2, c=x2, cmap='plasma', s=100)
ax2.set_title('Dataset 2 - how2matplotlib.com')
ax2.set_xlabel('X-axis')
ax2.set_ylabel('Y-axis')
fig.colorbar(scatter2, ax=ax2, label='X values')

plt.tight_layout()
plt.show()
Output:
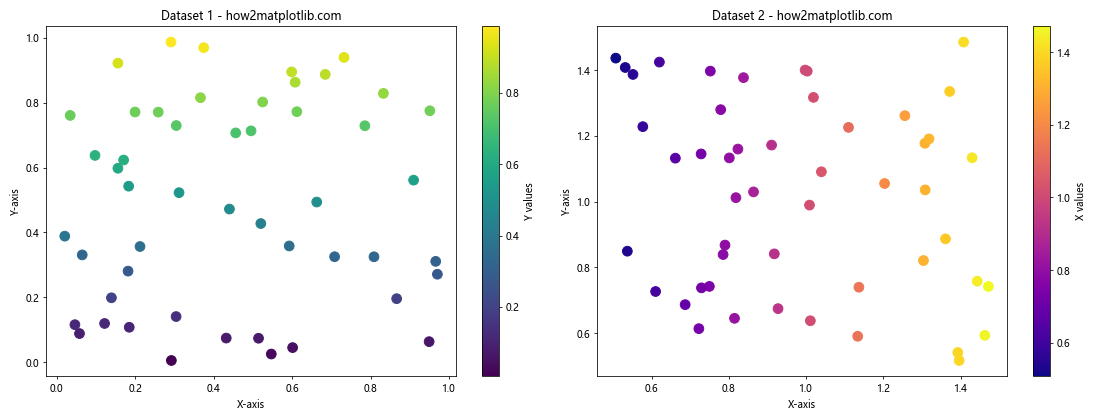
This example demonstrates how to create two subplots, each with its own scatter plot and color scheme. This allows for easy comparison between different datasets or visualization techniques.
Using Markers to Enhance Different Color Points
In addition to colors, markers can be used to further distinguish between different points on a plot. Let’s explore how to combine markers with different color points:
import matplotlib.pyplot as plt
import numpy as np

# Generate random data
np.random.seed(42)
x = np.random.rand(50)
y = np.random.rand(50)
colors = np.random.rand(50)
sizes = 1000 * np.random.rand(50)

# Define marker styles
markers = ['o', 's', '^', 'D', 'v']

# Create a scatter plot with different markers and colors
plt.figure(figsize=(10, 8))
for i in range(5):
    mask = (colors >= i/5) & (colors < (i+1)/5)
    plt.scatter(x[mask], y[mask], c=colors[mask], s=sizes[mask],
                marker=markers[i], alpha=0.7, cmap='viridis')

plt.title('Different Markers and Colors - how2matplotlib.com')
plt.xlabel('X-axis')
plt.ylabel('Y-axis')
plt.colorbar(label='Color Values')
plt.show()
Output:
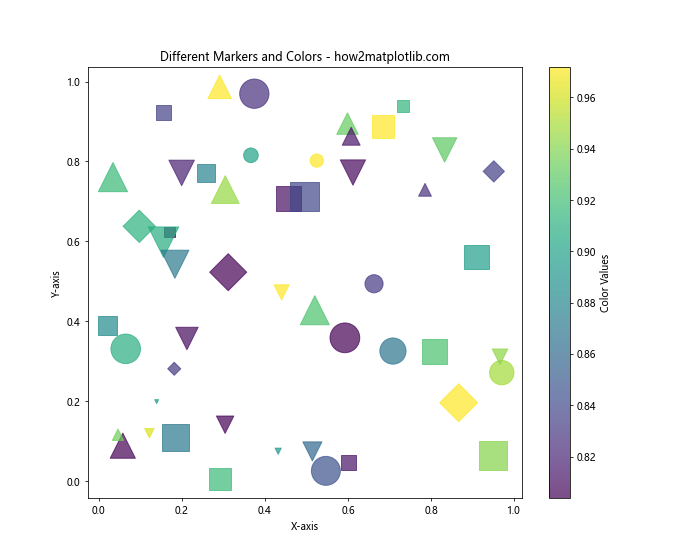
In this example, we use different marker styles for different ranges of color values. This adds an extra dimension to the visualization, allowing for more complex data representation.
Creating a 3D Scatter Plot with Different Color Points
Matplotlib also supports 3D plotting, which can be useful for visualizing three-dimensional data with different color points. Here's an example:
import matplotlib.pyplot as plt
import numpy as np
from mpl_toolkits.mplot3d import Axes3D

# Generate random 3D data
np.random.seed(42)
x = np.random.rand(100)
y = np.random.rand(100)
z = np.random.rand(100)
colors = np.random.rand(100)

# Create a 3D scatter plot
fig = plt.figure(figsize=(10, 8))
ax = fig.add_subplot(111, projection='3d')
scatter = ax.scatter(x, y, z, c=colors, cmap='viridis', s=50)

ax.set_title('3D Scatter Plot with Different Color Points - how2matplotlib.com')
ax.set_xlabel('X-axis')
ax.set_ylabel('Y-axis')
ax.set_zlabel('Z-axis')
fig.colorbar(scatter, label='Color Values')
plt.show()
Output:
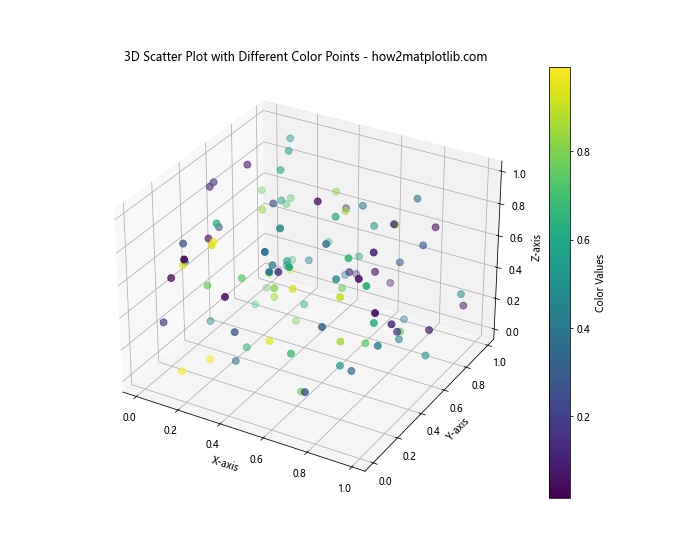
This example demonstrates how to create a 3D scatter plot with points colored based on a fourth dimension of data. This can be particularly useful for visualizing complex, multi-dimensional datasets.
Using Color Points to Represent Time Series Data
When working with time series data, marking different color points on matplotlib can help visualize changes over time. Here's an example of how to achieve this:
import matplotlib.pyplot as plt
import numpy as np
import pandas as pd

# Generate time series data
dates = pd.date_range(start='2023-01-01', end='2023-12-31', freq='D')
values = np.cumsum(np.random.randn(len(dates)))

# Create a scatter plot with color representing time
plt.figure(figsize=(12, 6))
scatter = plt.scatter(dates, values, c=range(len(dates)), cmap='viridis', s=30)
plt.title('Time Series Data with Color Points - how2matplotlib.com')
plt.xlabel('Date')
plt.ylabel('Value')
plt.colorbar(scatter, label='Days since start')
plt.xticks(rotation=45)
plt.tight_layout()
plt.show()
Output:
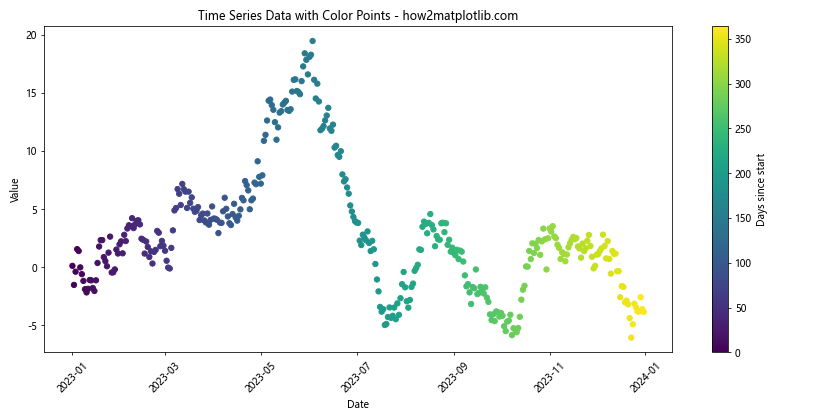
In this example, we use a color gradient to represent the progression of time in a scatter plot of time series data. This allows us to easily visualize trends and patterns over time.
Handling Large Datasets with Different Color Points
When dealing with large datasets, it's important to consider performance and visual clarity when marking different color points on matplotlib. Here's an example of how to handle a large dataset efficiently:
import matplotlib.pyplot as plt
import numpy as np

# Generate a large dataset
np.random.seed(42)
n_points = 100000
x = np.random.randn(n_points)
y = np.random.randn(n_points)
colors = np.random.rand(n_points)

# Create a scatter plot with alpha blending and downsampling
plt.figure(figsize=(10, 8))
plt.hexbin(x, y, C=colors, gridsize=50, cmap='viridis')
plt.title('Large Dataset with Different Color Points - how2matplotlib.com')
plt.xlabel('X-axis')
plt.ylabel('Y-axis')
plt.colorbar(label='Density')
plt.show()
Output:
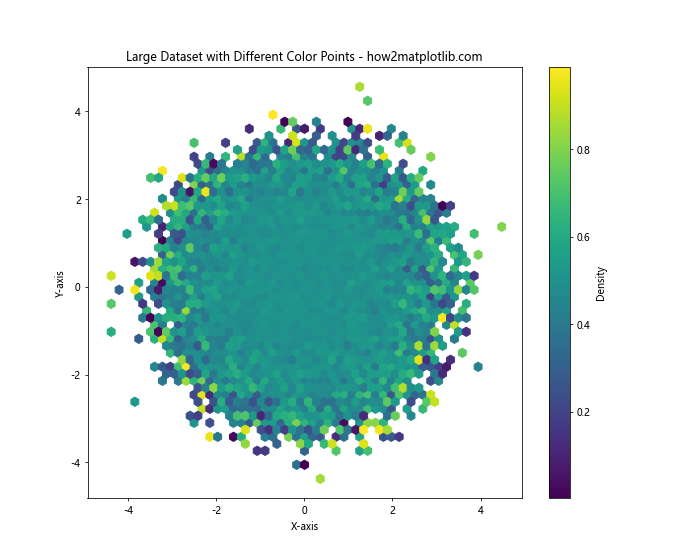
In this example, we use the hexbin() function instead of scatter() to efficiently plot a large number of points. This method creates a hexagonal binning of the data, which is both computationally efficient and visually effective for large datasets.
Creating a Bubble Chart with Different Color Points
A bubble chart is a variation of a scatter plot where the size of each point represents an additional dimension of data. Let's see how to create a bubble chart with different color points:
import matplotlib.pyplot as plt
import numpy as np

# Generate random data
np.random.seed(42)
x = np.random.rand(50)
y = np.random.rand(50)
sizes = 1000 * np.random.rand(50)
colors = np.random.rand(50)

# Create a bubble chart
plt.figure(figsize=(10, 8))
scatter = plt.scatter(x, y, s=sizes, c=colors, alpha=0.6, cmap='viridis')
plt.title('Bubble Chart with Different Color Points - how2matplotlib.com')
plt.xlabel('X-axis')
plt.ylabel('Y-axis')
plt.colorbar(scatter, label='Color Values')

# Add a size legend
handles, labels = scatter.legend_elements(prop="sizes", alpha=0.6,
                                          num=4, func=lambda s: s/1000)
legend = plt.legend(handles, labels, loc="upper right", title="Sizes")
plt.gca().add_artist(legend)

plt.show()
Output:
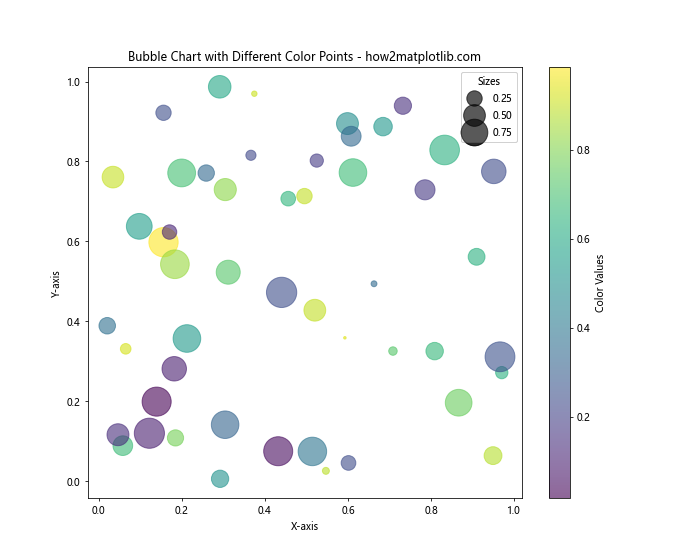
This example demonstrates how to create a bubble chart where the size and color of each point represent different dimensions of the data. We also add a size legend to help interpret the bubble sizes.
Using Different Color Points in Heatmaps
Heatmaps are another way to visualize data using color, where each cell in a grid is colored based on its value. Let's see how to create a heatmap with different color points:
import matplotlib.pyplot as plt
import numpy as np

# Generate random data
np.random.seed(42)
data = np.random.rand(10, 10)

# Create a heatmap
plt.figure(figsize=(10, 8))
heatmap = plt.imshow(data, cmap='YlOrRd')
plt.title('Heatmap with Different Color Points - how2matplotlib.com')
plt.xlabel('X-axis')
plt.ylabel('Y-axis')
plt.colorbar(heatmap, label='Values')

# Add text annotations
for i in range(10):
    for j in range(10):
        plt.text(j, i, f'{data[i, j]:.2f}',
                 ha='center', va='center', color='black')

plt.show()
Output:
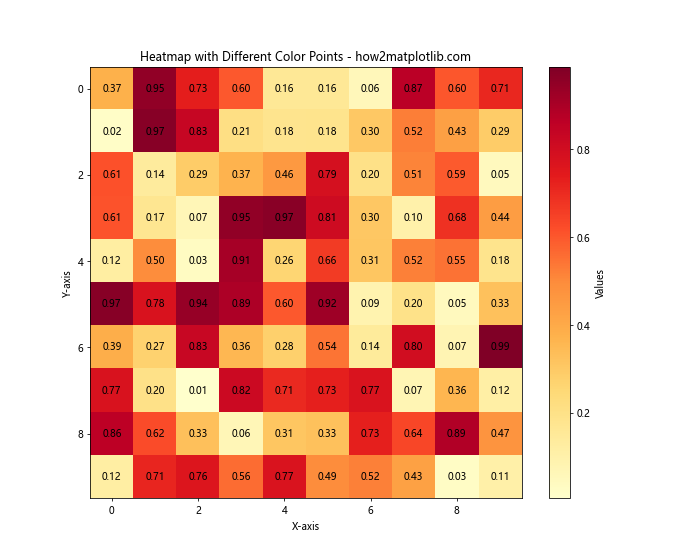
In this example, we create a heatmap using the imshow() function, which displays the data as a color-encoded image. We also add text annotations to show the exact values in each cell.
Combining Line Plots with Different Color Points
Sometimes, it's useful to combine line plots with scatter plots to show both trends and individual data points. Here's an example of how to achieve this:
import matplotlib.pyplot as plt
import numpy as np

# Generate data
x = np.linspace(0, 10, 100)
y1 = np.sin(x)
y2 = np.cos(x)

# Create a figure with two y-axes
fig, ax1 = plt.subplots(figsize=(12, 6))
ax2 = ax1.twinx()

# Plot the sine wave as a line
line1, = ax1.plot(x, y1, 'b-', label='Sine')
ax1.set_xlabel('X-axis')
ax1.set_ylabel('Sine', color='b')
ax1.tick_params(axis='y', labelcolor='b')

# Plot the cosine wave as scatter points
scatter = ax2.scatter(x, y2, c=y2, cmap='viridis', label='Cosine')
ax2.set_ylabel('Cosine', color='g')
ax2.tick_params(axis='y', labelcolor='g')

plt.title('Line Plot with Different Color Points - how2matplotlib.com')
fig.colorbar(scatter, ax=ax2, label='Cosine Values')

# Add a legend
lines = [line1, scatter]
labels = [l.get_label() for l in lines]
ax1.legend(lines, labels, loc='upper right')

plt.show()
Output:
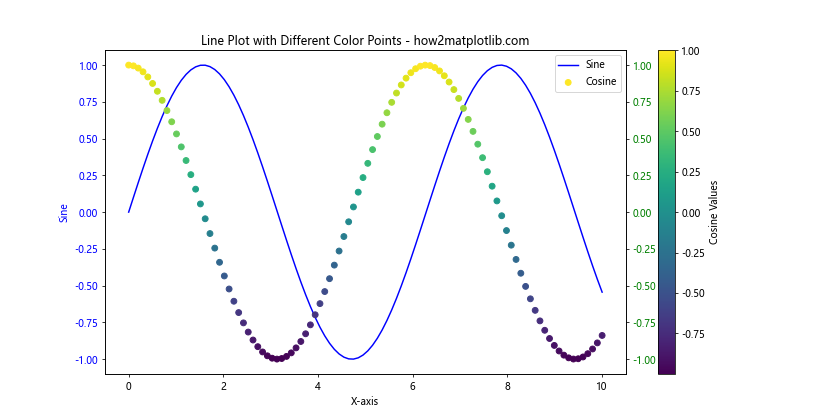
This example demonstrates how to create a plot with two y-axes, combining a line plot of a sine wave with a scatter plot of a cosine wave. The scatter points are colored based on their y-values.
Using Different Color Points in Polar Plots
Polar plots are useful for visualizing cyclical data or directional information. Let's see how to mark different color points on a polar plot:
import matplotlib.pyplot as plt
import numpy as np

# Generate data
theta = np.linspace(0, 2*np.pi, 100)
r = 1 + np.sin(4*theta)
colors = theta

# Create a polar plot
plt.figure(figsize=(10, 8))
ax = plt.subplot(111, projection='polar')
scatter = ax.scatter(theta, r, c=colors, cmap='hsv', s=50)
ax.set_title('Polar Plot with Different Color Points - how2matplotlib.com')
plt.colorbar(scatter, label='Angle')
plt.show()
Output:
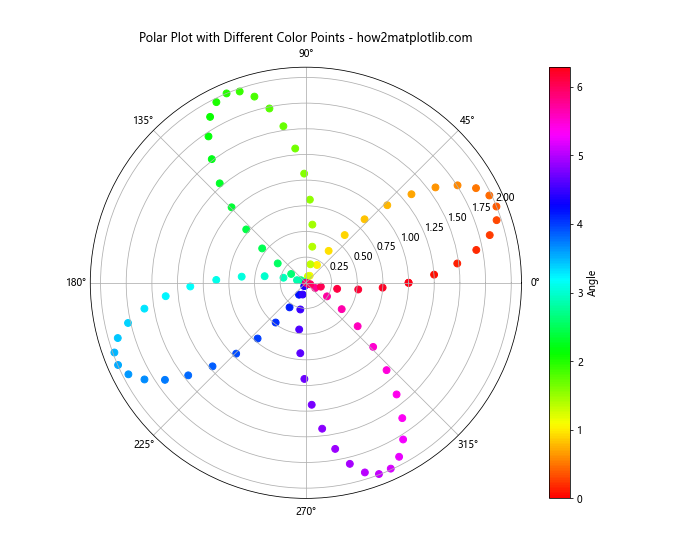
In this example, we create a polar plot where the color of each point represents its angle. This can be particularly useful for visualizing directional or cyclical data.
Creating a Violin Plot with Different Color Points
Violin plots are a way of visualizing the distribution of data across different categories. Let's see how to create a violin plot with different color points:
import matplotlib.pyplot as plt
import numpy as np

# Generate random data for four categories
np.random.seed(42)
data = [np.random.normal(0, std, 100) for std in range(1, 5)]

# Create a violin plot
plt.figure(figsize=(12, 6))
parts = plt.violinplot(data, showmeans=False, showmedians=False)

# Customize colors for each violin
colors = ['#FFA07A', '#98FB98', '#87CEFA', '#DDA0DD']
for pc, color in zip(parts['bodies'], colors):
    pc.set_facecolor(color)
    pc.set_edgecolor('black')
    pc.set_alpha(0.7)

# Add scatter points on top of violins
for i, d in enumerate(data):
    plt.scatter(np.repeat(i+1, len(d)), d, c=colors[i], alpha=0.7)

plt.title('Violin Plot with Different Color Points - how2matplotlib.com')
plt.xlabel('Categories')
plt.ylabel('Values')
plt.xticks(range(1, 5), ['A', 'B', 'C', 'D'])
plt.show()
Output:
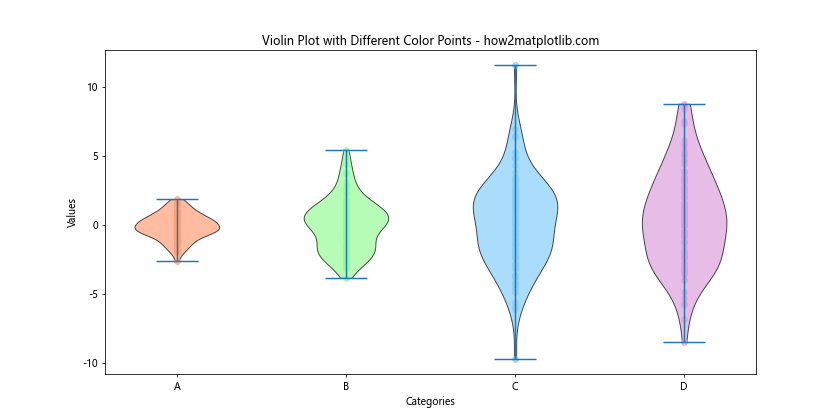
This example demonstrates how to create a violin plot with different colors for each category, and then overlay scatter points on top of the violins to show individual data points.
Conclusion
Marking different color points on matplotlib is a powerful technique for visualizing complex data and highlighting important patterns or trends. Throughout this article, we've explored various methods and techniques for creating visually appealing and informative plots using different color points.
We've covered a wide range of topics, including:
- Basic scatter plots with color mapping
- Customizing point colors and sizes
- Using categorical colors for different groups
- Creating custom colormaps
- Using color gradients for continuous data
- Combining multiple plots with different color points
- Enhancing plots with markers
- Creating 3D scatter plots
- Visualizing time series data with color points
- Handling large datasets efficiently
- Creating bubble charts
- Using color points in heatmaps
- Combining line plots with scatter plots
- Using color points in polar plots
- Creating violin plots with color points