How to Change the Size of Figures Drawn with Matplotlib
How do I change the size of figures drawn with Matplotlib? This is a common question among data visualization enthusiasts and professionals alike. Matplotlib is a powerful plotting library for Python that allows users to create a wide variety of static, animated, and interactive visualizations. One of the fundamental aspects of creating visually appealing and effective plots is controlling the size of the figures. In this comprehensive guide, we’ll explore various methods and techniques to change the size of figures drawn with Matplotlib, providing you with the knowledge and tools to customize your visualizations to perfection.
Understanding Figure Size in Matplotlib
Before we dive into the specifics of how to change the size of figures drawn with Matplotlib, it’s essential to understand what figure size means in the context of this library. In Matplotlib, a figure is the top-level container for all plot elements. The size of a figure determines the overall dimensions of the plotting area, including axes, titles, and other components.
By default, Matplotlib creates figures with a size of 6.4 inches in width and 4.8 inches in height. However, these dimensions may not always be suitable for your specific visualization needs. Fortunately, Matplotlib provides several ways to customize the size of figures, allowing you to create plots that fit your requirements perfectly.
Let’s start with a basic example to illustrate how to change the size of figures drawn with Matplotlib:
import matplotlib.pyplot as plt

# Create a figure with custom size
plt.figure(figsize=(10, 6))

# Plot some data
x = [1, 2, 3, 4, 5]
y = [2, 4, 6, 8, 10]
plt.plot(x, y)

# Add labels and title
plt.xlabel('X-axis (how2matplotlib.com)')
plt.ylabel('Y-axis (how2matplotlib.com)')
plt.title('How to Change Figure Size in Matplotlib (how2matplotlib.com)')

# Display the plot
plt.show()
Output:
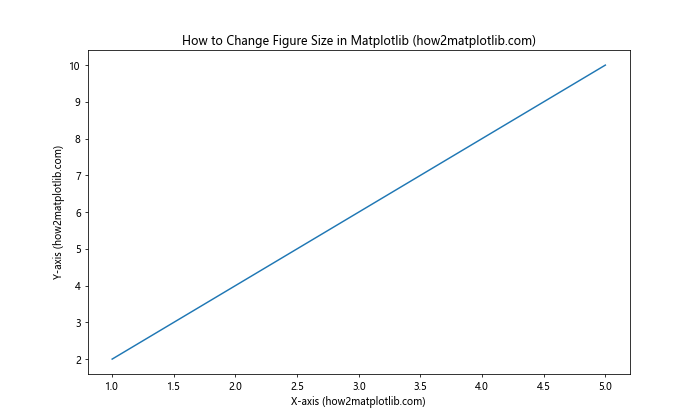
In this example, we use the figsize parameter of the plt.figure() function to specify a custom size for our figure. The figsize tuple (10, 6) sets the width to 10 inches and the height to 6 inches. This simple adjustment allows us to create a larger figure than the default size.
Methods to Change Figure Size in Matplotlib
Now that we have a basic understanding of how to change the size of figures drawn with Matplotlib, let’s explore various methods and techniques in more detail. We’ll cover different approaches to suit various use cases and preferences.
1. Using plt.figure()
The plt.figure() function is one of the most straightforward ways to change the size of figures drawn with Matplotlib. This method is particularly useful when you’re creating a new figure and want to set its size from the beginning.
Here’s an example demonstrating how to use plt.figure() to create figures of different sizes:
import matplotlib.pyplot as plt
import numpy as np

# Create figures with different sizes
fig1 = plt.figure(figsize=(8, 4))
fig2 = plt.figure(figsize=(12, 6))

# Generate some data
x = np.linspace(0, 10, 100)
y1 = np.sin(x)
y2 = np.cos(x)

# Plot data on the first figure
plt.figure(fig1.number)
plt.plot(x, y1)
plt.title('Sine Wave (how2matplotlib.com)')

# Plot data on the second figure
plt.figure(fig2.number)
plt.plot(x, y2)
plt.title('Cosine Wave (how2matplotlib.com)')

# Display the plots
plt.show()
Output:
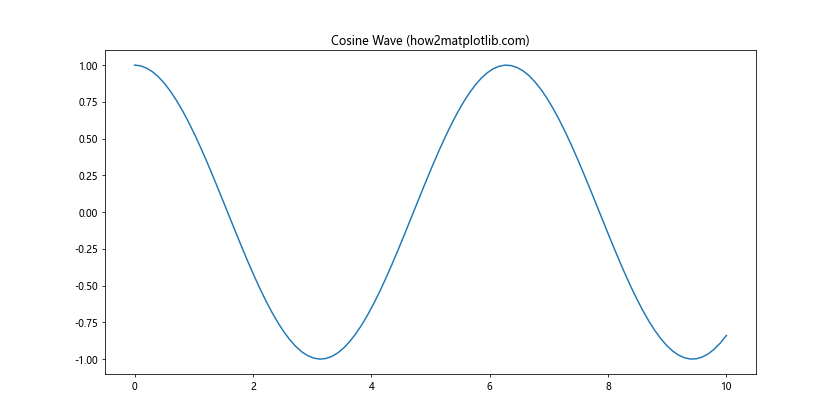
In this example, we create two figures with different sizes using plt.figure(). The first figure has dimensions of 8×4 inches, while the second figure is 12×6 inches. We then plot different data on each figure to demonstrate how the size affects the overall appearance of the plots.
2. Using plt.subplots()
Another common method to change the size of figures drawn with Matplotlib is by using the plt.subplots() function. This function is particularly useful when you want to create a figure with one or more subplots and set the overall figure size at the same time.
Here’s an example illustrating how to use plt.subplots() to create a figure with multiple subplots and a custom size:
import matplotlib.pyplot as plt
import numpy as np

# Create a figure with subplots and custom size
fig, (ax1, ax2) = plt.subplots(2, 1, figsize=(10, 8))

# Generate some data
x = np.linspace(0, 10, 100)
y1 = np.sin(x)
y2 = np.cos(x)

# Plot data on the first subplot
ax1.plot(x, y1)
ax1.set_title('Sine Wave (how2matplotlib.com)')

# Plot data on the second subplot
ax2.plot(x, y2)
ax2.set_title('Cosine Wave (how2matplotlib.com)')

# Adjust spacing between subplots
plt.tight_layout()

# Display the plot
plt.show()
Output:
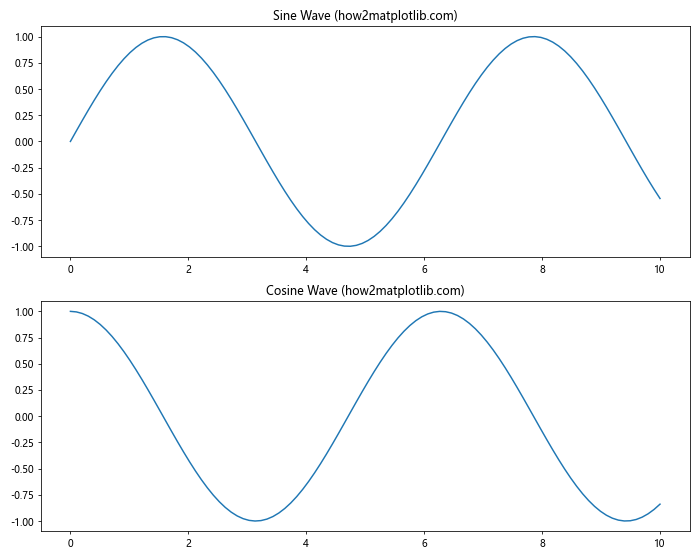
In this example, we use plt.subplots() to create a figure with two subplots arranged vertically. The figsize parameter is set to (10, 8), creating a figure that is 10 inches wide and 8 inches tall. This approach allows us to control the overall figure size while working with multiple subplots.
3. Changing Figure Size After Creation
Sometimes, you may need to change the size of a figure after it has been created. Matplotlib provides methods to accomplish this task as well. Let’s look at an example of how to change the size of an existing figure:
import matplotlib.pyplot as plt
import numpy as np

# Create a figure with default size
fig = plt.figure()

# Generate some data
x = np.linspace(0, 10, 100)
y = np.sin(x)

# Plot the data
plt.plot(x, y)
plt.title('Original Figure Size (how2matplotlib.com)')

# Display the original figure
plt.show()

# Change the figure size
fig.set_size_inches(12, 6)

# Update the plot
plt.title('Updated Figure Size (how2matplotlib.com)')

# Display the updated figure
plt.show()
In this example, we first create a figure with the default size and plot some data. After displaying the original figure, we use the set_size_inches() method to change the figure size to 12×6 inches. We then update the plot title and display the resized figure.
4. Using rcParams to Set Default Figure Size
If you find yourself frequently changing the size of figures drawn with Matplotlib to the same dimensions, you might want to consider setting a new default figure size. This can be achieved by modifying the rcParams dictionary, which controls the default behavior of Matplotlib.
Here’s an example of how to change the default figure size using rcParams:
import matplotlib.pyplot as plt
import numpy as np

# Set the default figure size
plt.rcParams['figure.figsize'] = [10, 6]

# Create a figure (it will use the new default size)
plt.figure()

# Generate some data
x = np.linspace(0, 10, 100)
y = np.sin(x)

# Plot the data
plt.plot(x, y)
plt.title('Figure with New Default Size (how2matplotlib.com)')

# Display the plot
plt.show()
Output:
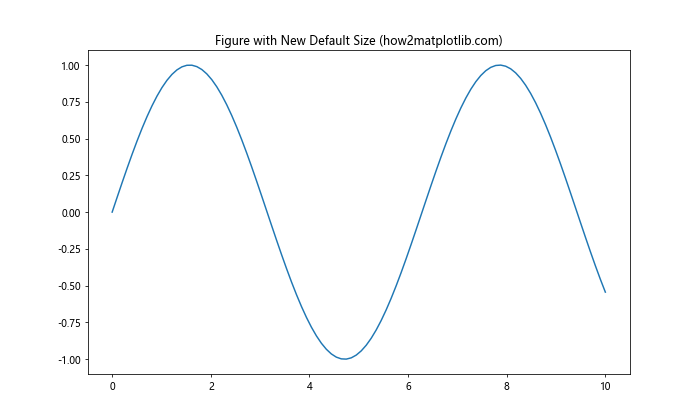
In this example, we set the default figure size to 10×6 inches by modifying the 'figure.figsize' parameter in rcParams. After this change, any new figure created without explicitly specifying a size will use these dimensions.
Advanced Techniques for Changing Figure Size
Now that we’ve covered the basic methods to change the size of figures drawn with Matplotlib, let’s explore some more advanced techniques that can give you even greater control over your visualizations.
5. Adjusting Figure Size Based on Screen DPI
When working with different display resolutions, you might want to adjust the figure size based on the screen’s dots per inch (DPI). This can help ensure that your plots appear at a consistent physical size across different devices. Here’s an example of how to achieve this:
import matplotlib.pyplot as plt
import numpy as np

def create_figure_with_physical_size(width_cm, height_cm):
    # Get the screen DPI
    dpi = plt.rcParams['figure.dpi']

    # Convert cm to inches
    width_inches = width_cm / 2.54
    height_inches = height_cm / 2.54

    # Create the figure
    fig = plt.figure(figsize=(width_inches, height_inches))

    return fig

# Create a figure with a physical size of 20cm x 15cm
fig = create_figure_with_physical_size(20, 15)

# Generate some data
x = np.linspace(0, 10, 100)
y = np.sin(x)

# Plot the data
plt.plot(x, y)
plt.title('Figure with Physical Size 20cm x 15cm (how2matplotlib.com)')

# Display the plot
plt.show()
Output:
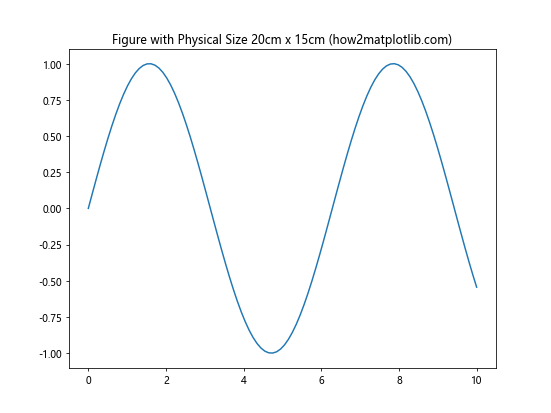
In this example, we define a function create_figure_with_physical_size() that takes the desired width and height in centimeters. It then calculates the appropriate figure size in inches based on the screen’s DPI. This approach ensures that the figure will have a consistent physical size regardless of the display resolution.
6. Dynamically Adjusting Figure Size Based on Content
In some cases, you might want to adjust the figure size based on the content of your plot. For example, you might want to ensure that all data points are visible without overcrowding. Here’s an example of how to dynamically adjust the figure size based on the number of data points:
import matplotlib.pyplot as plt
import numpy as np

def create_figure_with_dynamic_size(data):
    # Calculate the number of data points
    num_points = len(data)

    # Set a base size and adjust based on the number of points
    base_width = 6
    base_height = 4
    width = base_width + (num_points / 100)
    height = base_height + (num_points / 150)

    # Create the figure
    fig = plt.figure(figsize=(width, height))

    return fig

# Generate some data
x = np.linspace(0, 10, 200)
y = np.sin(x) + np.random.normal(0, 0.1, 200)

# Create a figure with dynamic size
fig = create_figure_with_dynamic_size(x)

# Plot the data
plt.scatter(x, y, alpha=0.5)
plt.title('Figure with Dynamic Size (how2matplotlib.com)')

# Display the plot
plt.show()
Output:
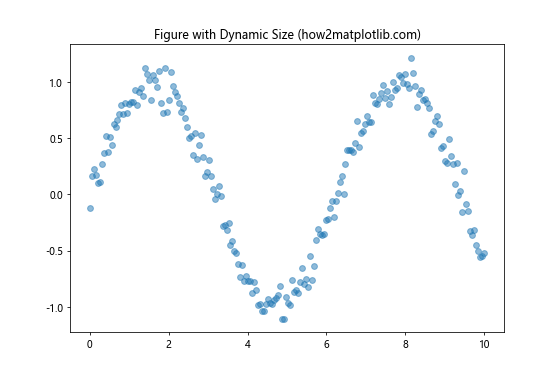
In this example, we define a function create_figure_with_dynamic_size() that adjusts the figure size based on the number of data points. As the number of points increases, the figure size grows to accommodate the additional data without becoming too cluttered.
7. Changing Figure Size for Saved Images
When saving figures as image files, you might want to specify a different size than what’s displayed on screen. Matplotlib allows you to do this easily. Here’s an example:
import matplotlib.pyplot as plt
import numpy as np

# Generate some data
x = np.linspace(0, 10, 100)
y = np.sin(x)

# Create a figure with default size
plt.figure()
plt.plot(x, y)
plt.title('Sine Wave (how2matplotlib.com)')

# Save the figure with a custom size
plt.savefig('sine_wave_large.png', dpi=300, figsize=(12, 8))

# Display the plot (this will show the original size)
plt.show()
In this example, we create a figure with the default size and plot some data. When saving the figure using plt.savefig(), we specify a custom size of 12×8 inches and a high DPI of 300. This results in a high-resolution image file with dimensions different from the displayed figure.
Best Practices for Changing Figure Size in Matplotlib
As we’ve explored various methods to change the size of figures drawn with Matplotlib, it’s important to consider some best practices to ensure your visualizations are effective and visually appealing.
8. Maintaining Aspect Ratio
When changing the size of figures, it’s often important to maintain the aspect ratio of your plots, especially for certain types of visualizations. Here’s an example of how to change the figure size while preserving the aspect ratio:
import matplotlib.pyplot as plt
import numpy as np

def create_figure_with_aspect_ratio(width, aspect_ratio):
    height = width / aspect_ratio
    fig = plt.figure(figsize=(width, height))
    return fig

# Generate some data
x = np.linspace(0, 10, 100)
y = np.sin(x)

# Create a figure with a specific width and aspect ratio
fig = create_figure_with_aspect_ratio(10, 16/9)

# Plot the data
plt.plot(x, y)
plt.title('Figure with 16:9 Aspect Ratio (how2matplotlib.com)')

# Display the plot
plt.show()
Output:
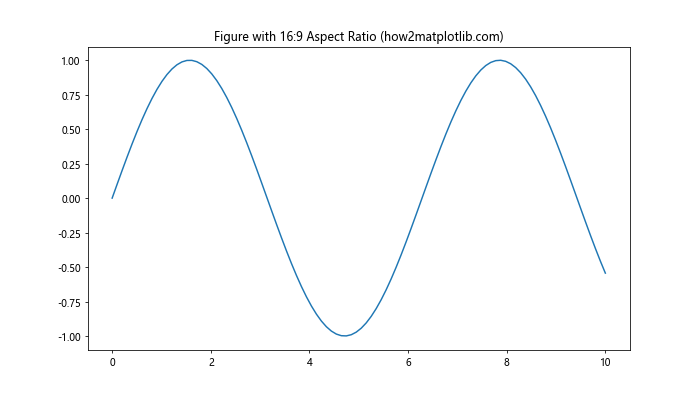
In this example, we define a function create_figure_with_aspect_ratio() that takes a desired width and aspect ratio. It then calculates the appropriate height to maintain the specified aspect ratio. This approach is particularly useful for creating figures that need to fit specific display formats or maintain visual consistency.
9. Adjusting Font Sizes for Different Figure Sizes
When changing the size of figures drawn with Matplotlib, it’s important to consider how this affects the readability of text elements such as titles, labels, and legends. Here’s an example of how to adjust font sizes based on the figure size:
import matplotlib.pyplot as plt
import numpy as np

def create_figure_with_adjusted_fonts(width, height):
    fig = plt.figure(figsize=(width, height))

    # Calculate a scaling factor based on the figure size
    scale = (width * height) / (6.4 * 4.8)  # 6.4 x 4.8 is the default figure size

    # Adjust font sizes
    plt.rcParams['font.size'] = 10 * np.sqrt(scale)
    plt.rcParams['axes.labelsize'] = 12 * np.sqrt(scale)
    plt.rcParams['axes.titlesize'] = 14 * np.sqrt(scale)

    return fig

# Generate some data
x = np.linspace(0, 10, 100)
y = np.sin(x)

# Create a figure with adjusted font sizes
fig = create_figure_with_adjusted_fonts(12, 8)

# Plot the data
plt.plot(x, y)
plt.title('Figure with Adjusted Font Sizes (how2matplotlib.com)')
plt.xlabel('X-axis (how2matplotlib.com)')
plt.ylabel('Y-axis (how2matplotlib.com)')

# Display the plot
plt.show()
Output:
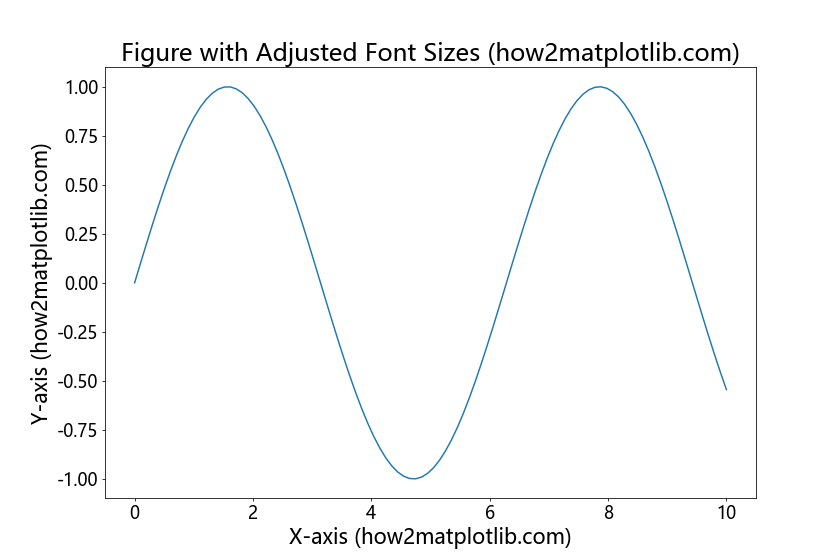
In this example, we define a function create_figure_with_adjusted_fonts() that not only creates a figure with the specified size but also adjusts the font sizes based on the figure dimensions. This ensures that text elements remain readable and proportional to the overall figure size.
10. Handling Multiple Figures with Different Sizes
When working with multiple figures in the same script, it’s important to manage their sizes effectively. Here’s an example of how to create and manage multiple figures with different sizes:
import matplotlib.pyplot as plt
import numpy as np

# Generate some data
x = np.linspace(0, 10, 100)
y1 = np.sin(x)
y2 = np.cos(x)
y3 = np.tan(x)

# Create three figures with different sizes
fig1 = plt.figure(figsize=(8, 4))
plt.plot(x, y1)
plt.title('Sine Wave (how2matplotlib.com)')

fig2 = plt.figure(figsize=(10, 5))
plt.plot(x, y2)
plt.title('Cosine Wave (how2matplotlib.com)')

fig3 = plt.figure(figsize=(12, 6))
plt.plot(x, y3)
plt.title('Tangent Wave (how2matplotlib.com)')

# Display all figures
plt.show()
Output:
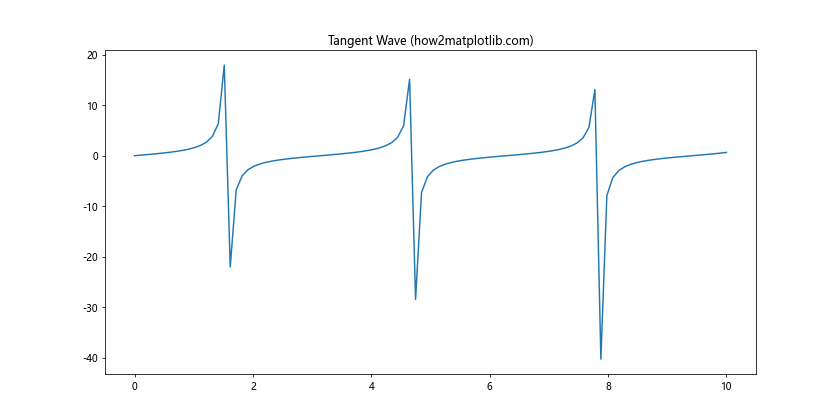
In this example, we create three separate figures with different sizes using plt.figure(). Each figure is assigned to a variable (fig1, fig2, fig3) for easy reference. We then plot different data on each figure and display them all at once using plt.show(). This approach allows you to work with multiple figures of varying sizes within the same script.
Advanced Considerations for Changing Figure Size
As we delve deeper into the topic of how to change the size of figures drawn with Matplotlib, it’s important to consider some advanced aspects that can further enhance your visualizations.
11. Responsive Figure Sizing for Web Applications
When creating visualizations for web applications, you might want to make your figures responsive to different screen sizes. While Matplotlib itself doesn’t directly support responsive sizing, you can achieve this effect by generating multiple versions of your plot at different sizes. Here’s an example of how you might approach this:
import matplotlib.pyplot as plt
import numpy as np
import io
import base64

def create_responsive_plot(x, y, sizes):
    plots = []
    for size in sizes:
        plt.figure(figsize=size)
        plt.plot(x, y)
        plt.title(f'Responsive Plot (how2matplotlib.com) - Size: {size[0]}x{size[1]}')

        # Save the plot to a bytes buffer
        buf = io.BytesIO()
        plt.savefig(buf, format='png')
        buf.seek(0)

        # Encode the image to base64
        plot_data = base64.b64encode(buf.getvalue()).decode('utf-8')
        plots.append(plot_data)

        plt.close()

    return plots

# Generate some data
x = np.linspace(0, 10, 100)
y = np.sin(x)

# Create responsive plots for different sizes
sizes = [(6, 4), (8, 6), (10, 8)]
responsive_plots = create_responsive_plot(x, y, sizes)

# In a web application, you would serve these plots and use CSS/JavaScript to display the appropriate size
for i, plot_data in enumerate(responsive_plots):
    print(f"Plot {i+1} data: {plot_data[:50]}...")  # Print first 50 characters of each plot's base64 data
In this example, we create a function create_responsive_plot() that generates multiple versions of the same plot at different sizes. The plots are saved as base64-encoded strings, which can be easily embedded in HTML. In a real web application, you would use CSS and JavaScript to display the appropriate size based on the user’s screen size.
12. Adjusting Figure Size for Publication
When preparing figures for publication, you often need to adhere to specific size requirements. Here’s an example of how to create a figure that meets common publication standards:
import matplotlib.pyplot as plt
import numpy as np

def create_publication_figure(width_cm, height_cm, dpi=300):
    # Convert cm to inches
    width_inches = width_cm / 2.54
    height_inches = height_cm / 2.54

    # Create the figure
    fig = plt.figure(figsize=(width_inches, height_inches), dpi=dpi)

    return fig

# Generate some data
x = np.linspace(0, 10, 100)
y = np.sin(x)

# Create a figure suitable for publication (e.g., 8.5 cm wide, 6 cm tall)
fig = create_publication_figure(8.5, 6)

# Plot the data
plt.plot(x, y)
plt.title('Publication-Ready Figure (how2matplotlib.com)')
plt.xlabel('X-axis (how2matplotlib.com)')
plt.ylabel('Y-axis (how2matplotlib.com)')

# Adjust layout to prevent clipping
plt.tight_layout()

# Save the figure
plt.savefig('publication_figure.tiff', dpi=300, format='tiff')

# Display the plot
plt.show()
Output:
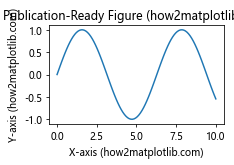
In this example, we create a function create_publication_figure() that takes the desired width and height in centimeters, as well as the DPI. This function creates a figure that meets specific size requirements often encountered in scientific publications. We then save the figure as a high-resolution TIFF file, which is a common format for publication-quality images.
Troubleshooting Common Issues When Changing Figure Size
As you work on changing the size of figures drawn with Matplotlib, you may encounter some common issues. Let’s address a few of these and provide solutions.
13. Dealing with Overlapping Elements
Sometimes, when you change the figure size, elements like titles, labels, or legends may overlap. Here’s how to address this issue:
import matplotlib.pyplot as plt
import numpy as np

# Generate some data
x = np.linspace(0, 10, 100)
y1 = np.sin(x)
y2 = np.cos(x)

# Create a figure with a small size
fig = plt.figure(figsize=(6, 4))

# Plot the data
plt.plot(x, y1, label='Sine')
plt.plot(x, y2, label='Cosine')
plt.title('Overlapping Elements (how2matplotlib.com)')
plt.xlabel('X-axis (how2matplotlib.com)')
plt.ylabel('Y-axis (how2matplotlib.com)')
plt.legend()

# Adjust layout to prevent overlapping
plt.tight_layout()

# Display the plot
plt.show()
Output:
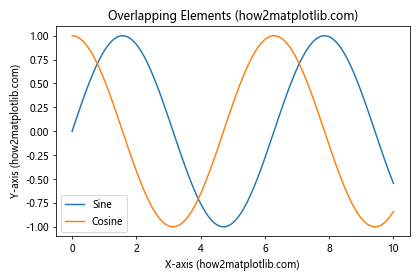
In this example, we use plt.tight_layout() to automatically adjust the padding between plot elements, reducing the chance of overlap. You can also manually adjust the layout using plt.subplots_adjust() for more fine-grained control.
14. Handling Aspect Ratio Distortion
When changing figure size, you might inadvertently distort the aspect ratio of your plots. Here’s how to maintain the correct aspect ratio:
import matplotlib.pyplot as plt
import numpy as np

# Generate some data
x = np.linspace(0, 10, 100)
y = np.sin(x)

# Create a figure with a wide aspect ratio
fig, (ax1, ax2) = plt.subplots(1, 2, figsize=(12, 4))

# Plot with distorted aspect ratio
ax1.plot(x, y)
ax1.set_title('Distorted Aspect Ratio (how2matplotlib.com)')

# Plot with corrected aspect ratio
ax2.plot(x, y)
ax2.set_aspect('equal')
ax2.set_title('Corrected Aspect Ratio (how2matplotlib.com)')

# Adjust layout
plt.tight_layout()

# Display the plot
plt.show()
Output:
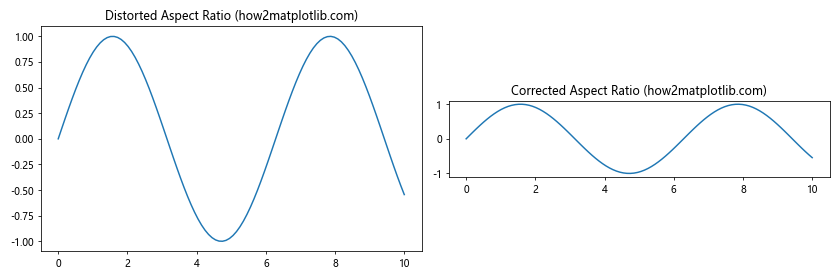
In this example, we use ax.set_aspect('equal') to maintain the correct aspect ratio for the second subplot, even when the overall figure has a wide aspect ratio.
Conclusion
In this comprehensive guide, we’ve explored numerous methods and techniques for changing the size of figures drawn with Matplotlib. From basic adjustments using plt.figure() and plt.subplots() to advanced techniques like responsive sizing and publication-ready figures, we’ve covered a wide range of approaches to help you create perfectly sized visualizations for any purpose.