How to Adjust Matplotlib Figure Text Size
Matplotlib figure text size is a crucial aspect of data visualization that can significantly impact the readability and overall appearance of your plots. In this comprehensive guide, we’ll explore various techniques to adjust the matplotlib figure text size, including titles, labels, legends, and annotations. We’ll cover everything from basic size adjustments to advanced customization options, providing you with the tools you need to create professional-looking visualizations.
Understanding Matplotlib Figure Text Size
Before we dive into the specifics of adjusting matplotlib figure text size, it’s essential to understand the different types of text elements in a matplotlib figure. These include:
- Title
- Axis labels (x-axis and y-axis)
- Tick labels
- Legend text
- Annotations and text boxes
Each of these elements can have its size adjusted independently, allowing for fine-tuned control over your plot’s appearance.
Basic Matplotlib Figure Text Size Adjustments
Let’s start with some basic techniques to adjust the matplotlib figure text size. These methods will give you a solid foundation for customizing your plots.
Setting the Title Size
One of the most prominent text elements in a matplotlib figure is the title. To adjust its size, you can use the fontsize parameter in the set_title() method:
import matplotlib.pyplot as plt

fig, ax = plt.subplots()
ax.plot([1, 2, 3, 4], [1, 4, 2, 3])
ax.set_title("How2Matplotlib.com: Adjusting Title Size", fontsize=16)
plt.show()
Output:
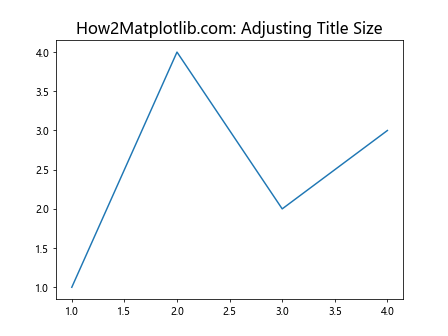
In this example, we set the title size to 16 points. You can adjust this value to make the title larger or smaller as needed.
Changing Axis Label Sizes
To modify the size of axis labels, you can use the fontsize parameter in the set_xlabel() and set_ylabel() methods:
import matplotlib.pyplot as plt

fig, ax = plt.subplots()
ax.plot([1, 2, 3, 4], [1, 4, 2, 3])
ax.set_xlabel("X-axis (How2Matplotlib.com)", fontsize=14)
ax.set_ylabel("Y-axis (How2Matplotlib.com)", fontsize=14)
plt.show()
Output:
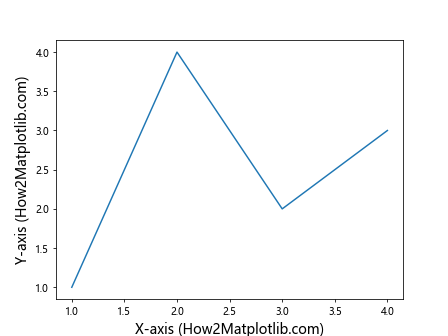
This code sets both the x-axis and y-axis label sizes to 14 points.
Adjusting Tick Label Sizes
Tick labels are the numbers or text that appear along the axes. To change their size, you can use the tick_params() method:
import matplotlib.pyplot as plt

fig, ax = plt.subplots()
ax.plot([1, 2, 3, 4], [1, 4, 2, 3])
ax.tick_params(axis='both', which='major', labelsize=12)
ax.set_title("How2Matplotlib.com: Tick Label Size", fontsize=16)
plt.show()
Output:
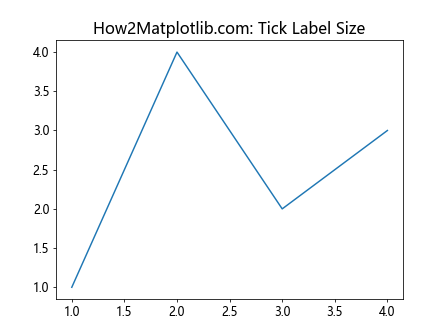
This example sets the size of both x-axis and y-axis tick labels to 12 points.
Advanced Matplotlib Figure Text Size Techniques
Now that we’ve covered the basics, let’s explore some more advanced techniques for adjusting matplotlib figure text size.
Using rcParams for Global Text Size Settings
If you want to set a default text size for all your plots, you can use matplotlib’s rcParams:
import matplotlib.pyplot as plt
import matplotlib as mpl

mpl.rcParams['font.size'] = 14
mpl.rcParams['axes.titlesize'] = 18
mpl.rcParams['axes.labelsize'] = 16
mpl.rcParams['xtick.labelsize'] = 12
mpl.rcParams['ytick.labelsize'] = 12

fig, ax = plt.subplots()
ax.plot([1, 2, 3, 4], [1, 4, 2, 3])
ax.set_title("How2Matplotlib.com: Global Text Size Settings")
ax.set_xlabel("X-axis")
ax.set_ylabel("Y-axis")
plt.show()
Output:
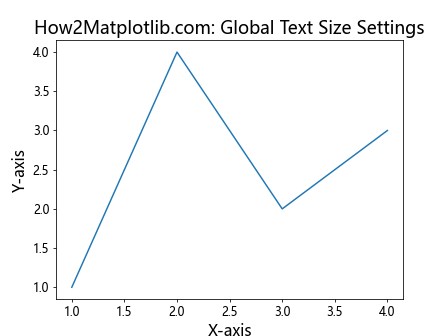
This code sets global font sizes for different text elements, which will be applied to all subsequent plots in your script.
Adjusting Legend Text Size
Legends are essential for multi-line plots. Here’s how to adjust the legend text size:
import matplotlib.pyplot as plt

fig, ax = plt.subplots()
ax.plot([1, 2, 3, 4], [1, 4, 2, 3], label="Line 1")
ax.plot([1, 2, 3, 4], [2, 3, 4, 1], label="Line 2")
ax.legend(fontsize=12)
ax.set_title("How2Matplotlib.com: Legend Text Size", fontsize=16)
plt.show()
Output:
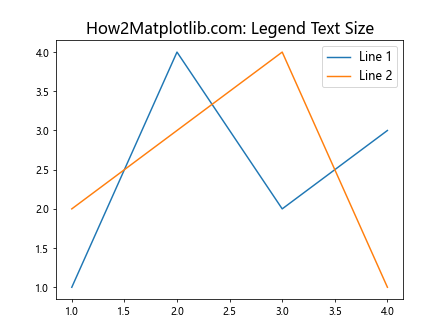
This example sets the legend text size to 12 points.
Customizing Annotation Text Size
Annotations are useful for highlighting specific points or regions in your plot. Here’s how to adjust their text size:
import matplotlib.pyplot as plt

fig, ax = plt.subplots()
ax.plot([1, 2, 3, 4], [1, 4, 2, 3])
ax.annotate("How2Matplotlib.com", xy=(2, 4), xytext=(2.5, 3.5),
            arrowprops=dict(facecolor='black', shrink=0.05),
            fontsize=14)
ax.set_title("Annotation Text Size", fontsize=16)
plt.show()
Output:
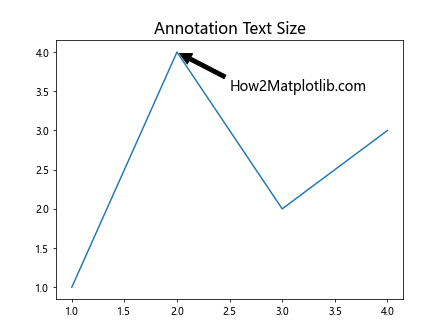
This code creates an annotation with a text size of 14 points.
Fine-tuning Matplotlib Figure Text Size
Sometimes, you may need more precise control over text sizes in your matplotlib figures. Let’s explore some techniques for fine-tuning text sizes.
Using Point Sizes vs. Relative Sizes
Matplotlib allows you to specify text sizes in points or using relative sizes. Here’s an example that demonstrates both:
import matplotlib.pyplot as plt

fig, (ax1, ax2) = plt.subplots(1, 2, figsize=(12, 5))

# Using point sizes
ax1.set_title("How2Matplotlib.com: Point Sizes", fontsize=16)
ax1.set_xlabel("X-axis", fontsize=14)
ax1.set_ylabel("Y-axis", fontsize=14)
ax1.plot([1, 2, 3, 4], [1, 4, 2, 3])

# Using relative sizes
ax2.set_title("How2Matplotlib.com: Relative Sizes", fontsize='large')
ax2.set_xlabel("X-axis", fontsize='medium')
ax2.set_ylabel("Y-axis", fontsize='medium')
ax2.plot([1, 2, 3, 4], [1, 4, 2, 3])

plt.tight_layout()
plt.show()
Output:
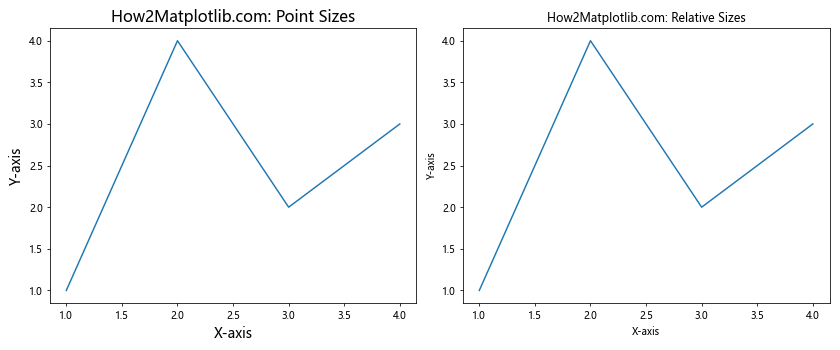
This example shows how to use both point sizes and relative sizes (‘small’, ‘medium’, ‘large’, etc.) for text elements.
Adjusting Text Size Based on Figure Size
Sometimes, you may want to adjust text sizes proportionally to the figure size. Here’s how you can achieve this:
import matplotlib.pyplot as plt

def adjust_text_size(fig, base_size=12):
    width, height = fig.get_size_inches()
    scale_factor = (width * height) / (8 * 6)  # Assuming 8x6 is the default size
    return base_size * scale_factor

fig, ax = plt.subplots(figsize=(10, 8))
text_size = adjust_text_size(fig)

ax.plot([1, 2, 3, 4], [1, 4, 2, 3])
ax.set_title(f"How2Matplotlib.com: Adjusted Text Size ({text_size:.1f}pt)", fontsize=text_size*1.2)
ax.set_xlabel("X-axis", fontsize=text_size)
ax.set_ylabel("Y-axis", fontsize=text_size)
plt.show()
Output:
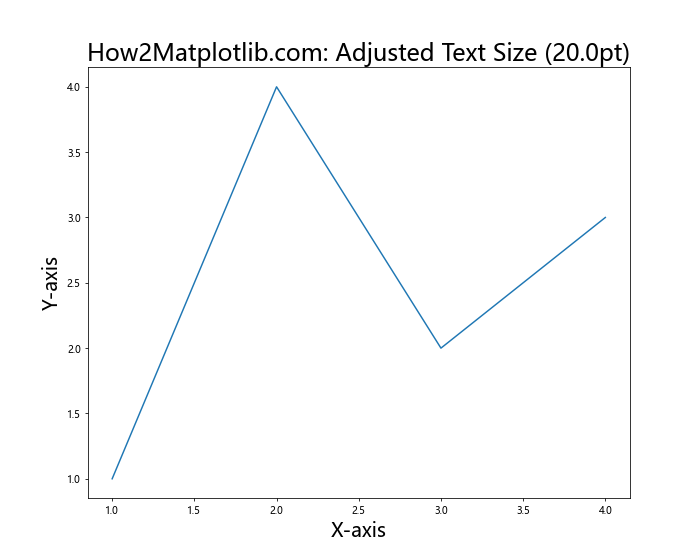
This code defines a function that calculates an appropriate text size based on the figure dimensions, allowing for consistent text scaling across different figure sizes.
Handling Matplotlib Figure Text Size in Subplots
When working with subplots, managing text sizes can become more complex. Let’s explore some techniques for handling text sizes in subplot layouts.
Consistent Text Sizes Across Subplots
To maintain consistent text sizes across multiple subplots, you can use a combination of tight_layout() and manual size adjustments:
import matplotlib.pyplot as plt

fig, axs = plt.subplots(2, 2, figsize=(12, 10))
fig.suptitle("How2Matplotlib.com: Consistent Text Sizes", fontsize=16)

for i, ax in enumerate(axs.flat):
    ax.plot([1, 2, 3, 4], [1, 4, 2, 3])
    ax.set_title(f"Subplot {i+1}", fontsize=14)
    ax.set_xlabel("X-axis", fontsize=12)
    ax.set_ylabel("Y-axis", fontsize=12)

plt.tight_layout()
plt.show()
Output:
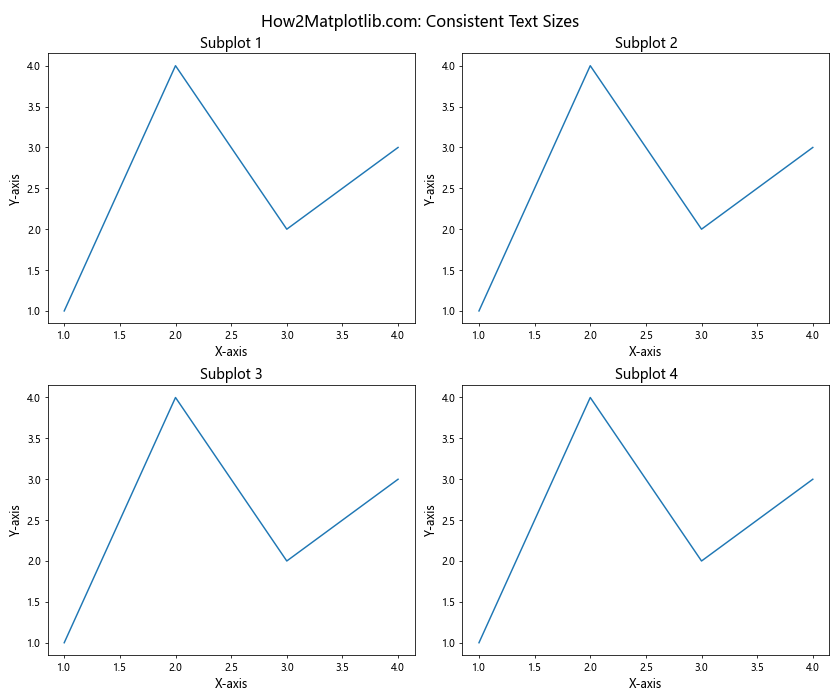
This example creates a 2×2 grid of subplots with consistent text sizes for titles, labels, and the overall figure title.
Adjusting Text Size for Specific Subplots
Sometimes, you may need to adjust text sizes for specific subplots. Here’s how you can do that:
import matplotlib.pyplot as plt

fig, axs = plt.subplots(2, 2, figsize=(12, 10))
fig.suptitle("How2Matplotlib.com: Variable Text Sizes", fontsize=16)

for i, ax in enumerate(axs.flat):
    ax.plot([1, 2, 3, 4], [1, 4, 2, 3])
    ax.set_title(f"Subplot {i+1}", fontsize=14)
    ax.set_xlabel("X-axis", fontsize=12)
    ax.set_ylabel("Y-axis", fontsize=12)

# Adjust text size for a specific subplot
axs[1, 1].set_title("Larger Title", fontsize=18)
axs[1, 1].set_xlabel("Larger X-axis", fontsize=16)
axs[1, 1].set_ylabel("Larger Y-axis", fontsize=16)

plt.tight_layout()
plt.show()
Output:
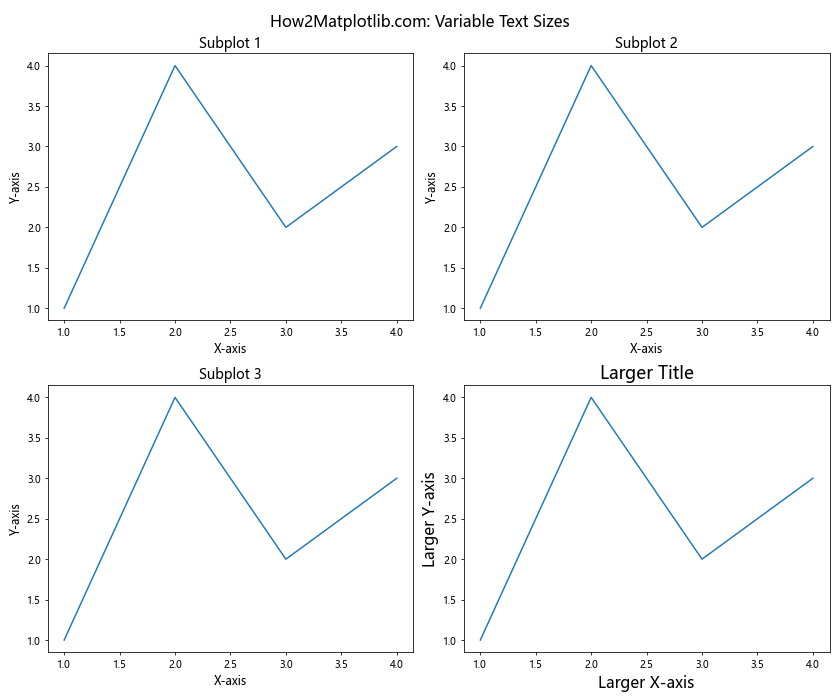
This code demonstrates how to set different text sizes for a specific subplot while maintaining consistency in the others.
Advanced Matplotlib Figure Text Size Customization
For even more control over your matplotlib figure text size, you can use some advanced customization techniques.
Using Text Objects for Fine-grained Control
Text objects in matplotlib offer extensive customization options. Here’s an example of using text objects to create highly customized text elements:
import matplotlib.pyplot as plt

fig, ax = plt.subplots(figsize=(10, 6))
ax.plot([1, 2, 3, 4], [1, 4, 2, 3])

# Create a text object for the title
title = ax.text(0.5, 1.05, "How2Matplotlib.com: Custom Text Object",
                fontsize=16, fontweight='bold', ha='center', va='bottom',
                transform=ax.transAxes)

# Create custom axis labels
xlabel = ax.text(0.5, -0.1, "X-axis", fontsize=14, ha='center', va='top',
                 transform=ax.transAxes)
ylabel = ax.text(-0.1, 0.5, "Y-axis", fontsize=14, ha='right', va='center',
                 rotation='vertical', transform=ax.transAxes)

plt.show()
Output:
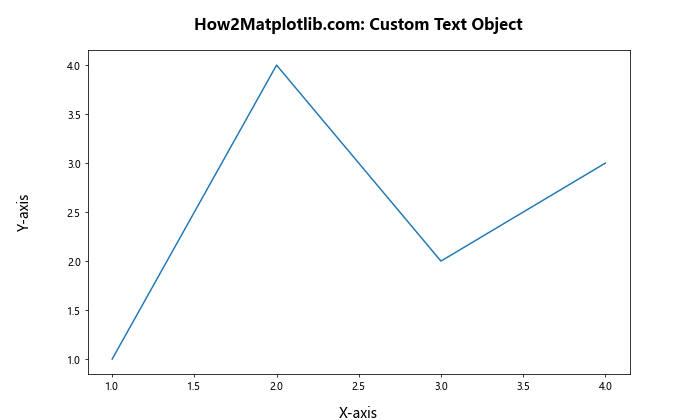
This example demonstrates how to create custom text objects for the title and axis labels, allowing for precise positioning and styling.
Dynamic Text Sizing Based on Content
In some cases, you may want to adjust text size based on the content of the text itself. Here’s an example that demonstrates this concept:
import matplotlib.pyplot as plt

def adjust_text_size(text, max_width, min_size=8, max_size=16):
    for size in range(max_size, min_size-1, -1):
        t = plt.text(0, 0, text, fontsize=size)
        bbox = t.get_window_extent(renderer=plt.gcf().canvas.get_renderer())
        if bbox.width < max_width:
            plt.close()
            return size
    plt.close()
    return min_size

fig, ax = plt.subplots(figsize=(8, 6))
ax.plot([1, 2, 3, 4], [1, 4, 2, 3])

title_text = "How2Matplotlib.com: Dynamic Text Sizing"
title_size = adjust_text_size(title_text, fig.get_figwidth() * fig.dpi * 0.8)

ax.set_title(title_text, fontsize=title_size)
ax.set_xlabel("X-axis", fontsize=12)
ax.set_ylabel("Y-axis", fontsize=12)

plt.show()
This code defines a function that adjusts the text size based on the content and available space, ensuring that the text fits within a specified width.
Matplotlib Figure Text Size and Accessibility
When adjusting text sizes in your matplotlib figures, it's important to consider accessibility. Larger text sizes can make your visualizations more readable for a wider audience.
Creating Accessible Plots with Larger Text Sizes
Here's an example of creating a plot with larger, more accessible text sizes:
import matplotlib.pyplot as plt

plt.rcParams.update({
    'font.size': 14,
    'axes.titlesize': 18,
    'axes.labelsize': 16,
    'xtick.labelsize': 14,
    'ytick.labelsize': 14,
    'legend.fontsize': 14,
})

fig, ax = plt.subplots(figsize=(10, 6))
ax.plot([1, 2, 3, 4], [1, 4, 2, 3], label="Data")
ax.set_title("How2Matplotlib.com: Accessible Plot")
ax.set_xlabel("X-axis")
ax.set_ylabel("Y-axis")
ax.legend()

plt.show()
Output:
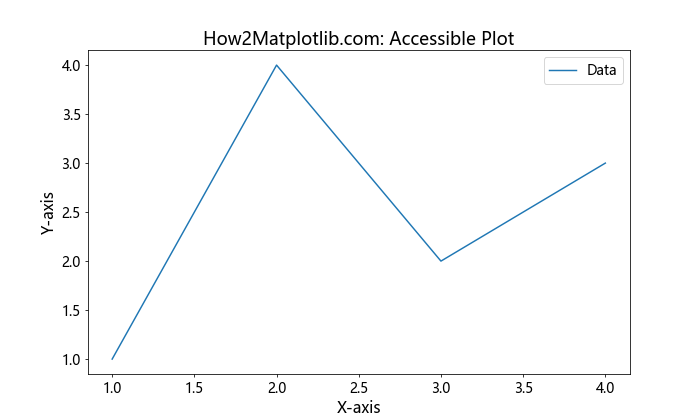
This example sets larger default font sizes for all text elements, making the plot more accessible to readers with visual impairments.
Using High Contrast Colors with Adjusted Text Sizes
Combining larger text sizes with high contrast colors can further improve accessibility:
import matplotlib.pyplot as plt

plt.rcParams.update({
    'font.size': 14,
    'axes.titlesize': 18,
    'axes.labelsize': 16,
    'xtick.labelsize': 14,
    'ytick.labelsize': 14,
    'legend.fontsize': 14,
    'text.color': 'white',
    'axes.labelcolor': 'white',
    'xtick.color': 'white',
    'ytick.color': 'white',
})

fig, ax = plt.subplots(figsize=(10, 6), facecolor='#333333')
ax.plot([1, 2, 3, 4], [1, 4, 2, 3], color='#00FF00', linewidth=2, label="Data")
ax.set_title("How2Matplotlib.com: High Contrast Plot")
ax.set_xlabel("X-axis")
ax.set_ylabel("Y-axis")
ax.legend()
ax.set_facecolor('#1C1C1C')

plt.show()
Output:
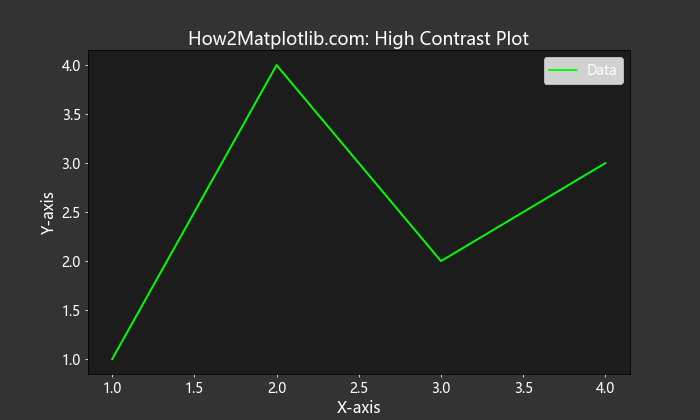
This example combines larger text sizes with a dark background and light text colors to create a high-contrast, accessible plot.
Matplotlib Figure Text Size in Different Plot Types
Different types of plots may require different approaches to text size adjustment. Let's explore how to handle text sizes in various plot types.
Bar Plots with Adjusted Text Sizes
Bar plots often require careful text size adjustment, especially for bar labels. Here's an example:
import matplotlib.pyplot as plt
import numpy```python
import matplotlib.pyplot as plt
import numpy as np

categories = ['A', 'B', 'C', 'D']
values = [3, 7, 2, 5]

fig, ax = plt.subplots(figsize=(10, 6))
bars = ax.bar(categories, values)

ax.set_title("How2Matplotlib.com: Bar Plot with Adjusted Text", fontsize=16)
ax.set_xlabel("Categories", fontsize=14)
ax.set_ylabel("Values", fontsize=14)

# Add value labels on top of each bar
for bar in bars:
    height = bar.get_height()
    ax.text(bar.get_x() + bar.get_width()/2., height,
            f'{height}',
            ha='center', va='bottom', fontsize=12)

plt.show()
This example demonstrates how to adjust text sizes in a bar plot, including the title, axis labels, and bar value labels.
Scatter Plots with Varying Point Sizes and Text
Scatter plots can benefit from carefully adjusted text sizes, especially when dealing with point labels:
import matplotlib.pyplot as plt
import numpy as np

np.random.seed(42)
x = np.random.rand(20)
y = np.random.rand(20)
sizes = np.random.rand(20) * 1000

fig, ax = plt.subplots(figsize=(10, 6))
scatter = ax.scatter(x, y, s=sizes, alpha=0.5)

ax.set_title("How2Matplotlib.com: Scatter Plot with Varying Sizes", fontsize=16)
ax.set_xlabel("X-axis", fontsize=14)
ax.set_ylabel("Y-axis", fontsize=14)

# Add labels to some points
for i, (x_val, y_val) in enumerate(zip(x, y)):
    if i % 5 == 0:  # Label every 5th point
        ax.annotate(f"Point {i}", (x_val, y_val), xytext=(5, 5),
                    textcoords='offset points', fontsize=10)

plt.show()
Output:
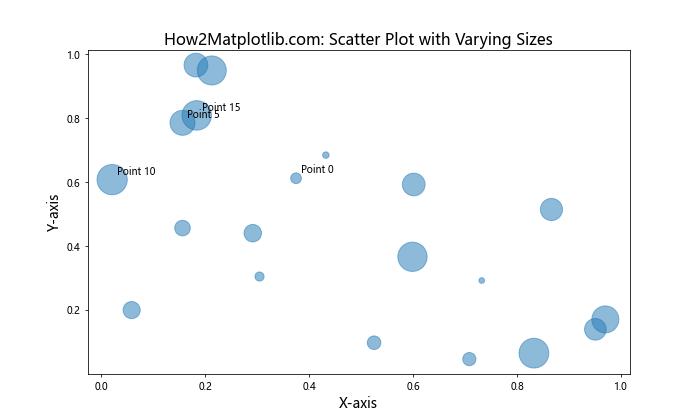
This example shows how to create a scatter plot with varying point sizes and add labels to selected points with adjusted text sizes.
Handling Matplotlib Figure Text Size in 3D Plots
3D plots present unique challenges when it comes to text size adjustment. Let's explore how to handle text sizes in 3D visualizations.
Adjusting Text Sizes in 3D Surface Plots
Here's an example of how to adjust text sizes in a 3D surface plot:
import matplotlib.pyplot as plt
import numpy as np
from mpl_toolkits.mplot3d import Axes3D

fig = plt.figure(figsize=(10, 8))
ax = fig.add_subplot(111, projection='3d')

X = np.arange(-5, 5, 0.25)
Y = np.arange(-5, 5, 0.25)
X, Y = np.meshgrid(X, Y)
R = np.sqrt(X**2 + Y**2)
Z = np.sin(R)

surf = ax.plot_surface(X, Y, Z, cmap='viridis')

ax.set_title("How2Matplotlib.com: 3D Surface Plot", fontsize=16)
ax.set_xlabel("X-axis", fontsize=14)
ax.set_ylabel("Y-axis", fontsize=14)
ax.set_zlabel("Z-axis", fontsize=14)

# Adjust tick label sizes
ax.tick_params(axis='both', which='major', labelsize=12)

# Add a color bar
cbar = fig.colorbar(surf)
cbar.ax.tick_params(labelsize=12)
cbar.set_label("Z values", fontsize=14)

plt.show()
Output:
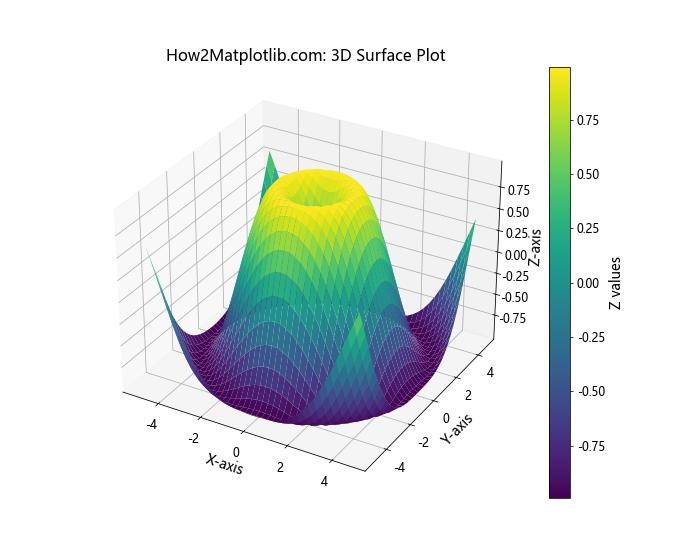
This example demonstrates how to adjust text sizes for the title, axis labels, tick labels, and colorbar in a 3D surface plot.
Matplotlib Figure Text Size in Animations
When creating animations with matplotlib, it's important to consider text sizes to ensure readability throughout the animation. Here's an example of how to handle text sizes in a simple animation:
import matplotlib.pyplot as plt
import matplotlib.animation as animation
import numpy as np

fig, ax = plt.subplots(figsize=(10, 6))

x = np.linspace(0, 2*np.pi, 100)
line, = ax.plot(x, np.sin(x))

ax.set_title("How2Matplotlib.com: Animated Sine Wave", fontsize=16)
ax.set_xlabel("X-axis", fontsize=14)
ax.set_ylabel("Y-axis", fontsize=14)

# Text object for displaying the current phase
phase_text = ax.text(0.02, 0.95, '', transform=ax.transAxes, fontsize=12)

def animate(frame):
    phase = frame * 0.1
    line.set_ydata(np.sin(x + phase))
    phase_text.set_text(f"Phase: {phase:.2f}")
    return line, phase_text

ani = animation.FuncAnimation(fig, animate, frames=100, interval=50, blit=True)

plt.show()
Output:
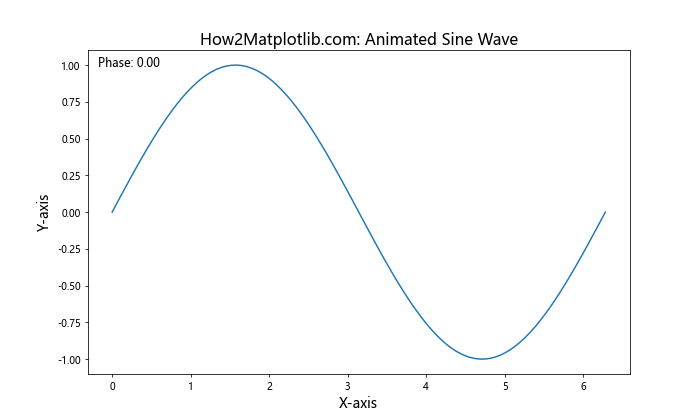
This example creates an animated sine wave with adjustable text sizes for the title, axis labels, and a dynamic text element showing the current phase.
Best Practices for Matplotlib Figure Text Size
When working with matplotlib figure text size, it's important to follow some best practices to ensure your visualizations are both aesthetically pleasing and functional. Here are some tips to keep in mind:
- Consistency: Maintain consistent text sizes across similar elements in your plot. For example, use the same size for all axis labels.
Hierarchy: Use different text sizes to establish a visual hierarchy. Typically, the title should be the largest, followed by axis labels, then tick labels and other annotations.
Readability: Ensure that all text is easily readable, especially when the figure is scaled down or viewed from a distance.
Accessibility: Consider using larger text sizes to make your plots more accessible to readers with visual impairments.
Balance: Strike a balance between text size and other elements in your plot. Text shouldn't overpower the data visualization itself.
Scalability: When creating plots that may be resized, consider using relative sizes or implementing dynamic sizing based on the figure dimensions.
Context: Adjust text sizes based on the context in which the plot will be viewed (e.g., presentation slides, academic papers, web pages).
Here's an example that demonstrates these best practices: