How to Add Text Inside the Plot in Matplotlib
Add Text Inside the Plot in Matplotlib is an essential skill for data visualization enthusiasts and professionals alike. This article will delve deep into the various methods and techniques to add text inside the plot in Matplotlib, providing you with a thorough understanding of this crucial feature. We’ll explore different approaches, customization options, and best practices to enhance your data visualizations with informative and visually appealing text elements.
Understanding the Basics of Adding Text Inside the Plot in Matplotlib
Before we dive into the specifics of how to add text inside the plot in Matplotlib, let’s start with the fundamentals. Matplotlib is a powerful plotting library for Python that allows you to create a wide range of static, animated, and interactive visualizations. Adding text inside the plot is a common requirement when creating informative and professional-looking charts and graphs.
To add text inside the plot in Matplotlib, you’ll primarily use the text() function. This function allows you to place text at specific coordinates within your plot. Here’s a simple example to get you started:
import matplotlib.pyplot as plt

fig, ax = plt.subplots()
ax.plot([1, 2, 3, 4], [1, 4, 2, 3])
ax.text(2, 3, 'How to add text inside the plot in Matplotlib\nhow2matplotlib.com', fontsize=12)
plt.show()
Output:
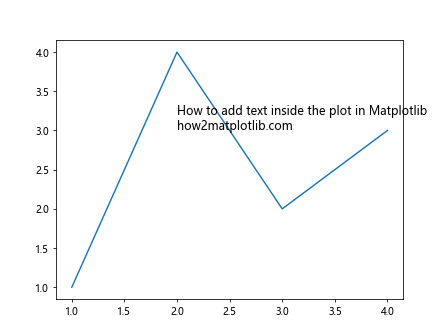
In this example, we’ve added text inside the plot at the coordinates (2, 3). The text includes a newline character (\n) to demonstrate how to create multi-line text.
Positioning Text Inside the Plot in Matplotlib
When you add text inside the plot in Matplotlib, precise positioning is crucial for creating clear and informative visualizations. Matplotlib offers several ways to control the position of your text elements.
Using Absolute Coordinates
The most straightforward method to add text inside the plot in Matplotlib is by using absolute coordinates. These coordinates correspond to the data values on your x and y axes. Here’s an example:
import matplotlib.pyplot as plt

fig, ax = plt.subplots()
ax.plot([0, 1, 2, 3, 4], [0, 2, 4, 6, 8])
ax.text(1.5, 4, 'Add text inside the plot\nhow2matplotlib.com', fontsize=12)
plt.show()
Output:
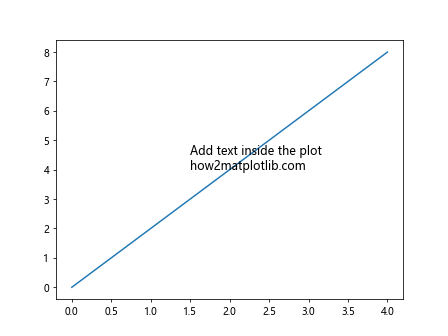
In this example, we’ve added text at the point (1.5, 4) on our plot.
Using Relative Coordinates
Sometimes, you may want to position your text relative to the plot’s axes, regardless of the data values. Matplotlib allows you to add text inside the plot using relative coordinates with the transform parameter:
import matplotlib.pyplot as plt

fig, ax = plt.subplots()
ax.plot([0, 1, 2, 3, 4], [0, 2, 4, 6, 8])
ax.text(0.5, 0.5, 'Add text inside the plot\nhow2matplotlib.com',
        transform=ax.transAxes, fontsize=12)
plt.show()
Output:
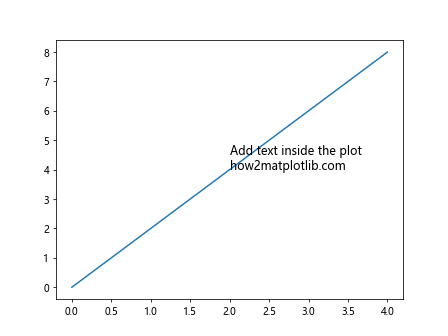
In this example, we’ve positioned the text at the center of the plot (0.5, 0.5) using relative coordinates.
Using Figure Coordinates
If you want to add text inside the plot in Matplotlib relative to the entire figure, you can use figure coordinates:
import matplotlib.pyplot as plt

fig, ax = plt.subplots()
ax.plot([0, 1, 2, 3, 4], [0, 2, 4, 6, 8])
fig.text(0.5, 0.5, 'Add text inside the plot\nhow2matplotlib.com',
         ha='center', va='center', fontsize=12)
plt.show()
Output:
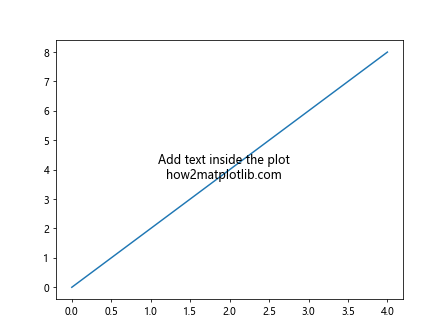
This example places the text at the center of the entire figure.
Customizing Text Appearance When Adding Text Inside the Plot in Matplotlib
When you add text inside the plot in Matplotlib, you have a wide range of options to customize its appearance. Let’s explore some of these customization techniques.
Font Properties
You can control various font properties when you add text inside the plot in Matplotlib:
import matplotlib.pyplot as plt

fig, ax = plt.subplots()
ax.plot([1, 2, 3, 4], [1, 4, 2, 3])
ax.text(2, 3, 'Add text inside the plot\nhow2matplotlib.com',
        fontsize=14, fontweight='bold', fontstyle='italic', fontfamily='serif')
plt.show()
Output:
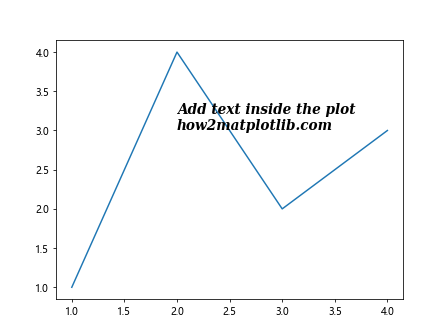
This example demonstrates how to set the font size, weight, style, and family.
Text Color
Changing the color of your text can help it stand out or blend in with your plot:
import matplotlib.pyplot as plt

fig, ax = plt.subplots()
ax.plot([1, 2, 3, 4], [1, 4, 2, 3])
ax.text(2, 3, 'Add text inside the plot\nhow2matplotlib.com',
        color='red', fontsize=12)
plt.show()
Output:
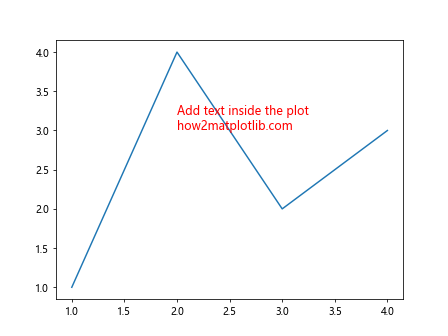
Here, we’ve set the text color to red.
Text Alignment
Controlling text alignment is crucial when you add text inside the plot in Matplotlib:
import matplotlib.pyplot as plt

fig, ax = plt.subplots()
ax.plot([1, 2, 3, 4], [1, 4, 2, 3])
ax.text(2, 3, 'Add text inside the plot\nhow2matplotlib.com',
        ha='center', va='center', fontsize=12)
plt.show()
Output:
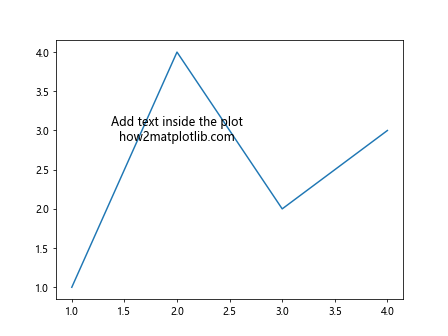
This example centers the text both horizontally and vertically at the specified coordinates.
Adding Multiple Text Elements Inside the Plot in Matplotlib
Often, you’ll need to add multiple text elements inside the plot in Matplotlib. Let’s look at how to do this effectively.
Adding Text at Different Locations
You can add multiple text elements by calling the text() function multiple times:
import matplotlib.pyplot as plt

fig, ax = plt.subplots()
ax.plot([1, 2, 3, 4], [1, 4, 2, 3])
ax.text(1.5, 2, 'First text\nhow2matplotlib.com', fontsize=12)
ax.text(3, 3.5, 'Second text\nhow2matplotlib.com', fontsize=12)
ax.text(2.5, 1.5, 'Third text\nhow2matplotlib.com', fontsize=12)
plt.show()
Output:
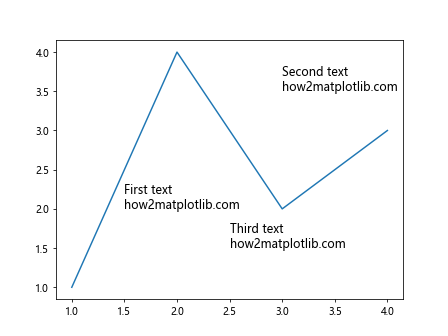
This example adds three separate text elements at different locations in the plot.
Using a Loop to Add Text
If you need to add text inside the plot in Matplotlib based on data points, you can use a loop:
import matplotlib.pyplot as plt

x = [1, 2, 3, 4]
y = [1, 4, 2, 3]

fig, ax = plt.subplots()
ax.plot(x, y)

for i, (xi, yi) in enumerate(zip(x, y)):
    ax.text(xi, yi, f'Point {i+1}\nhow2matplotlib.com', fontsize=10)

plt.show()
Output:
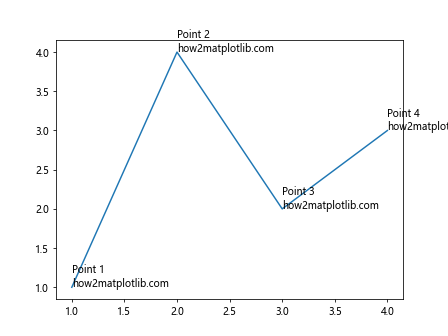
This example adds text labels to each data point in the plot.
Advanced Techniques for Adding Text Inside the Plot in Matplotlib
Let’s explore some more advanced techniques to add text inside the plot in Matplotlib.
Using Text Boxes
Text boxes can help your text stand out from the background:
import matplotlib.pyplot as plt

fig, ax = plt.subplots()
ax.plot([1, 2, 3, 4], [1, 4, 2, 3])
ax.text(2, 3, 'Add text inside the plot\nhow2matplotlib.com',
        bbox=dict(facecolor='white', edgecolor='black', alpha=0.7),
        fontsize=12)
plt.show()
Output:
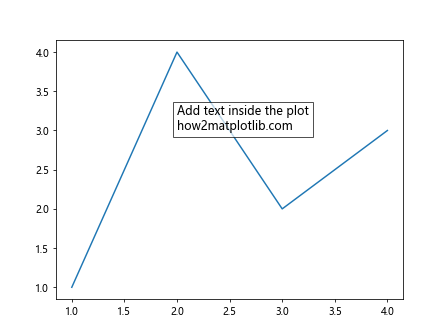
This example adds a white text box with a black edge around the text.
Rotating Text
Sometimes, you may need to rotate text when you add it inside the plot in Matplotlib:
import matplotlib.pyplot as plt

fig, ax = plt.subplots()
ax.plot([1, 2, 3, 4], [1, 4, 2, 3])
ax.text(2, 3, 'Add text inside the plot\nhow2matplotlib.com',
        rotation=45, fontsize=12)
plt.show()
Output:
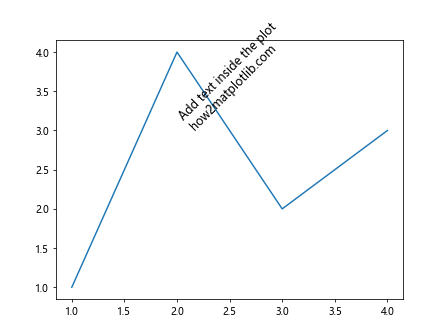
This example rotates the text by 45 degrees.
Using LaTeX Formatting
Matplotlib supports LaTeX formatting, which is useful for adding mathematical expressions:
import matplotlib.pyplot as plt

fig, ax = plt.subplots()
ax.plot([1, 2, 3, 4], [1, 4, 2, 3])
ax.text(2, 3, r'$\sum_{i=1}^n x_i = \frac{n(n+1)}{2}$\nhow2matplotlib.com',
        fontsize=12)
plt.show()
Output:
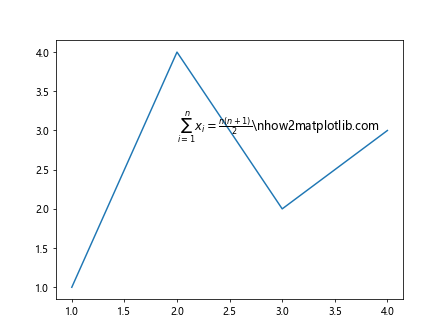
This example adds a LaTeX-formatted mathematical expression to the plot.
Adding Annotations to Your Plot in Matplotlib
Annotations are a special way to add text inside the plot in Matplotlib, often used to highlight specific points or features.
Basic Annotations
Here’s how to add a basic annotation:
import matplotlib.pyplot as plt

fig, ax = plt.subplots()
ax.plot([1, 2, 3, 4], [1, 4, 2, 3])
ax.annotate('Peak\nhow2matplotlib.com', xy=(2, 4), xytext=(2.5, 3.5),
            arrowprops=dict(facecolor='black', shrink=0.05),
            fontsize=12)
plt.show()
Output:
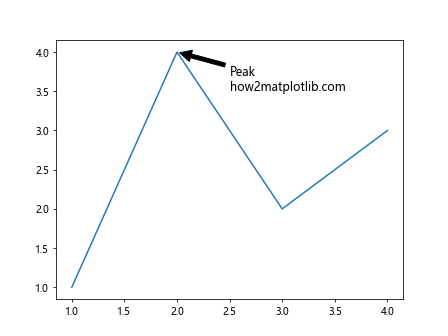
This example adds an annotation with an arrow pointing to a specific point on the plot.
Fancy Annotations
You can create more elaborate annotations:
import matplotlib.pyplot as plt

fig, ax = plt.subplots()
ax.plot([1, 2, 3, 4], [1, 4, 2, 3])
ax.annotate('Important point\nhow2matplotlib.com', xy=(3, 2), xytext=(3.5, 3),
            arrowprops=dict(facecolor='red', shrink=0.05, width=2, headwidth=8),
            bbox=dict(boxstyle="round,pad=0.3", fc="yellow", ec="b", lw=2),
            fontsize=12)
plt.show()
Output:
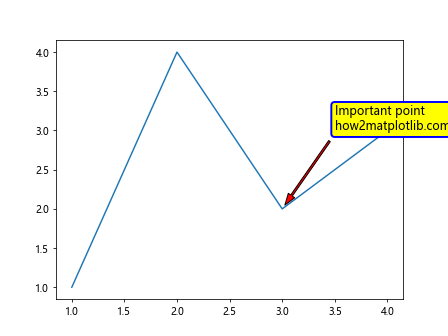
This example creates a fancy annotation with a custom arrow and text box.
Adding Text to Subplots in Matplotlib
When working with subplots, you may need to add text inside each plot in Matplotlib. Here’s how to do it:
import matplotlib.pyplot as plt

fig, (ax1, ax2) = plt.subplots(1, 2, figsize=(10, 5))

ax1.plot([1, 2, 3, 4], [1, 4, 2, 3])
ax1.text(2, 3, 'Subplot 1\nhow2matplotlib.com', fontsize=12)

ax2.plot([1, 2, 3, 4], [3, 2, 4, 1])
ax2.text(2, 3, 'Subplot 2\nhow2matplotlib.com', fontsize=12)

plt.show()
Output:
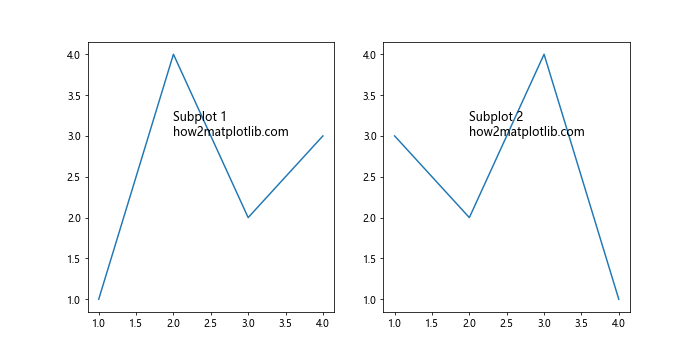
This example adds text to two separate subplots.
Adding Text to 3D Plots in Matplotlib
You can also add text inside 3D plots in Matplotlib:
import matplotlib.pyplot as plt
from mpl_toolkits.mplot3d import Axes3D
import numpy as np

fig = plt.figure()
ax = fig.add_subplot(111, projection='3d')

x = np.linspace(-5, 5, 100)
y = np.linspace(-5, 5, 100)
X, Y = np.meshgrid(x, y)
Z = np.sin(np.sqrt(X**2 + Y**2))

ax.plot_surface(X, Y, Z)
ax.text(0, 0, 1, 'Add text to 3D plot\nhow2matplotlib.com', fontsize=12)

plt.show()
Output:
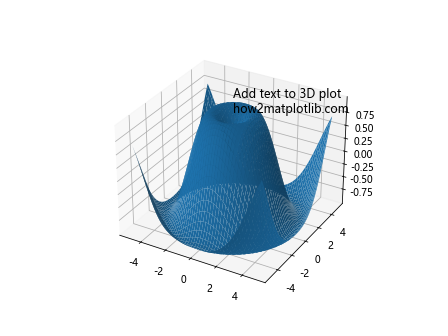
This example demonstrates how to add text to a 3D surface plot.
Best Practices for Adding Text Inside the Plot in Matplotlib
When you add text inside the plot in Matplotlib, there are several best practices to keep in mind:
- Readability: Ensure your text is easily readable by choosing appropriate font sizes and colors that contrast well with the background.
Positioning: Place text strategically to avoid overlapping with important data points or other plot elements.
Consistency: Maintain a consistent style for similar text elements throughout your visualization.
Relevance: Only add text that provides valuable information or context to your plot.
Brevity: Keep text concise to avoid cluttering your plot.
Here’s an example that demonstrates these best practices: