How to Create Multiple Buttons in Matplotlib

How to Create Multiple Buttons in Matplotlib

Create Multiple Buttons in Matplotlib is an essential skill for data visualization enthusiasts and professionals alike. This article will delve deep into the process of creating multiple buttons in Matplotlib, providing you with a thorough understanding of the concept and its implementation. We’ll explore various techniques, best practices, and real-world examples to help you master the art of creating multiple buttons in Matplotlib.

Understanding the Basics of Creating Multiple Buttons in Matplotlib

Before we dive into the intricacies of creating multiple buttons in Matplotlib, it’s crucial to understand the fundamental concepts. Matplotlib is a powerful plotting library for Python that allows users to create a wide range of static, animated, and interactive visualizations. When it comes to creating multiple buttons in Matplotlib, we’re essentially adding interactive elements to our plots, enabling users to control various aspects of the visualization dynamically.

Let’s start with a simple example of creating multiple buttons in Matplotlib:

import matplotlib.pyplot as plt
from matplotlib.widgets import Button

fig, ax = plt.subplots()
plt.subplots_adjust(bottom=0.2)

def button1_click(event):
    print("Button 1 clicked - how2matplotlib.com")

def button2_click(event):
    print("Button 2 clicked - how2matplotlib.com")

ax_button1 = plt.axes([0.2, 0.05, 0.1, 0.075])
ax_button2 = plt.axes([0.7, 0.05, 0.1, 0.075])

button1 = Button(ax_button1, 'Button 1')
button2 = Button(ax_button2, 'Button 2')

button1.on_clicked(button1_click)
button2.on_clicked(button2_click)

plt.show()

Output:
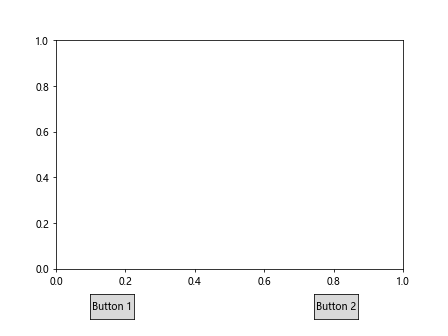
How to Create Multiple Buttons in Matplotlib

In this example, we create two buttons using the Button class from matplotlib.widgets. Each button is associated with a specific function that gets called when the button is clicked. This demonstrates the basic structure of creating multiple buttons in Matplotlib.

Advanced Techniques for Creating Multiple Buttons in Matplotlib

Now that we’ve covered the basics, let’s explore some advanced techniques for creating multiple buttons in Matplotlib. These techniques will allow you to create more complex and interactive visualizations.

Creating a Grid of Buttons

When creating multiple buttons in Matplotlib, you might want to arrange them in a grid layout. Here’s an example of how to achieve this:

import matplotlib.pyplot as plt
from matplotlib.widgets import Button
import numpy as np

fig, ax = plt.subplots()
plt.subplots_adjust(bottom=0.3)

def button_click(label):
    print(f"{label} clicked - how2matplotlib.com")

n_rows, n_cols = 2, 3
buttons = []

for i in range(n_rows):
    for j in range(n_cols):
        ax_button = plt.axes([0.1 + j*0.3, 0.05 + i*0.1, 0.1, 0.075])
        label = f"Button {i*n_cols + j + 1}"
        button = Button(ax_button, label)
        button.on_clicked(lambda event, label=label: button_click(label))
        buttons.append(button)

plt.show()

Output:
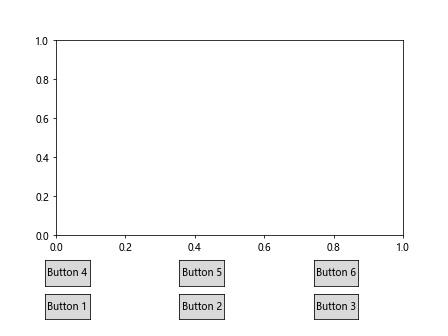
How to Create Multiple Buttons in Matplotlib

This example creates a 2×3 grid of buttons, demonstrating how to create multiple buttons in Matplotlib arranged in a structured layout.

Creating Toggle Buttons

Toggle buttons are a special type of button that can be in one of two states: on or off. Here’s how you can create multiple toggle buttons in Matplotlib:

import matplotlib.pyplot as plt
from matplotlib.widgets import CheckButtons

fig, ax = plt.subplots()
plt.subplots_adjust(left=0.2)

x = range(10)
lines = [plt.plot(x, [i*x for x in range(10)])[0] for i in range(3)]

def toggle_visibility(label):
    index = labels.index(label)
    lines[index].set_visible(not lines[index].get_visible())
    plt.draw()

labels = ['Line 1 - how2matplotlib.com', 'Line 2 - how2matplotlib.com', 'Line 3 - how2matplotlib.com']
visibility = [True, True, True]

ax_check = plt.axes([0.05, 0.4, 0.1, 0.15])
check_buttons = CheckButtons(ax_check, labels, visibility)
check_buttons.on_clicked(toggle_visibility)

plt.show()

Output:
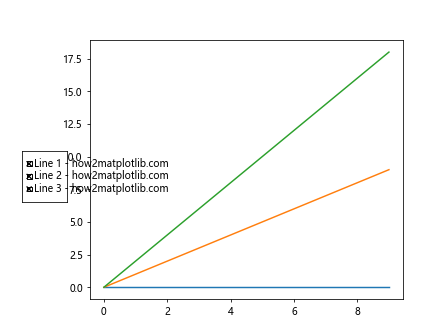
How to Create Multiple Buttons in Matplotlib

This example demonstrates how to create multiple toggle buttons in Matplotlib to control the visibility of different plot lines.

Customizing Button Appearance when Creating Multiple Buttons in Matplotlib

When creating multiple buttons in Matplotlib, you might want to customize their appearance to match your visualization’s style or to make them more visually appealing. Let’s explore some ways to achieve this.

Changing Button Colors

You can change the colors of your buttons when creating multiple buttons in Matplotlib. Here’s an example:

import matplotlib.pyplot as plt
from matplotlib.widgets import Button

fig, ax = plt.subplots()
plt.subplots_adjust(bottom=0.2)

def button_click(label):
    print(f"{label} clicked - how2matplotlib.com")

colors = ['red', 'green', 'blue', 'yellow']
buttons = []

for i, color in enumerate(colors):
    ax_button = plt.axes([0.1 + i*0.2, 0.05, 0.1, 0.075])
    label = f"Button {i+1}"
    button = Button(ax_button, label, color=color, hovercolor='0.975')
    button.on_clicked(lambda event, label=label: button_click(label))
    buttons.append(button)

plt.show()

Output:
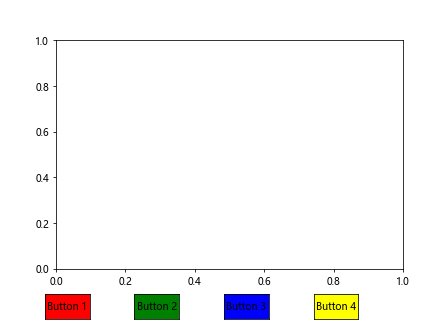
How to Create Multiple Buttons in Matplotlib

This example creates multiple buttons in Matplotlib with different colors, demonstrating how to customize the appearance of each button individually.

Adding Icons to Buttons

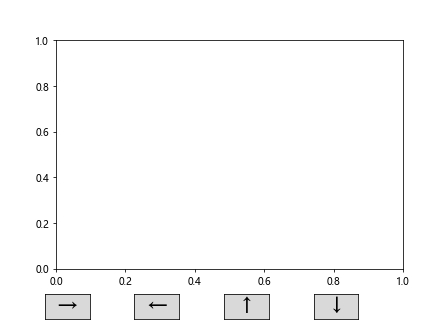
To make your buttons more intuitive, you might want to add icons when creating multiple buttons in Matplotlib. Here’s how you can do that:

import matplotlib.pyplot as plt
from matplotlib.widgets import Button
import numpy as np

fig, ax = plt.subplots()
plt.subplots_adjust(bottom=0.2)

def button_click(label):
    print(f"{label} clicked - how2matplotlib.com")

icons = ['→', '←', '↑', '↓']
buttons = []

for i, icon in enumerate(icons):
    ax_button = plt.axes([0.1 + i*0.2, 0.05, 0.1, 0.075])
    label = f"Button {i+1}"
    button = Button(ax_button, icon)
    button.label.set_fontsize(20)
    button.on_clicked(lambda event, label=label: button_click(label))
    buttons.append(button)

plt.show()

Output:
How to Create Multiple Buttons in Matplotlib

This example demonstrates how to create multiple buttons in Matplotlib with custom icons, enhancing the visual appeal and intuitiveness of your buttons.

Implementing Button Functionality when Creating Multiple Buttons in Matplotlib

Creating multiple buttons in Matplotlib is not just about appearance; it’s also about functionality. Let’s explore how to implement various functionalities for your buttons.

Updating Plot Data

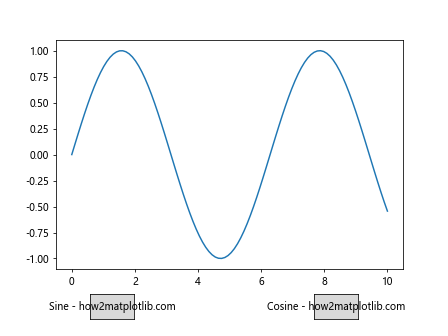
One common use case when creating multiple buttons in Matplotlib is to update the plot data dynamically. Here’s an example:

import matplotlib.pyplot as plt
from matplotlib.widgets import Button
import numpy as np

fig, ax = plt.subplots()
plt.subplots_adjust(bottom=0.2)

x = np.linspace(0, 10, 100)
line, = ax.plot(x, np.sin(x))

def update_sine(event):
    line.set_ydata(np.sin(x))
    fig.canvas.draw()

def update_cosine(event):
    line.set_ydata(np.cos(x))
    fig.canvas.draw()

ax_sine = plt.axes([0.2, 0.05, 0.1, 0.075])
ax_cosine = plt.axes([0.7, 0.05, 0.1, 0.075])

btn_sine = Button(ax_sine, 'Sine - how2matplotlib.com')
btn_cosine = Button(ax_cosine, 'Cosine - how2matplotlib.com')

btn_sine.on_clicked(update_sine)
btn_cosine.on_clicked(update_cosine)

plt.show()

Output:
How to Create Multiple Buttons in Matplotlib

This example shows how to create multiple buttons in Matplotlib that update the plot data between sine and cosine functions when clicked.

Zooming and Panning

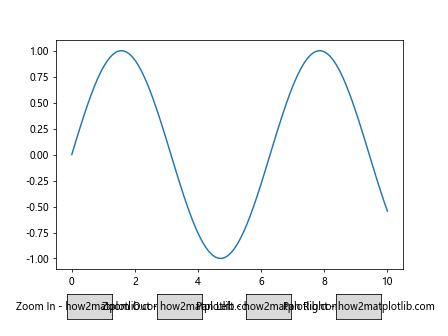
Another useful functionality when creating multiple buttons in Matplotlib is to implement zooming and panning controls. Here’s how you can do that:

import matplotlib.pyplot as plt
from matplotlib.widgets import Button
import numpy as np

fig, ax = plt.subplots()
plt.subplots_adjust(bottom=0.2)

x = np.linspace(0, 10, 100)
line, = ax.plot(x, np.sin(x))

def zoom_in(event):
    ax.set_xlim(ax.get_xlim()[0] * 1.5, ax.get_xlim()[1] * 0.5)
    fig.canvas.draw()

def zoom_out(event):
    ax.set_xlim(ax.get_xlim()[0] * 0.5, ax.get_xlim()[1] * 1.5)
    fig.canvas.draw()

def pan_left(event):
    xlim = ax.get_xlim()
    ax.set_xlim(xlim[0] - 1, xlim[1] - 1)
    fig.canvas.draw()

def pan_right(event):
    xlim = ax.get_xlim()
    ax.set_xlim(xlim[0] + 1, xlim[1] + 1)
    fig.canvas.draw()

buttons = [
    ('Zoom In - how2matplotlib.com', zoom_in, [0.15, 0.05, 0.1, 0.075]),
    ('Zoom Out - how2matplotlib.com', zoom_out, [0.35, 0.05, 0.1, 0.075]),
    ('Pan Left - how2matplotlib.com', pan_left, [0.55, 0.05, 0.1, 0.075]),
    ('Pan Right - how2matplotlib.com', pan_right, [0.75, 0.05, 0.1, 0.075])
]

for label, func, pos in buttons:
    ax_button = plt.axes(pos)
    button = Button(ax_button, label)
    button.on_clicked(func)

plt.show()

Output:
How to Create Multiple Buttons in Matplotlib

This example demonstrates how to create multiple buttons in Matplotlib that allow users to zoom in, zoom out, and pan the plot.

Best Practices for Creating Multiple Buttons in Matplotlib

When creating multiple buttons in Matplotlib, it’s important to follow some best practices to ensure your visualizations are user-friendly and efficient. Here are some tips to keep in mind:

  1. Consistent Layout: When creating multiple buttons in Matplotlib, maintain a consistent layout for your buttons. This makes your interface more intuitive and easier to use.

  2. Clear Labels: Use clear and concise labels for your buttons. This helps users understand the function of each button at a glance.

  3. Appropriate Sizing: Make sure your buttons are large enough to be easily clickable, but not so large that they dominate the plot area.

  4. Color Coding: Use color coding wisely when creating multiple buttons in Matplotlib. Colors can help differentiate between button types or functions.

  5. Responsive Design: Ensure your buttons work well with different figure sizes and screen resolutions.

Let’s implement these best practices in an example:

import matplotlib.pyplot as plt
from matplotlib.widgets import Button
import numpy as np

fig, ax = plt.subplots(figsize=(10, 6))
plt.subplots_adjust(bottom=0.2)

x = np.linspace(0, 10, 100)
line, = ax.plot(x, np.sin(x))

def update_function(func):
    line.set_ydata(func(x))
    ax.relim()
    ax.autoscale_view()
    fig.canvas.draw()

def sine(event):
    update_function(np.sin)

def cosine(event):
    update_function(np.cos)

def tangent(event):
    update_function(np.tan)

button_params = [
    ('Sine - how2matplotlib.com', sine, 'lightblue'),
    ('Cosine - how2matplotlib.com', cosine, 'lightgreen'),
    ('Tangent - how2matplotlib.com', tangent, 'lightpink')
]

buttons = []
for i, (label, func, color) in enumerate(button_params):
    ax_button = plt.axes([0.2 + i*0.2, 0.05, 0.15, 0.075])
    button = Button(ax_button, label, color=color, hovercolor='0.975')
    button.on_clicked(func)
    buttons.append(button)

plt.show()

Output:

How to Create Multiple Buttons in Matplotlib

This example demonstrates best practices for creating multiple buttons in Matplotlib, including consistent layout, clear labels, appropriate sizing, and color coding.

Advanced Topics in Creating Multiple Buttons in Matplotlib

As you become more proficient in creating multiple buttons in Matplotlib, you might want to explore some advanced topics. Let’s look at a few of these.

Creating Dropdown Menus

While not strictly buttons, dropdown menus can be a useful alternative when you have many options to choose from. Here’s how you can create a dropdown menu in Matplotlib:

import matplotlib.pyplot as plt
from matplotlib.widgets import Button, RadioButtons
import numpy as np

fig, ax = plt.subplots()
plt.subplots_adjust(left=0.3, bottom=0.2)

x = np.linspace(0, 10, 100)
line, = ax.plot(x, np.sin(x))

def update_function(label):
    if label == 'Sine - how2matplotlib.com':
        y = np.sin(x)
    elif label == 'Cosine - how2matplotlib.com':
        y = np.cos(x)
    elif label == 'Tangent - how2matplotlib.com':
        y = np.tan(x)
    line.set_ydata(y)
    ax.relim()
    ax.autoscale_view()
    fig.canvas.draw()

ax_radio = plt.axes([0.05, 0.4, 0.2, 0.15])
radio = RadioButtons(ax_radio, ('Sine - how2matplotlib.com', 'Cosine - how2matplotlib.com', 'Tangent - how2matplotlib.com'))
radio.on_clicked(update_function)

plt.show()

Output:

How to Create Multiple Buttons in Matplotlib

This example shows how to create a dropdown-like menu using RadioButtons in Matplotlib, which can be an alternative to creating multiple buttons in some scenarios.

Creating Sliders

Sliders can be a great complement to buttons when you want to allow continuous adjustment of parameters. Here’s an example of combining buttons and sliders:

import matplotlib.pyplot as plt
from matplotlib.widgets import Button, Slider
import numpy as np

fig, ax = plt.subplots()
plt.subplots_adjust(left=0.1, bottom=0.3)

x = np.linspace(0, 10, 100)
line, = ax.plot(x, np.sin(x))

freq = 1
amp = 1

def update(val):
    global freq, amp
    freq = sfreq.val
    amp = samp.val
    line.set_ydata(amp * np.sin(freq * x))
    fig.canvas.draw_idle()

def reset(event):
    sfreq.reset()
    samp.reset()

ax_freq = plt.axes([0.1, 0.15, 0.65, 0.03])
ax_amp = plt.axes([0.1, 0.1, 0.65, 0.03])
ax_button= plt.axes([0.8, 0.025, 0.1, 0.04])

sfreq = Slider(ax_freq, 'Frequency - how2matplotlib.com', 0.1, 10.0, valinit=freq)
samp = Slider(ax_amp, 'Amplitude - how2matplotlib.com', 0.1, 10.0, valinit=amp)
button = Button(ax_button, 'Reset')

sfreq.on_changed(update)
samp.on_changed(update)
button.on_clicked(reset)

plt.show()

Output:

How to Create Multiple Buttons in Matplotlib

This example demonstrates how to create multiple buttons in Matplotlib alongside sliders, allowing for both discrete and continuous control of plot parameters.

Handling Multiple Button Events in Matplotlib

When creating multiple buttons in Matplotlib, it’s important to handle button events efficiently, especially when you have many buttons or complex interactions. Let’s explore some strategies for handling multiple button events.

Using a Single Event Handler

One approach is to use a single event handler function for all buttons and differentiate the actions based on the button that was clicked. Here’s an example:

import matplotlib.pyplot as plt
from matplotlib.widgets import Button
import numpy as np

fig, ax = plt.subplots()
plt.subplots_adjust(bottom=0.2)

x = np.linspace(0, 10, 100)
line, = ax.plot(x, np.sin(x))

def button_click(event):
    label = event.inaxes.button.label.get_text()
    if label == 'Sine - how2matplotlib.com':
        line.set_ydata(np.sin(x))
    elif label == 'Cosine - how2matplotlib.com':
        line.set_ydata(np.cos(x))
    elif label == 'Tangent - how2matplotlib.com':
        line.set_ydata(np.tan(x))
    fig.canvas.draw()

button_params = [
    ('Sine - how2matplotlib.com', [0.2, 0.05, 0.2, 0.075]),
    ('Cosine - how2matplotlib.com', [0.45, 0.05, 0.2, 0.075]),
    ('Tangent - how2matplotlib.com', [0.7, 0.05, 0.2, 0.075])
]

buttons = []
for label, pos in button_params:
    ax_button = plt.axes(pos)
    button = Button(ax_button, label)
    button.on_clicked(button_click)
    buttons.append(button)

plt.show()

Output:

How to Create Multiple Buttons in Matplotlib

This example demonstrates how to handle events from multiple buttons in Matplotlib using a single event handler function.

Using Classes for Button Management

For more complex scenarios when creating multiple buttons in Matplotlib, you might want to use a class-based approach to manage your buttons and their functionality. Here’s an example:

import matplotlib.pyplot as plt
from matplotlib.widgets import Button
import numpy as np

class ButtonManager:
    def __init__(self, fig, ax):
        self.fig = fig
        self.ax = ax
        self.buttons = []

        x = np.linspace(0, 10, 100)
        self.line, = ax.plot(x, np.sin(x))

        self.create_buttons()

    def create_buttons(self):
        button_params = [
            ('Sine - how2matplotlib.com', self.update_sine, [0.2, 0.05, 0.2, 0.075]),
            ('Cosine - how2matplotlib.com', self.update_cosine, [0.45, 0.05, 0.2, 0.075]),
            ('Tangent - how2matplotlib.com', self.update_tangent, [0.7, 0.05, 0.2, 0.075])
        ]

        for label, func, pos in button_params:
            ax_button = plt.axes(pos)
            button = Button(ax_button, label)
            button.on_clicked(func)
            self.buttons.append(button)

    def update_sine(self, event):
        self.line.set_ydata(np.sin(np.linspace(0, 10, 100)))
        self.fig.canvas.draw()

    def update_cosine(self, event):
        self.line.set_ydata(np.cos(np.linspace(0, 10, 100)))
        self.fig.canvas.draw()

    def update_tangent(self, event):
        self.line.set_ydata(np.tan(np.linspace(0, 10, 100)))
        self.fig.canvas.draw()

fig, ax = plt.subplots()
plt.subplots_adjust(bottom=0.2)

button_manager = ButtonManager(fig, ax)

plt.show()

Output:

How to Create Multiple Buttons in Matplotlib

This example shows how to use a class-based approach to manage multiple buttons in Matplotlib, which can be particularly useful for more complex visualizations.

Creating Responsive Layouts when Creating Multiple Buttons in Matplotlib

When creating multiple buttons in Matplotlib, it’s important to consider how your visualization will look on different screen sizes and resolutions. Here’s an example of how to create a responsive layout for your buttons:

import matplotlib.pyplot as plt
from matplotlib.widgets import Button
import numpy as np

def create_responsive_buttons(fig, ax):
    def update_button_positions(event):
        fig_width = fig.get_figwidth()
        fig_height = fig.get_figheight()

        button_width = 0.2 * fig_width
        button_height = 0.05 * fig_height
        button_bottom = 0.05 * fig_height

        for i, button in enumerate(buttons):
            left = 0.1 + i * (button_width + 0.05 * fig_width)
            button.ax.set_position([left / fig_width, button_bottom / fig_height, 
                                    button_width / fig_width, button_height / fig_height])

    def button_click(label):
        print(f"{label} clicked - how2matplotlib.com")

    buttons = []
    labels = ['Button 1', 'Button 2', 'Button 3']

    for i, label in enumerate(labels):
        ax_button = fig.add_axes([0, 0, 0.1, 0.1])  # Temporary position
        button = Button(ax_button, f"{label} - how2matplotlib.com")
        button.on_clicked(lambda event, l=label: button_click(l))
        buttons.append(button)

    update_button_positions(None)
    fig.canvas.mpl_connect('resize_event', update_button_positions)

    return buttons

fig, ax = plt.subplots()
plt.subplots_adjust(bottom=0.2)

x = np.linspace(0, 10, 100)
ax.plot(x, np.sin(x))

buttons = create_responsive_buttons(fig, ax)

plt.show()

Output:

How to Create Multiple Buttons in Matplotlib

This example demonstrates how to create multiple buttons in Matplotlib with a responsive layout that adjusts to the figure size.

Combining Multiple Button Types in Matplotlib

When creating multiple buttons in Matplotlib, you might want to combine different types of buttons to create a more versatile user interface. Here’s an example that combines regular buttons, toggle buttons, and radio buttons:

import matplotlib.pyplot as plt
from matplotlib.widgets import Button, CheckButtons, RadioButtons
import numpy as np

fig, ax = plt.subplots(figsize=(10, 6))
plt.subplots_adjust(left=0.3, bottom=0.25)

x = np.linspace(0, 10, 100)
lines = [ax.plot(x, np.sin(x), label='Sine - how2matplotlib.com')[0],
         ax.plot(x, np.cos(x), label='Cosine - how2matplotlib.com')[0],
         ax.plot(x, np.tan(x), label='Tangent - how2matplotlib.com')[0]]

ax.legend()

def update_amplitude(amp):
    for line in lines:
        y = line.get_ydata()
        line.set_ydata(y * amp)
    fig.canvas.draw_idle()

def toggle_visibility(label):
    index = labels.index(label)
    lines[index].set_visible(not lines[index].get_visible())
    fig.canvas.draw_idle()

def change_color(label):
    for line in lines:
        line.set_color(label.lower())
    fig.canvas.draw_idle()

# Regular buttons
ax_amp_up = plt.axes([0.8, 0.05, 0.1, 0.075])
ax_amp_down = plt.axes([0.65, 0.05, 0.1, 0.075])
btn_amp_up = Button(ax_amp_up, 'Amp Up - how2matplotlib.com')
btn_amp_down = Button(ax_amp_down, 'Amp Down - how2matplotlib.com')
btn_amp_up.on_clicked(lambda event: update_amplitude(1.1))
btn_amp_down.on_clicked(lambda event: update_amplitude(0.9))

# Toggle buttons
labels = ['Sine - how2matplotlib.com', 'Cosine - how2matplotlib.com', 'Tangent - how2matplotlib.com']
visibility = [True, True, True]
ax_check = plt.axes([0.05, 0.4, 0.1, 0.15])
check = CheckButtons(ax_check, labels, visibility)
check.on_clicked(toggle_visibility)

# Radio buttons
ax_radio = plt.axes([0.05, 0.1, 0.1, 0.15])
radio = RadioButtons(ax_radio, ('Red', 'Green', 'Blue'))
radio.on_clicked(change_color)

plt.show()

Output:

How to Create Multiple Buttons in Matplotlib

This example demonstrates how to create and combine multiple types of buttons in Matplotlib, including regular buttons for amplitude control, toggle buttons for line visibility, and radio buttons for color selection.

Conclusion

Creating multiple buttons in Matplotlib is a powerful technique that allows you to add interactivity to your visualizations. Throughout this article, we’ve explored various aspects of creating multiple buttons in Matplotlib, from basic implementation to advanced techniques and best practices.

We’ve covered topics such as:
– Basic button creation and functionality
– Advanced techniques like creating grids of buttons and toggle buttons
– Customizing button appearance
– Implementing various button functionalities
– Best practices for creating user-friendly interfaces
– Handling multiple button events
– Creating responsive layouts
– Combining different types of buttons

By mastering these techniques for creating multiple buttons in Matplotlib, you’ll be able to create more engaging and interactive data visualizations. Remember to always consider your users’ needs and the overall design of your visualization when implementing buttons.

Like(0)