How to Set Matplotlib Figure Size in Pixels
Matplotlib figure size in pixels is a crucial aspect of data visualization that allows you to control the dimensions of your plots with precision. By mastering the techniques to set matplotlib figure size in pixels, you can create visually appealing and professional-looking graphs that fit perfectly into your presentations, reports, or web pages. This comprehensive guide will explore various methods to adjust matplotlib figure size in pixels, providing you with the knowledge and tools to customize your plots effectively.
Understanding Matplotlib Figure Size in Pixels
Before diving into the specifics of setting matplotlib figure size in pixels, it’s essential to understand what figure size means in the context of Matplotlib. The figure size refers to the overall dimensions of the plot, including the axes, labels, and any additional elements. By default, Matplotlib uses inches as the unit for figure size, but we can easily convert this to pixels for more precise control.
When working with matplotlib figure size in pixels, you have the flexibility to define both the width and height of your plot. This allows you to create plots that fit perfectly into your desired layout or match specific requirements for publication or display.
Let’s start with a basic example of setting matplotlib figure size in pixels:
import matplotlib.pyplot as plt

# Set the figure size in pixels
plt.figure(figsize=(800/100, 600/100))  # 800x600 pixels

# Create a simple plot
plt.plot([1, 2, 3, 4], [1, 4, 2, 3])
plt.title("How to set matplotlib figure size in pixels - how2matplotlib.com")
plt.xlabel("X-axis")
plt.ylabel("Y-axis")

# Display the plot
plt.show()
Output:
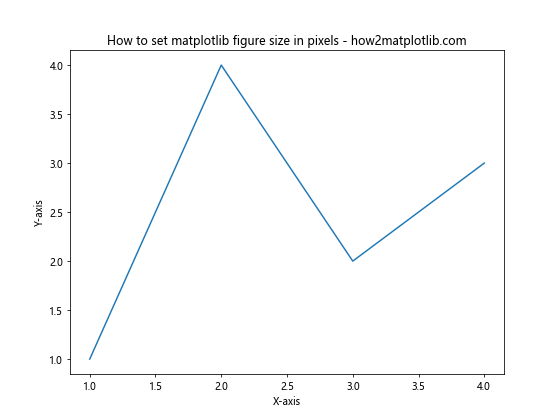
In this example, we set the matplotlib figure size in pixels to 800×600 by dividing the desired pixel values by 100. This is because Matplotlib’s figsize parameter expects values in inches, and there are approximately 100 pixels per inch on most displays.
Converting Pixels to Inches for Matplotlib Figure Size
To set matplotlib figure size in pixels accurately, we need to convert pixels to inches. This conversion is necessary because Matplotlib’s figsize parameter expects values in inches. Here’s a simple function to help with this conversion:
import matplotlib.pyplot as plt

def pixels_to_inches(pixels, dpi=100):
    return pixels / dpi

# Set the figure size in pixels
width_px, height_px = 1024, 768
fig = plt.figure(figsize=(pixels_to_inches(width_px), pixels_to_inches(height_px)))

# Create a simple plot
plt.plot([1, 2, 3, 4], [1, 4, 2, 3])
plt.title("Matplotlib figure size in pixels - how2matplotlib.com")
plt.xlabel("X-axis")
plt.ylabel("Y-axis")

# Display the plot
plt.show()
Output:
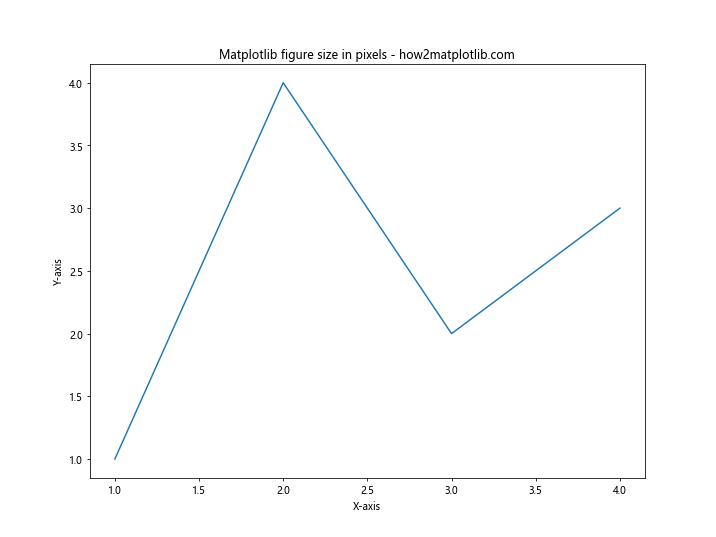
In this example, we define a pixels_to_inches function that converts pixels to inches based on a given DPI (dots per inch) value. By default, we use 100 DPI, which is a common value for most displays. This function allows us to set matplotlib figure size in pixels more accurately.
Setting Matplotlib Figure Size in Pixels with Different DPI Values
The DPI (dots per inch) value plays a crucial role in determining the actual size of your matplotlib figure in pixels. By adjusting the DPI, you can fine-tune the resolution and size of your plot. Let’s explore how to set matplotlib figure size in pixels while considering different DPI values:
import matplotlib.pyplot as plt

def set_figure_size_pixels(width_px, height_px, dpi=100):
    width_inches = width_px / dpi
    height_inches = height_px / dpi
    fig = plt.figure(figsize=(width_inches, height_inches), dpi=dpi)
    return fig

# Set the figure size in pixels with custom DPI
fig = set_figure_size_pixels(1200, 800, dpi=150)

# Create a simple plot
plt.plot([1, 2, 3, 4], [1, 4, 2, 3])
plt.title("Matplotlib figure size in pixels with custom DPI - how2matplotlib.com")
plt.xlabel("X-axis")
plt.ylabel("Y-axis")

# Display the plot
plt.show()
Output:
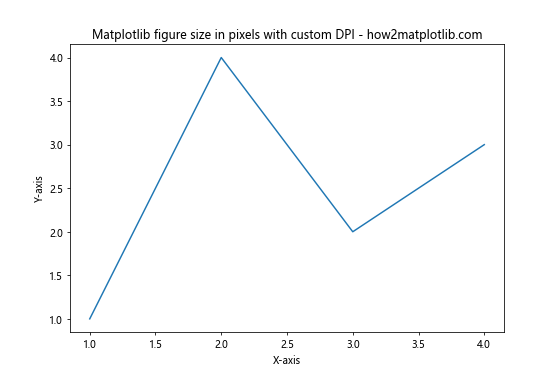
In this example, we define a set_figure_size_pixels function that takes the desired width and height in pixels, as well as an optional DPI value. This function calculates the appropriate figure size in inches based on the given pixel dimensions and DPI, allowing you to set matplotlib figure size in pixels with precision.
Adjusting Matplotlib Figure Size in Pixels for Subplots
When working with subplots, setting matplotlib figure size in pixels becomes even more important to ensure proper layout and spacing. Here’s an example of how to adjust the figure size for a grid of subplots:
import matplotlib.pyplot as plt
import numpy as np

def set_figure_size_pixels(width_px, height_px, dpi=100):
    width_inches = width_px / dpi
    height_inches = height_px / dpi
    fig = plt.figure(figsize=(width_inches, height_inches), dpi=dpi)
    return fig

# Set the figure size in pixels for subplots
fig = set_figure_size_pixels(1600, 1200, dpi=120)

# Create a 2x2 grid of subplots
for i in range(4):
    ax = fig.add_subplot(2, 2, i+1)
    x = np.linspace(0, 10, 100)
    y = np.sin(x) + np.random.random(100) * 0.5
    ax.plot(x, y)
    ax.set_title(f"Subplot {i+1} - how2matplotlib.com")
    ax.set_xlabel("X-axis")
    ax.set_ylabel("Y-axis")

# Adjust spacing between subplots
plt.tight_layout()

# Display the plot
plt.show()
Output:
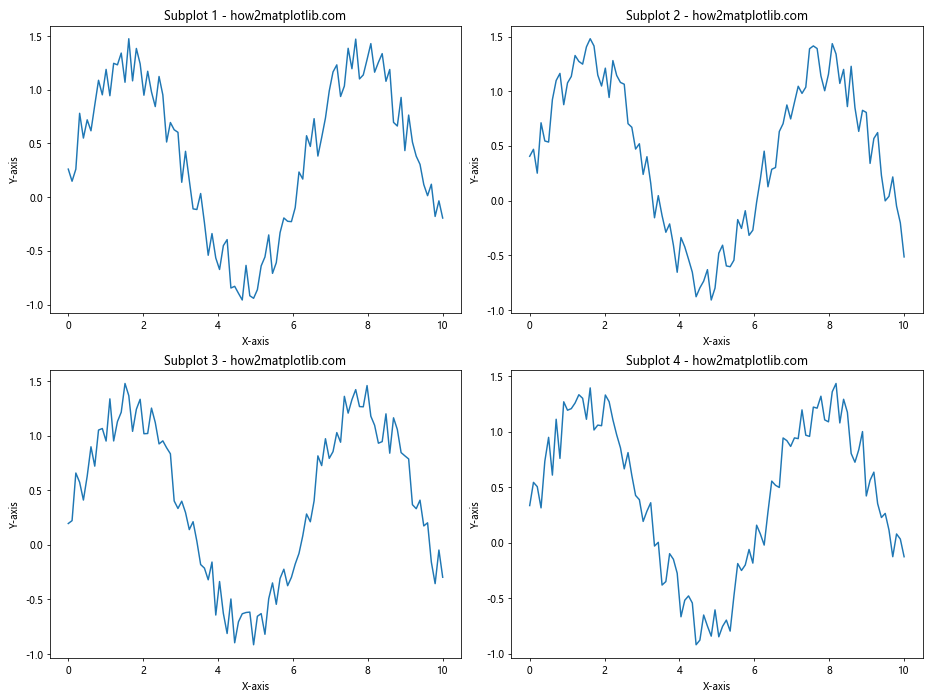
In this example, we use the set_figure_size_pixels function to set the overall figure size for a 2×2 grid of subplots. By adjusting the matplotlib figure size in pixels, we ensure that each subplot has enough space to display its content clearly.
Dynamic Matplotlib Figure Size in Pixels Based on Content
Sometimes, you may want to set matplotlib figure size in pixels dynamically based on the content of your plot. This can be particularly useful when dealing with varying amounts of data or different plot types. Here’s an example of how to adjust the figure size based on the number of data points:
import matplotlib.pyplot as plt
import numpy as np

def dynamic_figure_size(data_points, base_size=500, scaling_factor=10):
    size = base_size + (len(data_points) * scaling_factor)
    return size / 100  # Convert to inches

# Generate random data
x = np.random.rand(50)
y = np.random.rand(50)

# Set dynamic figure size based on number of data points
fig_size = dynamic_figure_size(x)
plt.figure(figsize=(fig_size, fig_size))

# Create a scatter plot
plt.scatter(x, y)
plt.title("Dynamic matplotlib figure size in pixels - how2matplotlib.com")
plt.xlabel("X-axis")
plt.ylabel("Y-axis")

# Display the plot
plt.show()
Output:
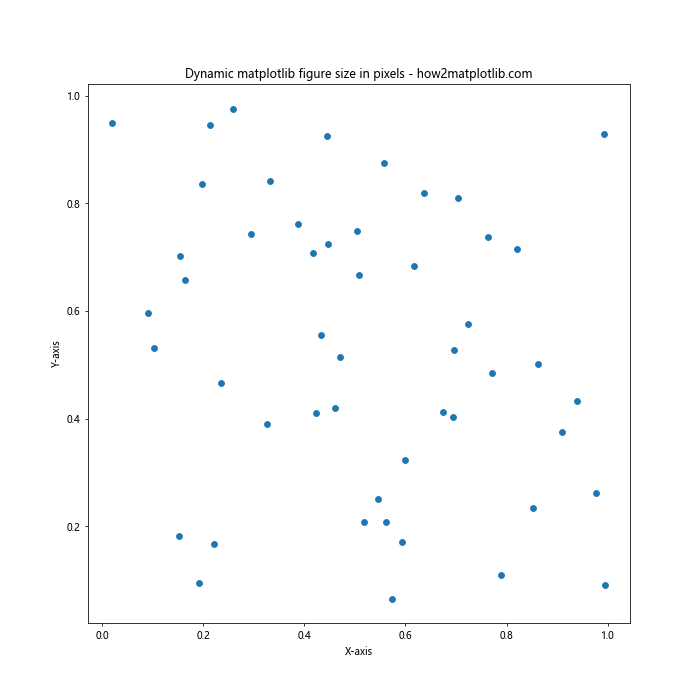
In this example, we define a dynamic_figure_size function that calculates the figure size based on the number of data points. This allows us to set matplotlib figure size in pixels dynamically, ensuring that the plot has enough space to display all the data points clearly.
Saving Matplotlib Figures with Specific Pixel Dimensions
When saving matplotlib figures, it’s often crucial to set the output size in pixels precisely. This is particularly important for web applications or when preparing images for publication. Here’s how to save a matplotlib figure with specific pixel dimensions:
import matplotlib.pyplot as plt
import numpy as np

def save_figure_pixels(fig, filename, width_px, height_px, dpi=100):
    fig.set_size_inches(width_px / dpi, height_px / dpi)
    fig.savefig(filename, dpi=dpi, bbox_inches='tight')

# Create a sample plot
x = np.linspace(0, 10, 100)
y = np.sin(x)

fig, ax = plt.subplots()
ax.plot(x, y)
ax.set_title("Saving matplotlib figure with specific pixel size - how2matplotlib.com")
ax.set_xlabel("X-axis")
ax.set_ylabel("Y-axis")

# Save the figure with specific pixel dimensions
save_figure_pixels(fig, "output_figure.png", width_px=1200, height_px=800, dpi=150)

plt.close(fig)
In this example, we define a save_figure_pixels function that takes a matplotlib figure, filename, desired width and height in pixels, and an optional DPI value. This function adjusts the figure size and saves the output with the specified dimensions, allowing you to set matplotlib figure size in pixels for saved images.
Adjusting Matplotlib Figure Size in Pixels for Different Plot Types
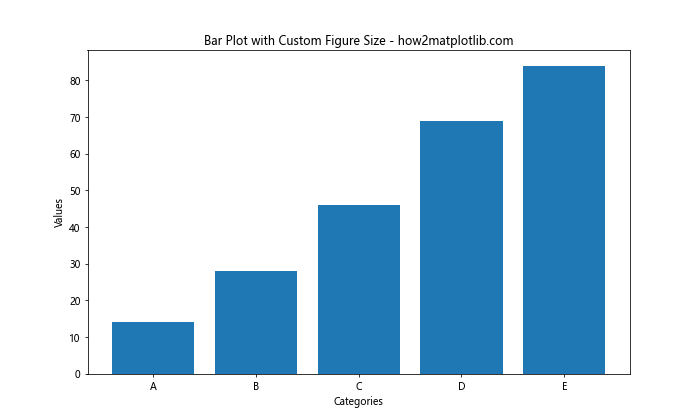
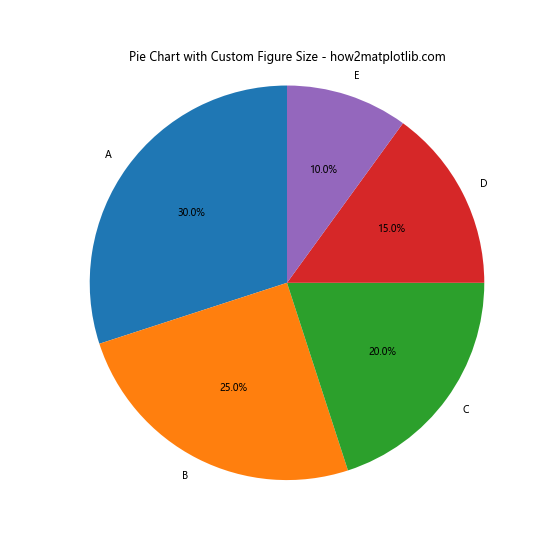
Different types of plots may require different figure sizes to display optimally. Let’s explore how to set matplotlib figure size in pixels for various plot types:
Bar Plot
import matplotlib.pyplot as plt
import numpy as np

def set_figure_size_pixels(width_px, height_px, dpi=100):
    width_inches = width_px / dpi
    height_inches = height_px / dpi
    fig = plt.figure(figsize=(width_inches, height_inches), dpi=dpi)
    return fig

# Set the figure size in pixels for a bar plot
fig = set_figure_size_pixels(1000, 600, dpi=100)

# Create sample data
categories = ['A', 'B', 'C', 'D', 'E']
values = np.random.randint(10, 100, len(categories))

# Create a bar plot
plt.bar(categories, values)
plt.title("Bar Plot with Custom Figure Size - how2matplotlib.com")
plt.xlabel("Categories")
plt.ylabel("Values")

# Display the plot
plt.show()
Output:
Pie Chart
import matplotlib.pyplot as plt
import numpy as np

def set_figure_size_pixels(width_px, height_px, dpi=100):
    width_inches = width_px / dpi
    height_inches = height_px / dpi
    fig = plt.figure(figsize=(width_inches, height_inches), dpi=dpi)
    return fig

# Set the figure size in pixels for a pie chart
fig = set_figure_size_pixels(800, 800, dpi=100)

# Create sample data
sizes = [30, 25, 20, 15, 10]
labels = ['A', 'B', 'C', 'D', 'E']

# Create a pie chart
plt.pie(sizes, labels=labels, autopct='%1.1f%%', startangle=90)
plt.title("Pie Chart with Custom Figure Size - how2matplotlib.com")

# Ensure the pie chart is circular
plt.axis('equal')

# Display the plot
plt.show()
Output:
Heatmap
import matplotlib.pyplot as plt
import numpy as np
import seaborn as sns

def set_figure_size_pixels(width_px, height_px, dpi=100):
    width_inches = width_px / dpi
    height_inches = height_px / dpi
    fig = plt.figure(figsize=(width_inches, height_inches), dpi=dpi)
    return fig

# Set the figure size in pixels for a heatmap
fig = set_figure_size_pixels(1200, 800, dpi=100)

# Create sample data
data = np.random.rand(10, 12)

# Create a heatmap
sns.heatmap(data, annot=True, cmap='YlGnBu')
plt.title("Heatmap with Custom Figure Size - how2matplotlib.com")
plt.xlabel("X-axis")
plt.ylabel("Y-axis")

# Display the plot
plt.show()
Output:
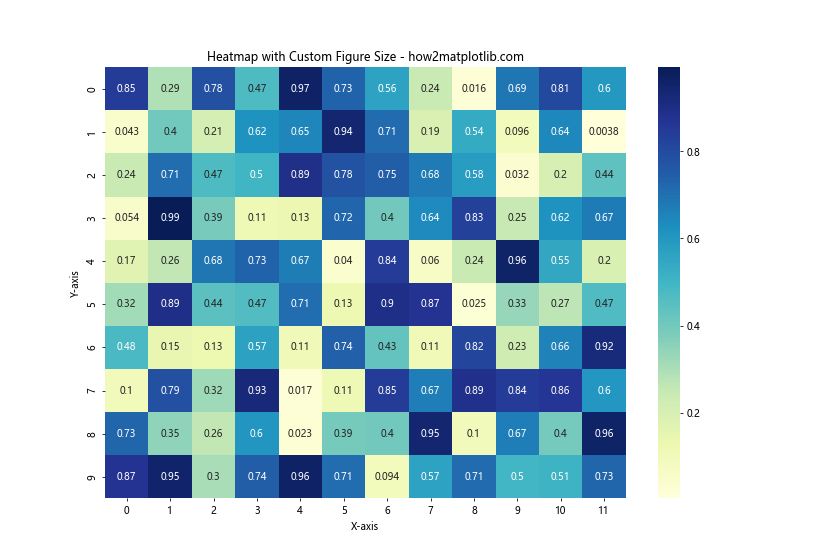
By adjusting the matplotlib figure size in pixels for different plot types, you can ensure that each visualization is displayed optimally and conveys its information effectively.
Responsive Matplotlib Figure Size in Pixels for Web Applications
When creating matplotlib figures for web applications, it’s often desirable to have responsive figure sizes that adapt to different screen sizes. While matplotlib itself doesn’t provide built-in responsiveness, you can achieve this by generating multiple figure sizes and using appropriate HTML and CSS. Here’s an example of how to create responsive matplotlib figures:
import matplotlib.pyplot as plt
import numpy as np
import io
import base64
def generate_responsive_figures(x, y, sizes):
figures = []
for size in sizes:
fig, ax = plt.subplots(figsize=(size[0]/100, size[1]/100), dpi=100)
ax.plot(x, y)
ax.set_title(f"Responsive Plot - {size[0]}x{size[1]} - how2matplotlib.com")
ax.set_xlabel("X-axis")
ax.set_ylabel("Y-axis")
buf = io.BytesIO()
fig.savefig(buf, format='png', bbox_inches='tight')
buf.seek(0)
img_str = base64.b64encode(buf.getvalue()).decode()
figures.append(f' ')
plt.close(fig)
return figures
# Generate sample data
x = np.linspace(0, 10, 100)
y = np.sin(x)
# Generate responsive figures
sizes = [(800, 600), (1024, 768), (1280, 960)]
responsive_figures = generate_responsive_figures(x, y, sizes)
# Create HTML with responsive figures
html_content = """
Responsive Matplotlib Figures
Responsive Matplotlib Figures - how2matplotlib.com
{}
""".format("\n".join(responsive_figures))
# Save the HTML file
with open("responsive_figures.html", "w") as f:
f.write(html_content)
print("Responsive figures HTML has been generated.")
In this example, we create a generate_responsive_figures function that generates multiple matplotlib figures with different sizes. These figures are then embedded in an HTML file using base64 encoding. The CSS max-width: 100% and height: auto properties ensure that the images scale responsively based on the screen size.
Fine-tuning Matplotlib Figure Size in Pixels for Publication
When preparing figures for publication, it’s crucial to set matplotlib figure size in pixels precisely to meet the journal’s requirements. Here’s an example of how to create publication-ready figures with specific pixel dimensions:
import matplotlib.pyplot as plt
import numpy as np

def publication_figure(width_px, height_px, dpi=300):
    width_inches = width_px / dpi
    height_inches = height_px / dpi
    fig, ax = plt.subplots(figsize=(width_inches, height_inches), dpi=dpi)
    return fig, ax

# Set the figure size for publication (e.g., 1200x900 pixels at 300 DPI)
fig, ax = publication_figure(1200, 900, dpi=300)

# Generate sample data
x = np.linspace(0, 10, 100)
y1 = np.sin(x)
y2 = np.cos(x)

# Create the plot
ax.plot(x, y1, label='Sin(x)')
ax.plot(x, y2, label='Cos(x)')
ax.set_title("Publication-ready Figure - how2matplotlib.com")
ax.set_xlabel("X-axis")
ax.set_ylabel("Y-axis")
ax.legend()

# Adjust layout and save the figure
plt.tight_layout()
plt.savefig("publication_figure.png", dpi=300, bbox_inches='tight')
plt.close(fig)

print("Publication-ready figure has been saved.")
In this example, we define a publication_figure function that creates a figure with specific pixel dimensions and DPI suitable for publication. By setting matplotlib figure size in pixels accurately, you can ensure that your figures meet the exact specifications required by journals or publishers.
Matplotlib Figure Size in Pixels for Different Aspect Ratios
When creating plots with specific aspect ratios, it’s important to set matplotlib figure size in pixels correctly to maintain the desired proportions. Here’s an example of how to create figures with different aspect ratios:
import matplotlib.pyplot as plt
import numpy as np

def aspect_ratio_figure(width_px, aspect_ratio, dpi=100):
    height_px = width_px / aspect_ratio
    width_inches = width_px / dpi
    height_inches = height_px / dpi
    fig, ax = plt.subplots(figsize=(width_inches, height_inches), dpi=dpi)
    return fig, ax

# Create figures with different aspect ratios
aspect_ratios = [16/9, 4/3, 1/1]
width_px = 1200

for ratio in aspect_ratios:
    fig, ax = aspect_ratio_figure(width_px, ratio)

    # Generate sample data
    x = np.linspace(0, 10, 100)
    y = np.sin(x) * np.exp(-0.1 * x)

    # Create the plot
    ax.plot(x, y)
    ax.set_title(f"Aspect Ratio {ratio:.2f} - how2matplotlib.com")
    ax.set_xlabel("X-axis")
    ax.set_ylabel("Y-axis")

    # Adjust layout and save the figure
    plt.tight_layout()
    plt.savefig(f"aspect_ratio_{ratio:.2f}.png", dpi=100, bbox_inches='tight')
    plt.close(fig)

print("Figures with different aspect ratios have been saved.")
In this example, we define an aspect_ratio_figure function that creates figures with specific aspect ratios while maintaining the desired width in pixels. This allows you to set matplotlib figure size in pixels while preserving the intended proportions of your plots.
Optimizing Matplotlib Figure Size in Pixels for Different Display Devices
When creating visualizations for various display devices, it’s essential to optimize matplotlib figure size in pixels to ensure optimal viewing experience across different screen sizes and resolutions. Here’s an example of how to create device-specific figure sizes:
import matplotlib.pyplot as plt
import numpy as np

def device_specific_figure(device, dpi=100):
    device_sizes = {
        'smartphone': (750, 1334),
        'tablet': (1668, 2224),
        'desktop': (1920, 1080),
        '4K': (3840, 2160)
    }

    if device not in device_sizes:
        raise ValueError("Unsupported device type")

    width_px, height_px = device_sizes[device]
    width_inches = width_px / dpi
    height_inches = height_px / dpi
    fig, ax = plt.subplots(figsize=(width_inches, height_inches), dpi=dpi)
    return fig, ax

# Generate sample data
x = np.linspace(0, 10, 100)
y = np.sin(x) * np.exp(-0.1 * x)

# Create figures for different devices
devices = ['smartphone', 'tablet', 'desktop', '4K']

for device in devices:
    fig, ax = device_specific_figure(device)

    # Create the plot
    ax.plot(x, y)
    ax.set_title(f"Optimized for {device} - how2matplotlib.com")
    ax.set_xlabel("X-axis")
    ax.set_ylabel("Y-axis")

    # Adjust layout and save the figure
    plt.tight_layout()
    plt.savefig(f"optimized_{device}.png", dpi=100, bbox_inches='tight')
    plt.close(fig)

print("Device-specific figures have been saved.")
In this example, we define a device_specific_figure function that creates figures with optimal sizes for different display devices. By setting matplotlib figure size in pixels based on common device resolutions, you can ensure that your visualizations look great on various screens.
Conclusion
Mastering the art of setting matplotlib figure size in pixels is crucial for creating professional-looking and precisely sized visualizations. Throughout this comprehensive guide, we’ve explored various techniques and best practices for adjusting matplotlib figure size in pixels, including:
- Converting between pixels and inches
- Adjusting DPI for different resolutions
- Creating responsive figures for web applications
- Optimizing figure sizes for publication
- Maintaining specific aspect ratios
- Tailoring figures for different display devices
By applying these techniques, you can ensure that your matplotlib figures are perfectly sized for any application, whether it’s for web display, print publication, or presentation across various devices. Remember to always consider the context in which your visualizations will be viewed and adjust the matplotlib figure size in pixels accordingly to achieve the best possible results.