How to Change Legend Background Using facecolor in MatplotLib
Change Legend background using facecolor in MatplotLib is an essential technique for customizing the appearance of your plots. This article will explore various methods and techniques to change the legend background color using the facecolor parameter in Matplotlib. We’ll cover everything from basic usage to advanced customization options, providing you with a thorough understanding of how to effectively use facecolor to enhance your legend’s appearance.
Understanding the Basics of Legend Background and facecolor in MatplotLib
Before we dive into the specifics of changing the legend background using facecolor in MatplotLib, let’s first understand what these terms mean and why they are important.
In Matplotlib, a legend is a key that helps identify the different elements in a plot. The legend background is the area behind the legend text and symbols. The facecolor parameter is used to set the color of this background area.
Changing the legend background color can be crucial for several reasons:
- Improved readability: A well-chosen background color can make the legend text stand out and easier to read.
- Aesthetic appeal: It can enhance the overall look of your plot, making it more visually appealing.
- Consistency with plot theme: You can match the legend background with your plot’s color scheme for a cohesive appearance.
Now, let’s look at a basic example of how to change legend background using facecolor in MatplotLib:
import matplotlib.pyplot as plt

# Create a simple plot
plt.plot([1, 2, 3, 4], [1, 4, 2, 3], label='Line 1')
plt.plot([1, 2, 3, 4], [2, 3, 4, 1], label='Line 2')

# Add a legend with a custom background color
plt.legend(facecolor='lightblue')

# Add a title with the website name
plt.title('Simple Plot - how2matplotlib.com')

# Display the plot
plt.show()
Output:
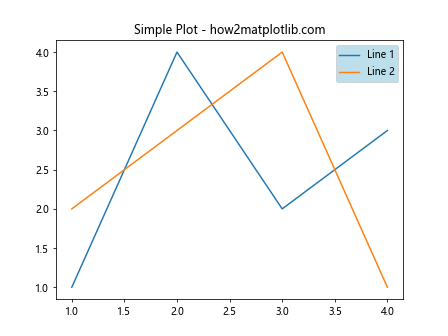
In this example, we create a simple plot with two lines and add a legend. The facecolor='lightblue' parameter in the plt.legend() function sets the background color of the legend to light blue. This is the most basic way to change legend background using facecolor in MatplotLib.
Advanced Techniques for Changing Legend Background Using facecolor in MatplotLib
While the basic method is straightforward, there are more advanced techniques you can use to change legend background using facecolor in MatplotLib. Let’s explore some of these methods:
Using RGB and RGBA Values
Instead of using named colors, you can use RGB (Red, Green, Blue) or RGBA (Red, Green, Blue, Alpha) values to set the facecolor. This gives you more precise control over the color:
import matplotlib.pyplot as plt

# Create a simple plot
plt.plot([1, 2, 3, 4], [1, 4, 2, 3], label='Line 1')
plt.plot([1, 2, 3, 4], [2, 3, 4, 1], label='Line 2')

# Add a legend with a custom background color using RGB values
plt.legend(facecolor=(0.9, 0.9, 0.9))  # Light gray

# Add a title with the website name
plt.title('RGB Facecolor - how2matplotlib.com')

# Display the plot
plt.show()
Output:
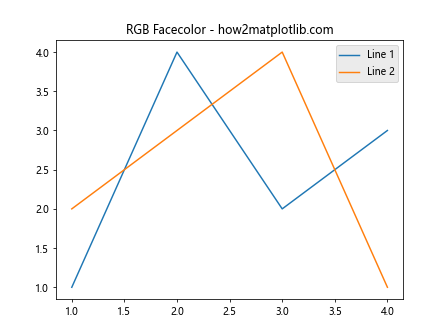
In this example, we use RGB values to set the facecolor to a light gray. Each value in the tuple represents the intensity of red, green, and blue respectively, ranging from 0 to 1.
You can also use RGBA values to include transparency:
import matplotlib.pyplot as plt

# Create a simple plot
plt.plot([1, 2, 3, 4], [1, 4, 2, 3], label='Line 1')
plt.plot([1, 2, 3, 4], [2, 3, 4, 1], label='Line 2')

# Add a legend with a semi-transparent background color
plt.legend(facecolor=(1, 0, 0, 0.3))  # Semi-transparent red

# Add a title with the website name
plt.title('RGBA Facecolor - how2matplotlib.com')

# Display the plot
plt.show()
Output:
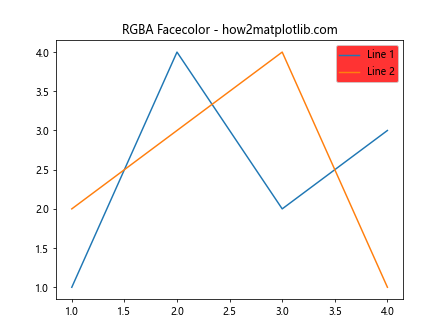
Here, the fourth value in the tuple (0.3) represents the alpha channel, which controls the transparency. A value of 0 is completely transparent, while 1 is fully opaque.
Using Hex Color Codes
Another way to change legend background using facecolor in MatplotLib is by using hex color codes:
import matplotlib.pyplot as plt

# Create a simple plot
plt.plot([1, 2, 3, 4], [1, 4, 2, 3], label='Line 1')
plt.plot([1, 2, 3, 4], [2, 3, 4, 1], label='Line 2')

# Add a legend with a custom background color using hex code
plt.legend(facecolor='#e6f2ff')  # Light blue

# Add a title with the website name
plt.title('Hex Code Facecolor - how2matplotlib.com')

# Display the plot
plt.show()
Output:
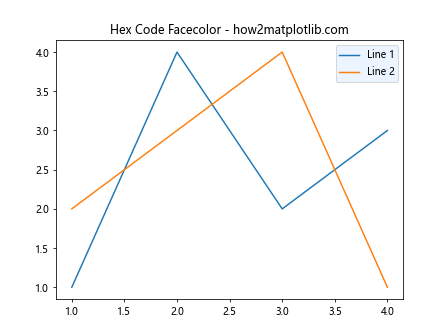
Hex color codes provide a wide range of color options and are widely used in web design, making it easy to match your plot’s colors with your website or presentation theme.
Customizing Legend Appearance Along with facecolor in MatplotLib
Changing the legend background using facecolor in MatplotLib is often just one part of customizing your legend’s appearance. Let’s explore how you can combine facecolor with other parameters to create a more polished look:
Adjusting Legend Border
You can adjust the legend’s border along with the facecolor:
import matplotlib.pyplot as plt

# Create a simple plot
plt.plot([1, 2, 3, 4], [1, 4, 2, 3], label='Line 1')
plt.plot([1, 2, 3, 4], [2, 3, 4, 1], label='Line 2')

# Add a legend with custom background color and border
plt.legend(facecolor='lightyellow', edgecolor='red', linewidth=2)

# Add a title with the website name
plt.title('Custom Border - how2matplotlib.com')

# Display the plot
plt.show()
In this example, we set the facecolor to light yellow, the border color (edgecolor) to red, and increase the border width (linewidth) to 2.
Changing Legend Text Color
You can also change the text color of the legend to complement the background color:
import matplotlib.pyplot as plt

# Create a simple plot
plt.plot([1, 2, 3, 4], [1, 4, 2, 3], label='Line 1')
plt.plot([1, 2, 3, 4], [2, 3, 4, 1], label='Line 2')

# Add a legend with custom background and text color
legend = plt.legend(facecolor='black')
plt.setp(legend.get_texts(), color='white')

# Add a title with the website name
plt.title('Custom Text Color - how2matplotlib.com')

# Display the plot
plt.show()
Output:
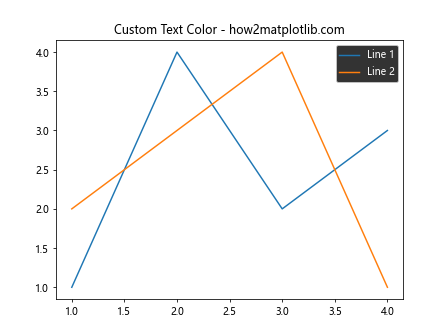
Here, we set the facecolor to black and then use plt.setp() to change the text color to white, creating a high-contrast legend.
Advanced Legend Styling with facecolor in MatplotLib
Let’s explore some more advanced techniques for changing legend background using facecolor in MatplotLib:
Using Gradients as facecolor
While not directly supported by the facecolor parameter, you can create a gradient background for your legend using patches:
import matplotlib.pyplot as plt
import matplotlib.patches as patches

# Create a simple plot
fig, ax = plt.subplots()
ax.plot([1, 2, 3, 4], [1, 4, 2, 3], label='Line 1')
ax.plot([1, 2, 3, 4], [2, 3, 4, 1], label='Line 2')

# Create a gradient patch
gradient = patches.Rectangle((0, 0), 1, 1, fc=(0, 0, 0, 0))
gradient.set_transform(ax.transAxes)
gradient.set_zorder(1)

# Add the gradient to the plot
ax.add_patch(gradient)

# Add a legend
legend = ax.legend()
frame = legend.get_frame()
frame.set_facecolor('none')
frame.set_alpha(0.5)

# Add a title with the website name
plt.title('Gradient Background - how2matplotlib.com')

# Display the plot
plt.show()
Output:
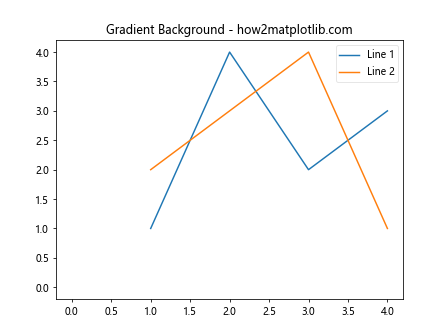
This example creates a gradient background effect for the entire plot, which the legend inherits. The legend’s frame is set to transparent to allow the gradient to show through.
Multiple Legends with Different facecolors
You can also create multiple legends with different background colors:
import matplotlib.pyplot as plt

# Create a simple plot
fig, ax = plt.subplots()
line1, = ax.plot([1, 2, 3, 4], [1, 4, 2, 3], label='Line 1')
line2, = ax.plot([1, 2, 3, 4], [2, 3, 4, 1], label='Line 2')

# Create two legends with different background colors
legend1 = ax.legend([line1], ['Legend 1'], loc='upper left', facecolor='lightblue')
ax.add_artist(legend1)
ax.legend([line2], ['Legend 2'], loc='lower right', facecolor='lightgreen')

# Add a title with the website name
plt.title('Multiple Legends - how2matplotlib.com')

# Display the plot
plt.show()
Output:
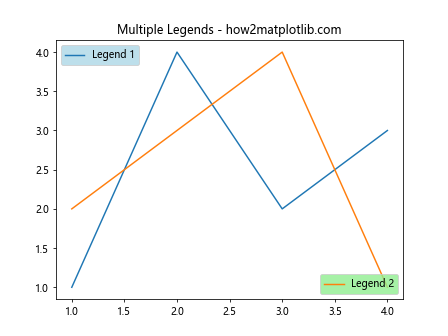
In this example, we create two separate legends with different facecolors and positions on the plot.
Changing Legend Background Using facecolor in Different Plot Types
The technique for changing legend background using facecolor in MatplotLib can be applied to various types of plots. Let’s look at some examples:
Bar Plot
import matplotlib.pyplot as plt

# Create a bar plot
categories = ['A', 'B', 'C', 'D']
values = [3, 7, 2, 5]
plt.bar(categories, values)

# Add a legend with custom background color
plt.legend(['Data'], facecolor='lightpink')

# Add a title with the website name
plt.title('Bar Plot Legend - how2matplotlib.com')

# Display the plot
plt.show()
Output:
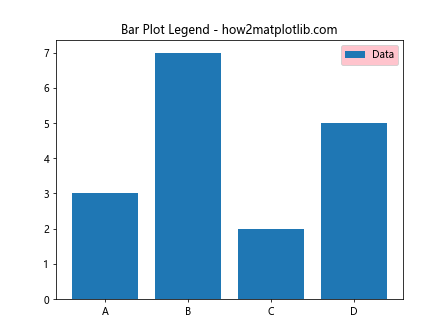
This example demonstrates how to change the legend background color in a bar plot.
Scatter Plot
import matplotlib.pyplot as plt
import numpy as np

# Create a scatter plot
x = np.random.rand(50)
y = np.random.rand(50)
colors = np.random.rand(50)
sizes = 1000 * np.random.rand(50)

plt.scatter(x, y, c=colors, s=sizes, alpha=0.5)

# Add a legend with custom background color
plt.legend(['Points'], facecolor='lightsalmon')

# Add a title with the website name
plt.title('Scatter Plot Legend - how2matplotlib.com')

# Display the plot
plt.show()
Output:
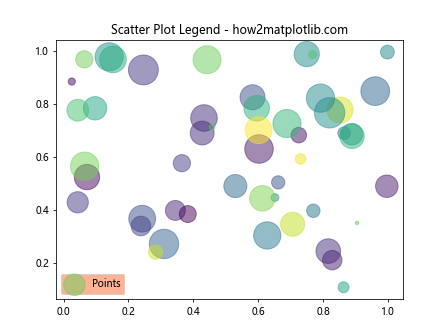
This example shows how to change the legend background color in a scatter plot.
Pie Chart
import matplotlib.pyplot as plt

# Create a pie chart
sizes = [15, 30, 45, 10]
labels = ['A', 'B', 'C', 'D']
plt.pie(sizes, labels=labels, autopct='%1.1f%%', startangle=90)

# Add a legend with custom background color
plt.legend(facecolor='lightcyan')

# Add a title with the website name
plt.title('Pie Chart Legend - how2matplotlib.com')

# Display the plot
plt.show()
Output:
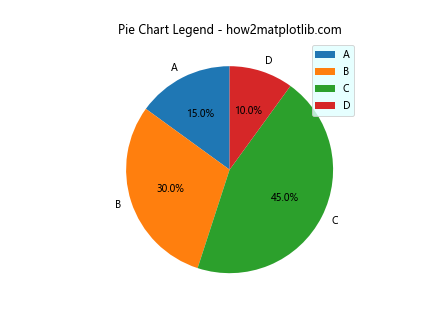
This example demonstrates how to change the legend background color in a pie chart.
Best Practices for Changing Legend Background Using facecolor in MatplotLib
When changing legend background using facecolor in MatplotLib, it’s important to follow some best practices to ensure your plots are both visually appealing and easy to understand:
- Choose colors that contrast well with the plot background and the legend text.
- Consider using semi-transparent colors to allow underlying plot elements to show through if the legend overlaps with data points.
- Ensure that the legend background color doesn’t clash with the colors used in your plot.
- Use consistent color schemes across related plots for a cohesive look.
Here’s an example that demonstrates these best practices:
import matplotlib.pyplot as plt
import numpy as np

# Create a plot with multiple lines
x = np.linspace(0, 10, 100)
plt.plot(x, np.sin(x), label='Sin')
plt.plot(x, np.cos(x), label='Cos')
plt.plot(x, np.tan(x), label='Tan')

# Add a legend with a semi-transparent background that contrasts well
plt.legend(facecolor=(0.9, 0.9, 0.9, 0.5), edgecolor='gray')

# Set a light gray background for the entire plot
plt.gca().set_facecolor((0.95, 0.95, 0.95))

# Add a title with the website name
plt.title('Best Practices Example - how2matplotlib.com')

# Display the plot
plt.show()
Output:
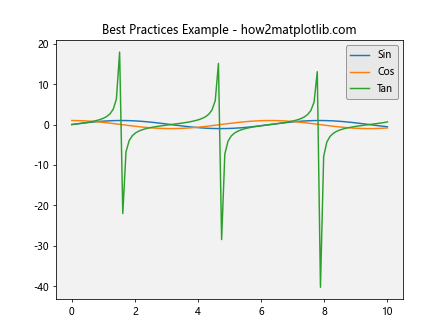
In this example, we use a light gray, semi-transparent background for the legend, which contrasts well with both the plot background and the legend text. The legend’s edge color is set to gray for a subtle border.
Troubleshooting Common Issues When Changing Legend Background Using facecolor in MatplotLib
When working with facecolor to change legend background in MatplotLib, you might encounter some common issues. Let’s address these and provide solutions:
Issue 1: Legend Background Not Changing
If you find that the legend background isn’t changing when you set the facecolor, it might be because the legend frame is not visible. Here’s how to fix this:
import matplotlib.pyplot as plt

# Create a simple plot
plt.plot([1, 2, 3, 4], [1, 4, 2, 3], label='Line 1')

# Add a legend and make sure the frame is visible
legend = plt.legend(facecolor='lightgreen')
legend.get_frame().set_alpha(1)

# Add a title with the website name
plt.title('Visible Legend Frame - how2matplotlib.com')

# Display the plot
plt.show()
Output:

In this example, we explicitly set the alpha value of the legend frame to 1, ensuring it’s fully opaque and visible.
Issue 2: Legend Background Obscuring Plot Elements
If your legend background is obscuring important elements of your plot, you can make it semi-transparent:
import matplotlib.pyplot as plt
import numpy as np

# Create a plot with many data points
x = np.linspace(0, 10, 1000)
plt.plot(x, np.sin(x), label='Sin')

# Add a semi-transparent legend
plt.legend(facecolor=(1, 1, 0, 0.3))  # Semi-transparent yellow

# Add a title with the website name
plt.title('Semi-transparent Legend - how2matplotlib.com')

# Display the plot
plt.show()
Output:
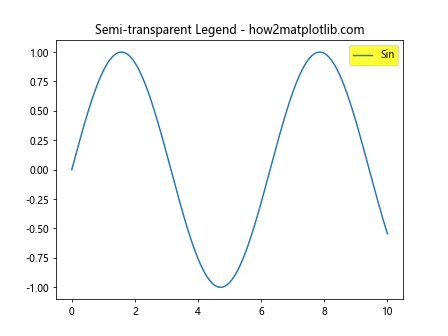
Here, we use an RGBA color value to set a semi-transparent yellow background for the legend.
Issue 3: Legend Background Color Not Matching Plot Style
If you’re using a specific style for your plot, the legend background might not match. You can solve this by getting the current figure’s facecolor:
import matplotlib.pyplot as plt

# Set a dark style
plt.style.use('dark_background')

# Create a simple plot
plt.plot([1, 2, 3, 4], [1, 4, 2, 3], label='Line 1')

# Get the current figure's facecolor
facecolor = plt.gcf().get_facecolor()

# Add a legend with a matching background color
plt.legend(facecolor=facecolor)

# Add a title with the website name
plt.title('Matching Legend Background - how2matplotlib.com')

# Display the plot
plt.show()
Output:
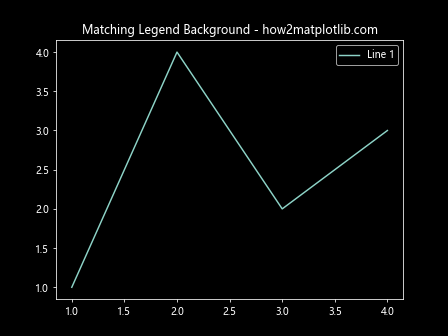
In this example,we use plt.gcf().get_facecolor() to get the current figure’s background color and use it for the legend background, ensuring it matches the plot style.
Advanced Customization: Combining facecolor with Other Legend Properties
Changing legend background using facecolor in MatplotLib can be combined with other legend properties for even more customization. Let’s explore some advanced techniques:
Custom Legend Placement with facecolor
You can combine custom legend placement with facecolor:
import matplotlib.pyplot as plt

# Create a simple plot
plt.plot([1, 2, 3, 4], [1, 4, 2, 3], label='Line 1')
plt.plot([1, 2, 3, 4], [2, 3, 4, 1], label='Line 2')

# Add a legend with custom placement and background color
plt.legend(loc='center left', bbox_to_anchor=(1, 0.5), facecolor='lavender')

# Adjust the plot layout
plt.tight_layout()

# Add a title with the website name
plt.title('Custom Legend Placement - how2matplotlib.com')

# Display the plot
plt.show()
Output:
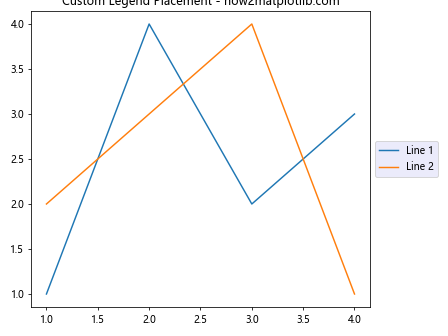
In this example, we place the legend outside the plot area on the right side and set its background color to lavender.
Rounded Corners with facecolor
You can create a legend with rounded corners and a custom background color:
import matplotlib.pyplot as plt
from matplotlib.patches import FancyBboxPatch

# Create a simple plot
fig, ax = plt.subplots()
ax.plot([1, 2, 3, 4], [1, 4, 2, 3], label='Line 1')

# Add a legend
legend = ax.legend()

# Get the legend's bounding box
bbox = legend.get_bbox_to_anchor().transformed(ax.transAxes.inverted())

# Create a fancy box with rounded corners
fancy_bbox = FancyBboxPatch((bbox.x0, bbox.y0),
                            bbox.width, bbox.height,
                            boxstyle="round,pad=0.1",
                            fc='lightgreen',
                            ec="none")

# Add the fancy box to the legend
legend.set_bbox_to_anchor(fancy_bbox)

# Add a title with the website name
plt.title('Rounded Legend Corners - how2matplotlib.com')

# Display the plot
plt.show()
This example creates a legend with rounded corners and a light green background.
Changing Legend Background Using facecolor in Subplots
When working with subplots, you might want to change legend background using facecolor in MatplotLib for each subplot individually. Here’s how you can do that:
import matplotlib.pyplot as plt
import numpy as np

# Create a figure with 2x2 subplots
fig, axs = plt.subplots(2, 2, figsize=(10, 10))

# Flatten the axs array for easier iteration
axs = axs.flatten()

# Create plots in each subplot
for i, ax in enumerate(axs):
    x = np.linspace(0, 10, 100)
    ax.plot(x, np.sin(x + i), label=f'Sin {i}')
    ax.plot(x, np.cos(x + i), label=f'Cos {i}')

    # Add a legend with a different background color for each subplot
    colors = ['lightblue', 'lightgreen', 'lightyellow', 'lightpink']
    ax.legend(facecolor=colors[i])

    ax.set_title(f'Subplot {i+1}')

# Adjust the layout and add a main title
plt.tight_layout()
fig.suptitle('Subplots with Different Legend Colors - how2matplotlib.com', fontsize=16)

# Display the plot
plt.show()
Output:
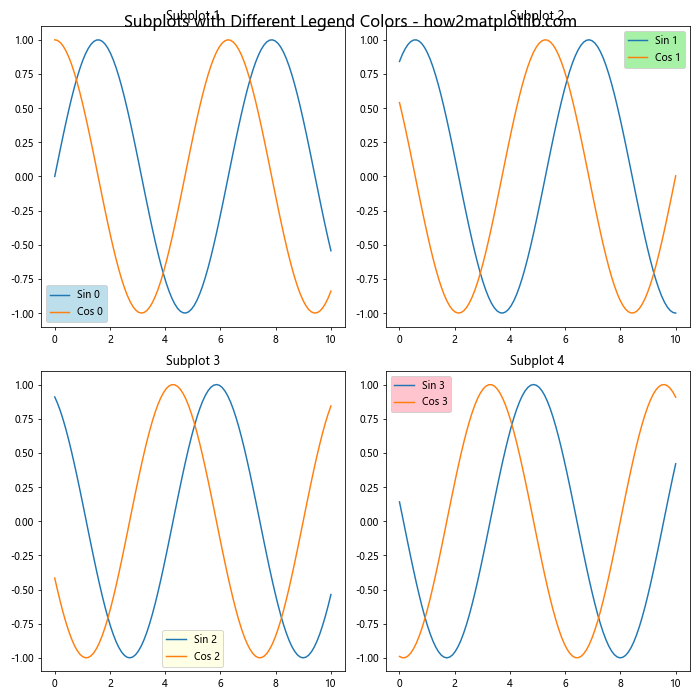
In this example, we create four subplots, each with its own legend and a unique background color.
Using facecolor with Custom Legend Handlers
For more complex plots, you might need to use custom legend handlers. You can still change legend background using facecolor in MatplotLib with these custom handlers:
import matplotlib.pyplot as plt
import matplotlib.patches as mpatches

class CustomHandler:
    def legend_artist(self, legend, orig_handle, fontsize, handlebox):
        x0, y0 = handlebox.xdescent, handlebox.ydescent
        width, height = handlebox.width, handlebox.height
        patch = mpatches.Rectangle([x0, y0], width, height, facecolor='red',
                                   edgecolor='black', hatch='xx', lw=3,
                                   transform=handlebox.get_transform())
        handlebox.add_artist(patch)
        return patch

# Create a simple plot
plt.plot([1, 2, 3, 4], [1, 4, 2, 3], label='Custom')

# Add a legend with a custom handler and background color
plt.legend(handler_map={str: CustomHandler()}, facecolor='lightyellow')

# Add a title with the website name
plt.title('Custom Legend Handler - how2matplotlib.com')

# Display the plot
plt.show()
Output:
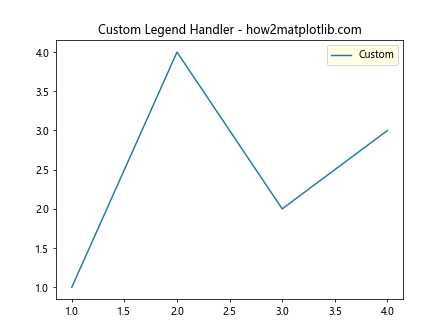
In this example, we create a custom legend handler that draws a red rectangle with a black border and a cross-hatch pattern. We then apply this custom handler to our legend while also setting the legend’s background color to light yellow.
Animating Legend Background Color
You can create animations where the legend background color changes over time. Here’s an example using Matplotlib’s animation functionality:
import matplotlib.pyplot as plt
import matplotlib.animation as animation
import numpy as np

# Create a figure and axis
fig, ax = plt.subplots()

# Create a simple plot
x = np.linspace(0, 2*np.pi, 100)
line, = ax.plot(x, np.sin(x), label='Sine Wave')

# Create a legend
legend = ax.legend(facecolor='white')

# Function to update the legend color
def update(frame):
    # Calculate a color based on the frame number
    r = (np.sin(frame * 0.1) + 1) / 2
    g = (np.sin(frame * 0.1 + 2*np.pi/3) + 1) / 2
    b = (np.sin(frame * 0.1 + 4*np.pi/3) + 1) / 2

    # Update the legend's facecolor
    legend.get_frame().set_facecolor((r, g, b))
    return legend,

# Create the animation
ani = animation.FuncAnimation(fig, update, frames=100, interval=50, blit=True)

# Add a title with the website name
plt.title('Animated Legend Background - how2matplotlib.com')

# Display the animation
plt.show()
Output:
This example creates an animation where the legend’s background color smoothly transitions through different colors.
Conclusion
Changing legend background using facecolor in MatplotLib is a powerful technique that can significantly enhance the visual appeal and readability of your plots. We’ve covered a wide range of topics, from basic usage to advanced customization techniques, troubleshooting common issues, and even creating animations.
Remember these key points when working with facecolor:
- You can use named colors, RGB/RGBA values, or hex codes to set the facecolor.
- Consider the overall color scheme of your plot when choosing a legend background color.
- Use semi-transparent colors when appropriate to avoid obscuring plot elements.
- Combine facecolor with other legend properties for more advanced customization.
- Be mindful of accessibility – ensure sufficient contrast between the legend text and background.
By mastering these techniques, you’ll be able to create more professional and visually appealing plots that effectively communicate your data. Whether you’re creating simple line plots or complex visualizations with custom legend handlers, the ability to change legend background using facecolor in MatplotLib is an essential skill for any data scientist or visualization expert.