How to Add Labels to Histogram Bars in Matplotlib
Adding labels to histogram bars in Matplotlib is an essential skill for data visualization enthusiasts. This article will provide a detailed exploration of various techniques and best practices for adding labels to histogram bars using Matplotlib. We’ll cover everything from basic labeling to advanced customization options, ensuring you have a thorough understanding of how to effectively add labels to histogram bars in Matplotlib.
Understanding the Basics of Adding Labels to Histogram Bars in Matplotlib
Before diving into the specifics of adding labels to histogram bars in Matplotlib, it’s crucial to understand the fundamental concepts. Adding labels to histogram bars in Matplotlib allows you to provide additional information about each bar, making your visualizations more informative and easier to interpret.
Let’s start with a simple example of creating a histogram and adding basic labels to the bars:
import matplotlib.pyplot as plt
import numpy as np

# Generate sample data
data = np.random.normal(0, 1, 1000)

# Create histogram
counts, bins, patches = plt.hist(data, bins=10)

# Add labels to histogram bars
for count, bin, patch in zip(counts, bins, patches):
    plt.text(bin, count, f'{count:.0f}', ha='center', va='bottom')

plt.title('Histogram with Labels - how2matplotlib.com')
plt.xlabel('Value')
plt.ylabel('Frequency')
plt.show()
Output:
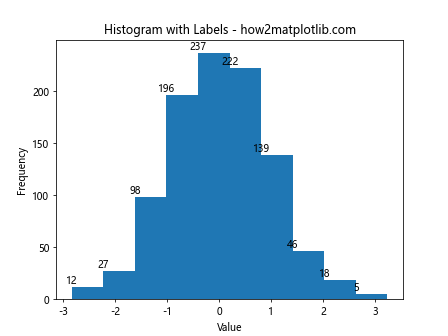
In this example, we’re creating a histogram using sample data and then iterating through the bars to add labels showing the count for each bin. The plt.text() function is used to place the labels on top of each bar.
Customizing Label Appearance when Adding Labels to Histogram Bars in Matplotlib
When adding labels to histogram bars in Matplotlib, you have numerous options for customizing the appearance of the labels. You can adjust the font size, color, style, and position to make the labels more visually appealing and easier to read.
Here’s an example demonstrating how to customize label appearance:
import matplotlib.pyplot as plt
import numpy as np

data = np.random.exponential(scale=2, size=1000)

counts, bins, patches = plt.hist(data, bins=15)

for count, bin, patch in zip(counts, bins, patches):
    plt.text(bin, count, f'{count:.0f}',
             ha='center', va='bottom',
             fontweight='bold', fontsize=10,
             color='red', rotation=45)

plt.title('Customized Labels - how2matplotlib.com')
plt.xlabel('Value')
plt.ylabel('Frequency')
plt.show()
Output:
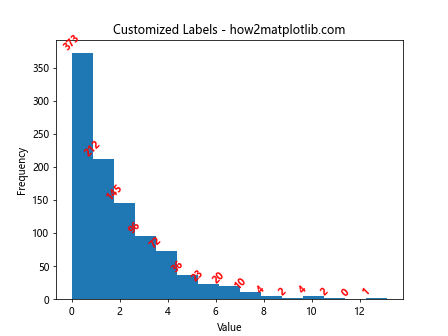
In this example, we’re using additional parameters in the plt.text() function to customize the labels. We’ve made the labels bold, red, and rotated them 45 degrees for better visibility.
Adding Percentage Labels when Adding Labels to Histogram Bars in Matplotlib
Sometimes, you might want to display percentages instead of raw counts when adding labels to histogram bars in Matplotlib. This can be particularly useful for showing the distribution of data in relative terms.
Here’s how you can add percentage labels to histogram bars:
import matplotlib.pyplot as plt
import numpy as np

data = np.random.normal(0, 1, 1000)

counts, bins, patches = plt.hist(data, bins=10)

total = sum(counts)
for count, bin, patch in zip(counts, bins, patches):
    percentage = (count / total) * 100
    plt.text(bin, count, f'{percentage:.1f}%',
             ha='center', va='bottom')

plt.title('Histogram with Percentage Labels - how2matplotlib.com')
plt.xlabel('Value')
plt.ylabel('Frequency')
plt.show()
Output:
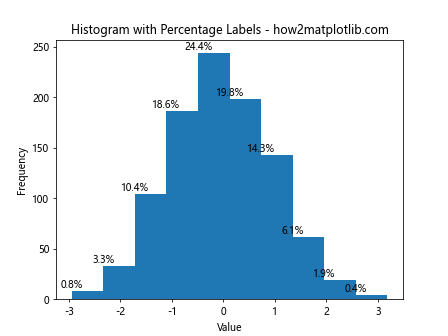
In this example, we calculate the percentage for each bin by dividing the count by the total number of data points and multiplying by 100. We then display these percentages as labels on the histogram bars.
Handling Overlapping Labels when Adding Labels to Histogram Bars in Matplotlib
When adding labels to histogram bars in Matplotlib, you may encounter situations where labels overlap, especially with densely packed or unevenly distributed data. There are several strategies to handle this issue and ensure your labels remain readable.
Here’s an example that demonstrates one approach to handling overlapping labels:
import matplotlib.pyplot as plt
import numpy as np

data = np.random.exponential(scale=2, size=1000)

counts, bins, patches = plt.hist(data, bins=20)

for i, (count, bin) in enumerate(zip(counts, bins)):
    if i % 2 == 0:  # Label every other bar
        plt.text(bin, count, f'{count:.0f}',
                 ha='center', va='bottom')
    else:
        plt.text(bin, count, f'{count:.0f}',
                 ha='center', va='top',
                 color='white')

plt.title('Handling Overlapping Labels - how2matplotlib.com')
plt.xlabel('Value')
plt.ylabel('Frequency')
plt.tight_layout()
plt.show()
Output:
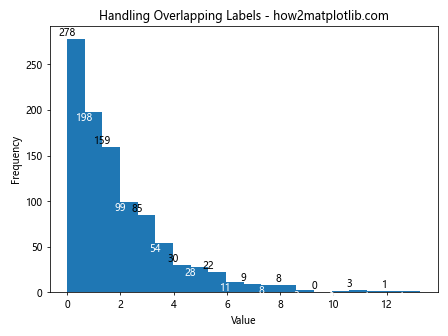
In this example, we’re alternating the position of labels between the top and bottom of the bars. This helps to reduce overlap and improve readability.
Using Bar Labels Function for Adding Labels to Histogram Bars in Matplotlib
Matplotlib provides a convenient bar_label() function that can simplify the process of adding labels to histogram bars. This function is particularly useful when you want to add labels to all bars at once with consistent formatting.
Here’s an example of using the bar_label() function:
import matplotlib.pyplot as plt
import numpy as np

data = np.random.normal(0, 1, 1000)

counts, bins, patches = plt.hist(data, bins=10)

plt.bar_label(patches, label_type='center')

plt.title('Using bar_label() Function - how2matplotlib.com')
plt.xlabel('Value')
plt.ylabel('Frequency')
plt.show()
Output:
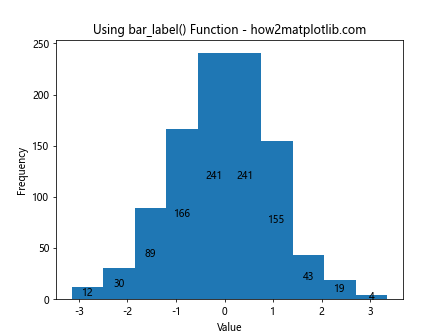
In this example, the bar_label() function automatically adds labels to all bars in the histogram. The label_type='center' parameter places the labels in the center of each bar.
Adding Multiple Labels when Adding Labels to Histogram Bars in Matplotlib
Sometimes, you might want to display multiple pieces of information for each bar when adding labels to histogram bars in Matplotlib. This could include both the count and percentage, or any other relevant statistics.
Here’s an example of adding multiple labels to histogram bars:
import matplotlib.pyplot as plt
import numpy as np

data = np.random.normal(0, 1, 1000)

counts, bins, patches = plt.hist(data, bins=10)

total = sum(counts)
for count, bin, patch in zip(counts, bins, patches):
    percentage = (count / total) * 100
    plt.text(bin, count, f'{count:.0f}\n({percentage:.1f}%)',
             ha='center', va='bottom')

plt.title('Multiple Labels per Bar - how2matplotlib.com')
plt.xlabel('Value')
plt.ylabel('Frequency')
plt.show()
Output:
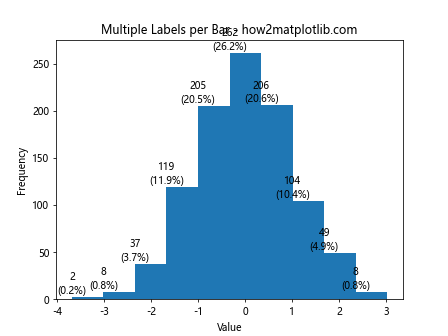
In this example, we’re adding both the count and percentage to each bar, separated by a newline character for better readability.
Conditional Formatting when Adding Labels to Histogram Bars in Matplotlib
When adding labels to histogram bars in Matplotlib, you might want to apply different formatting based on certain conditions. This can help highlight specific bars or ranges of data.
Here’s an example of conditional formatting for histogram bar labels:
import matplotlib.pyplot as plt
import numpy as np

data = np.random.normal(0, 1, 1000)

counts, bins, patches = plt.hist(data, bins=10)

mean = np.mean(data)
for count, bin, patch in zip(counts, bins, patches):
    if bin > mean:
        color = 'red'
    else:
        color = 'blue'
    plt.text(bin, count, f'{count:.0f}',
             ha='center', va='bottom',
             color=color, fontweight='bold')

plt.axvline(mean, color='green', linestyle='dashed', linewidth=2)
plt.text(mean, plt.ylim()[1], 'Mean', ha='center', va='bottom')

plt.title('Conditional Formatting - how2matplotlib.com')
plt.xlabel('Value')
plt.ylabel('Frequency')
plt.show()
Output:
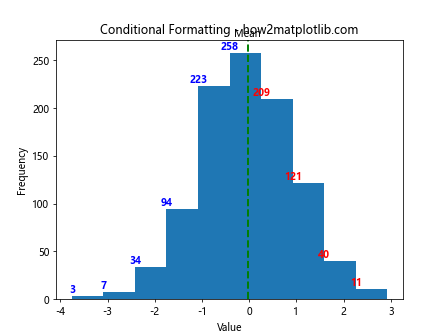
In this example, we’re coloring the labels red for bars above the mean and blue for bars below or equal to the mean. We’ve also added a vertical line to indicate the mean value.
Adding Labels to Stacked Histograms in Matplotlib
Adding labels to histogram bars in Matplotlib becomes more complex when dealing with stacked histograms. However, with careful positioning and formatting, you can create informative labels for each segment of the stacked bars.
Here’s an example of adding labels to a stacked histogram:
import matplotlib.pyplot as plt
import numpy as np

data1 = np.random.normal(0, 1, 1000)
data2 = np.random.normal(2, 1, 1000)

counts1, bins, _ = plt.hist(data1, bins=10, alpha=0.5, label='Data 1')
counts2, _, _ = plt.hist(data2, bins=bins, alpha=0.5, label='Data 2')

for count1, count2, bin in zip(counts1, counts2, bins):
    plt.text(bin, count1, f'{count1:.0f}', ha='center', va='bottom')
    plt.text(bin, count1+count2, f'{count2:.0f}', ha='center', va='bottom')

plt.title('Stacked Histogram with Labels - how2matplotlib.com')
plt.xlabel('Value')
plt.ylabel('Frequency')
plt.legend()
plt.show()
Output:
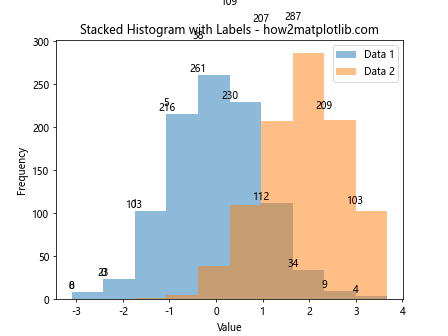
In this example, we’re creating a stacked histogram with two datasets and adding labels for both the bottom and top segments of each stacked bar.
Using Annotations for Adding Labels to Histogram Bars in Matplotlib
While the text() function is commonly used for adding labels to histogram bars in Matplotlib, the annotate() function offers more flexibility, especially when you need to add arrows or connect labels to specific points on the plot.
Here’s an example using annotations to label histogram bars:
import matplotlib.pyplot as plt
import numpy as np

data = np.random.normal(0, 1, 1000)

counts, bins, patches = plt.hist(data, bins=10)

for count, bin in zip(counts, bins):
    plt.annotate(f'{count:.0f}',
                 xy=(bin, count),
                 xytext=(0, 5),
                 textcoords='offset points',
                 ha='center', va='bottom',
                 arrowprops=dict(arrowstyle='->', connectionstyle='arc3,rad=0'))

plt.title('Using Annotations - how2matplotlib.com')
plt.xlabel('Value')
plt.ylabel('Frequency')
plt.show()
Output:
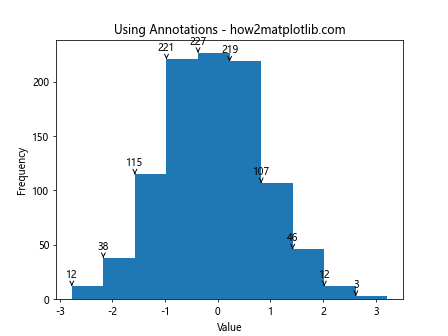
In this example, we’re using annotate() to add labels with small arrows pointing to each bar. This can be particularly useful when you want to emphasize the connection between the label and the bar.
Handling Large Numbers when Adding Labels to Histogram Bars in Matplotlib
When dealing with large numbers while adding labels to histogram bars in Matplotlib, it’s often beneficial to format the labels for better readability. This might involve using scientific notation, abbreviations, or custom formatting.
Here’s an example of handling large numbers in histogram bar labels:
import matplotlib.pyplot as plt
import numpy as np

data = np.random.normal(0, 1, 1000000)

counts, bins, patches = plt.hist(data, bins=10)

def format_large_number(num):
    if num >= 1e6:
        return f'{num/1e6:.1f}M'
    elif num >= 1e3:
        return f'{num/1e3:.1f}K'
    else:
        return f'{num:.0f}'

for count, bin in zip(counts, bins):
    plt.text(bin, count, format_large_number(count),
             ha='center', va='bottom')

plt.title('Handling Large Numbers - how2matplotlib.com')
plt.xlabel('Value')
plt.ylabel('Frequency')
plt.show()
Output:
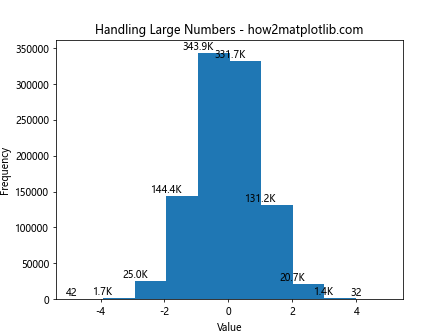
In this example, we’ve created a custom function format_large_number() that formats large numbers into more readable forms using K for thousands and M for millions.
Adding Labels to Horizontal Histograms in Matplotlib
While we’ve primarily focused on vertical histograms, adding labels to histogram bars in Matplotlib is also possible with horizontal histograms. The process is similar, but the positioning of labels needs to be adjusted.
Here’s an example of adding labels to a horizontal histogram:
import matplotlib.pyplot as plt
import numpy as np

data = np.random.normal(0, 1, 1000)

counts, bins, patches = plt.hist(data, bins=10, orientation='horizontal')

for count, bin in zip(counts, bins):
    plt.text(count, bin, f'{count:.0f}',
             ha='left', va='center')

plt.title('Horizontal Histogram with Labels - how2matplotlib.com')
plt.ylabel('Value')
plt.xlabel('Frequency')
plt.show()
Output:
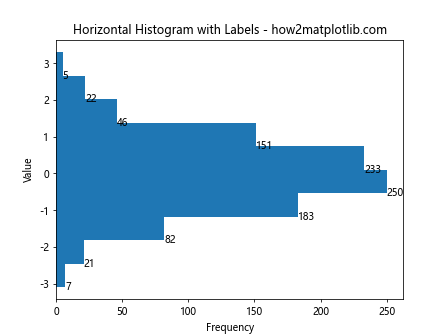
In this example, we’ve created a horizontal histogram and adjusted the label positioning to appear to the right of each bar.
Adding Labels to Multiple Histograms in Matplotlib
When working with multiple histograms in the same plot, adding labels to histogram bars in Matplotlib requires careful consideration of positioning and color coding to ensure clarity.
Here’s an example of adding labels to multiple histograms:
import matplotlib.pyplot as plt
import numpy as np

data1 = np.random.normal(0, 1, 1000)
data2 = np.random.normal(2, 1, 1000)

fig, ax = plt.subplots()

counts1, bins1, patches1 = ax.hist(data1, bins=10, alpha=0.5, label='Data 1')
counts2, bins2, patches2 = ax.hist(data2, bins=10, alpha=0.5, label='Data 2')

for count, bin, patches in zip([counts1, counts2], [bins1, bins2], [patches1, patches2]):
    color = patches[0].get_facecolor()
    for c, b in zip(count, bin):
        ax.text(b, c, f'{c:.0f}', ha='center', va='bottom', color=color)

plt.title('Multiple Histograms with Labels - how2matplotlib.com')
plt.xlabel('Value')
plt.ylabel('Frequency')
plt.legend()
plt.show()
Output:
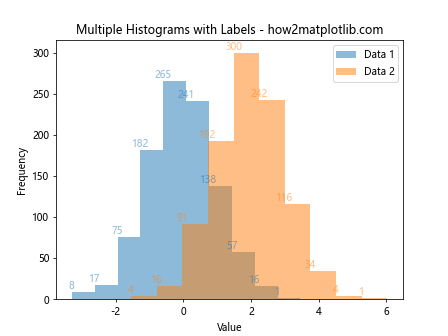
In this example, we’re creating two overlapping histograms and adding labels to each, using the color of the respective histogram for the labels to maintain visual consistency.
Using Custom Functions for Adding Labels to Histogram Bars in Matplotlib
As your labeling needs become more complex, it can be beneficial to create custom functions for adding labels to histogram bars in Matplotlib. This approach allows for more flexibility and reusability in your code.
Here’s an example of using a custom function for labeling:
import matplotlib.pyplot as plt
import numpy as np

def add_value_labels(ax, spacing=5):
    for rect in ax.patches:
        y_value = rect.get_height()
        x_value = rect.get_x() + rect.get_width() / 2

        label = f"{y_value:.0f}"

        ax.annotate(label, (x_value, y_value), xytext=(0, spacing),
                    textcoords="offset points", ha='center', va='bottom')

data = np.random.normal(0, 1, 1000)

fig, ax = plt.subplots()
counts, bins, patches = ax.hist(data, bins=10)

add_value_labels(ax)

plt.title('Custom Labeling Function - how2matplotlib.com')
plt.xlabel('Value')
plt.ylabel('Frequency')
plt.show()
Output:
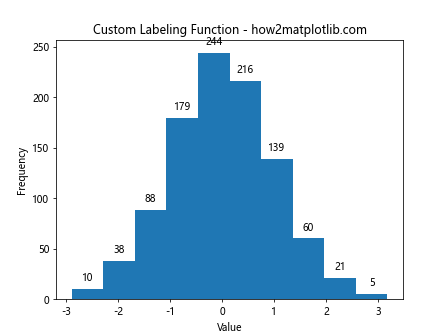
In this example, we’ve created a custom function add_value_labels() that can be easily reused for different histograms and even other types of bar plots.
Adding Labels to Histogram Bars with Varying BinWidths in Matplotlib
When adding labels to histogram bars in Matplotlib with varying bin widths, you need to adjust your labeling strategy to account for the different bar widths. This situation often arises when using non-uniform bin sizes to better represent the underlying data distribution.
Here’s an example of adding labels to a histogram with varying bin widths:
import matplotlib.pyplot as plt
import numpy as np

data = np.random.exponential(scale=2, size=1000)

bins = [0, 1, 2, 4, 8, 16]
counts, bins, patches = plt.hist(data, bins=bins)

for count, bin, patch in zip(counts, bins[:-1], patches):
    width = bin - bins[bins.index(bin)-1] if bins.index(bin) > 0 else bin
    center = bin + width/2
    plt.text(center, count, f'{count:.0f}', ha='center', va='bottom')

plt.title('Histogram with Varying Bin Widths - how2matplotlib.com')
plt.xlabel('Value')
plt.ylabel('Frequency')
plt.show()
In this example, we’re using custom bin edges to create a histogram with varying bin widths. We then calculate the center of each bin to position the labels correctly.
Adjusting Label Position when Adding Labels to Histogram Bars in Matplotlib
Sometimes, the default position of labels when adding labels to histogram bars in Matplotlib may not be ideal, especially for bars with very small or very large values. In such cases, you might need to adjust the label positions dynamically.
Here’s an example that demonstrates how to adjust label positions based on bar height:
import matplotlib.pyplot as plt
import numpy as np

data = np.random.exponential(scale=2, size=1000)

counts, bins, patches = plt.hist(data, bins=15)

max_count = max(counts)
for count, bin, patch in zip(counts, bins, patches):
    if count / max_count < 0.1:
        va = 'bottom'
        offset = 0.5
    else:
        va = 'top'
        offset = -0.5
    plt.text(bin, count + offset, f'{count:.0f}',
             ha='center', va=va)

plt.title('Adjusted Label Positions - how2matplotlib.com')
plt.xlabel('Value')
plt.ylabel('Frequency')
plt.show()
Output:
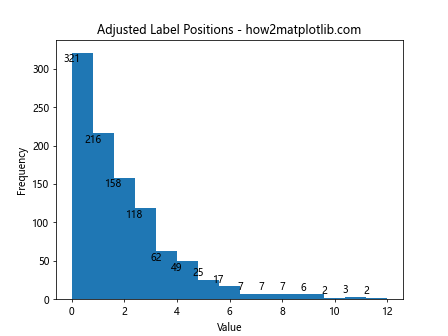
In this example, we're placing labels above the bar for taller bars and below the bar for shorter ones, improving overall readability.
Adding Labels to Normalized Histograms in Matplotlib
When working with normalized histograms, the process of adding labels to histogram bars in Matplotlib requires some adjustments to handle the normalized values correctly.
Here's an example of adding labels to a normalized histogram:
import matplotlib.pyplot as plt
import numpy as np

data = np.random.normal(0, 1, 1000)

counts, bins, patches = plt.hist(data, bins=10, density=True)

for count, bin in zip(counts, bins):
    plt.text(bin, count, f'{count:.2f}', ha='center', va='bottom')

plt.title('Normalized Histogram with Labels - how2matplotlib.com')
plt.xlabel('Value')
plt.ylabel('Density')
plt.show()
Output:
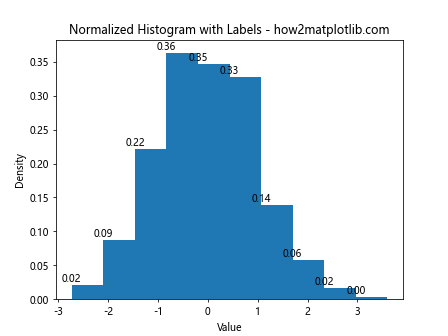
In this example, we're using density=True to create a normalized histogram, and we're formatting the labels to show two decimal places to account for the smaller density values.
Using Color Gradients when Adding Labels to Histogram Bars in Matplotlib
To make your histogram more visually appealing when adding labels to histogram bars in Matplotlib, you can use color gradients for the bars and adjust the label colors accordingly.
Here's an example demonstrating this technique:
import matplotlib.pyplot as plt
import numpy as np
from matplotlib.colors import LinearSegmentedColormap

data = np.random.normal(0, 1, 1000)

counts, bins, patches = plt.hist(data, bins=10)

# Create a color map
cmap = LinearSegmentedColormap.from_list("", ["lightblue","darkblue"])

# Apply the color map to the patches
for patch, bin in zip(patches, bins):
    color = cmap((bin - min(bins)) / (max(bins) - min(bins)))
    patch.set_facecolor(color)
    plt.text(bin, patch.get_height(), f'{patch.get_height():.0f}',
             ha='center', va='bottom', color='white')

plt.title('Color Gradient Histogram - how2matplotlib.com')
plt.xlabel('Value')
plt.ylabel('Frequency')
plt.show()
Output:
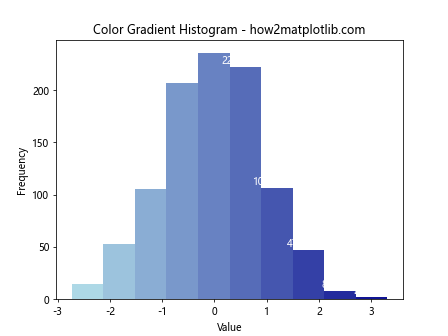
In this example, we're creating a custom color map and applying it to the histogram bars. The labels are set to white for better contrast against the colored bars.
Adding Interactive Labels when Adding Labels to Histogram Bars in Matplotlib
For more advanced visualizations, you might want to add interactive labels when adding labels to histogram bars in Matplotlib. This can be achieved using libraries like mpld3 or by leveraging Matplotlib's event handling capabilities.
Here's a simple example using Matplotlib's event handling:
import matplotlib.pyplot as plt
import numpy as np

data = np.random.normal(0, 1, 1000)

fig, ax = plt.subplots()
counts, bins, patches = ax.hist(data, bins=10)

annot = ax.annotate("", xy=(0,0), xytext=(20,20),textcoords="offset points",
                    bbox=dict(boxstyle="round", fc="w"),
                    arrowprops=dict(arrowstyle="->"))
annot.set_visible(False)

def update_annot(bar):
    x = bar.get_x() + bar.get_width() / 2.
    y = bar.get_height()
    annot.xy = (x, y)
    text = f"Value: {x:.2f}\nCount: {y:.0f}"
    annot.set_text(text)
    annot.get_bbox_patch().set_alpha(0.4)

def hover(event):
    vis = annot.get_visible()
    if event.inaxes == ax:
        for bar in patches:
            cont, ind = bar.contains(event)
            if cont:
                update_annot(bar)
                annot.set_visible(True)
                fig.canvas.draw_idle()
                return
    if vis:
        annot.set_visible(False)
        fig.canvas.draw_idle()

fig.canvas.mpl_connect("motion_notify_event", hover)

plt.title('Interactive Labels - how2matplotlib.com')
plt.xlabel('Value')
plt.ylabel('Frequency')
plt.show()
Output:
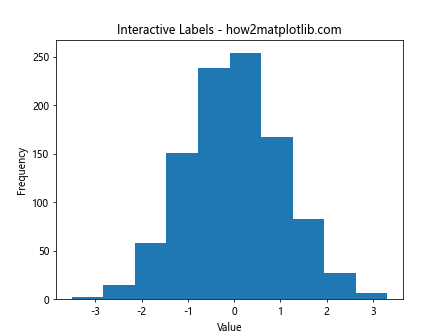
In this example, we're creating an interactive histogram where labels appear when hovering over the bars.
Conclusion: Mastering the Art of Adding Labels to Histogram Bars in Matplotlib
Throughout this comprehensive guide, we've explored numerous techniques and best practices for adding labels to histogram bars in Matplotlib. From basic labeling to advanced customization and interactive features, you now have a robust toolkit for creating informative and visually appealing histograms.
Remember, the key to effective data visualization lies in choosing the right labeling strategy for your specific data and audience. Whether you're working with simple distributions or complex, multi-dimensional datasets, the techniques we've covered will help you communicate your insights more effectively.