How to Create Stunning Horizontal Bar Charts with Matplotlib: A Comprehensive Guide
Matplotlib bar chart horizontal is a powerful visualization technique that allows you to create visually appealing and informative horizontal bar charts using the Matplotlib library in Python. Horizontal bar charts are particularly useful when dealing with categorical data or when you have long category names that would be difficult to read in a vertical orientation. In this comprehensive guide, we’ll explore various aspects of creating horizontal bar charts with Matplotlib, including customization options, data manipulation techniques, and best practices for effective data visualization.
Understanding the Basics of Matplotlib Bar Chart Horizontal
Before diving into the more advanced features, let’s start with the fundamentals of creating a horizontal bar chart using Matplotlib. The primary function we’ll be using is plt.barh(), which is specifically designed for horizontal bar charts.
Here’s a simple example to get us started:
import matplotlib.pyplot as plt

categories = ['Category A', 'Category B', 'Category C', 'Category D']
values = [25, 40, 30, 55]

plt.figure(figsize=(10, 6))
plt.barh(categories, values)
plt.title('Simple Horizontal Bar Chart - how2matplotlib.com')
plt.xlabel('Values')
plt.ylabel('Categories')
plt.show()
Output:
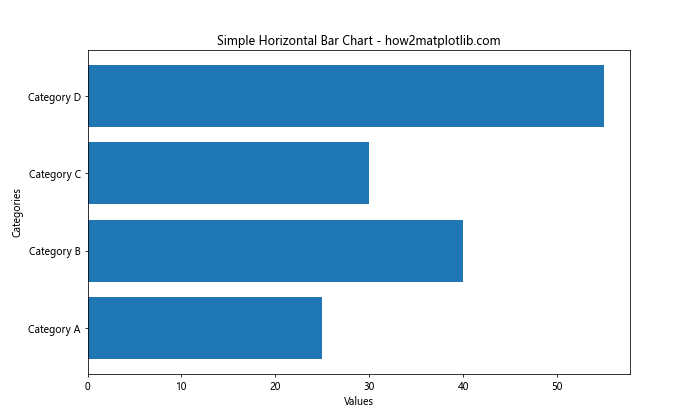
In this example, we create a basic horizontal bar chart with four categories and their corresponding values. The plt.barh() function takes two main arguments: the categories (y-axis) and the values (x-axis). We also set a title and labels for the axes to make the chart more informative.
Customizing Colors in Matplotlib Bar Chart Horizontal
One of the most effective ways to enhance your horizontal bar charts is by customizing the colors. Matplotlib offers various options for color customization, allowing you to create visually striking charts that effectively communicate your data.
Let’s explore a few color customization techniques:
import matplotlib.pyplot as plt

categories = ['Product A', 'Product B', 'Product C', 'Product D']
sales = [1500, 1200, 1800, 1000]

plt.figure(figsize=(10, 6))
plt.barh(categories, sales, color=['#FF9999', '#66B2FF', '#99FF99', '#FFCC99'])
plt.title('Sales by Product - how2matplotlib.com')
plt.xlabel('Sales ($)')
plt.ylabel('Products')
plt.show()
Output:
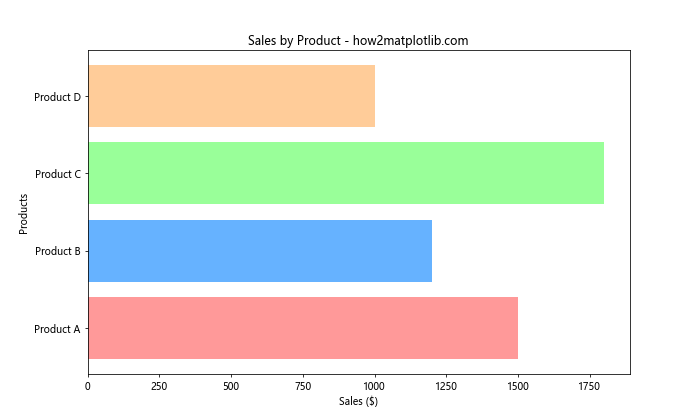
In this example, we use a list of custom hex color codes to assign different colors to each bar. This technique is particularly useful when you want to highlight specific categories or create a visually appealing color scheme that matches your brand or presentation style.
Sorting and Ordering in Matplotlib Bar Chart Horizontal
Often, you’ll want to sort your horizontal bar chart to make it easier to interpret and compare values. Matplotlib allows you to easily sort your data before plotting, resulting in a more organized and informative visualization.
Here’s an example of how to create a sorted horizontal bar chart:
import matplotlib.pyplot as plt

countries = ['USA', 'China', 'Japan', 'Germany', 'UK', 'India', 'France', 'Italy', 'Brazil', 'Canada']
population = [331002651, 1439323776, 126476461, 83783942, 67886011, 1380004385, 65273511, 60461826, 212559417, 37742154]

# Sort the data
sorted_data = sorted(zip(population, countries), reverse=True)
sorted_population, sorted_countries = zip(*sorted_data)

plt.figure(figsize=(12, 8))
plt.barh(sorted_countries, sorted_population)
plt.title('Population by Country (Sorted) - how2matplotlib.com')
plt.xlabel('Population')
plt.ylabel('Country')

# Add value labels
for i, v in enumerate(sorted_population):
    plt.text(v, i, f' {v:,}', va='center', fontweight='bold')

plt.tight_layout()
plt.show()
Output:
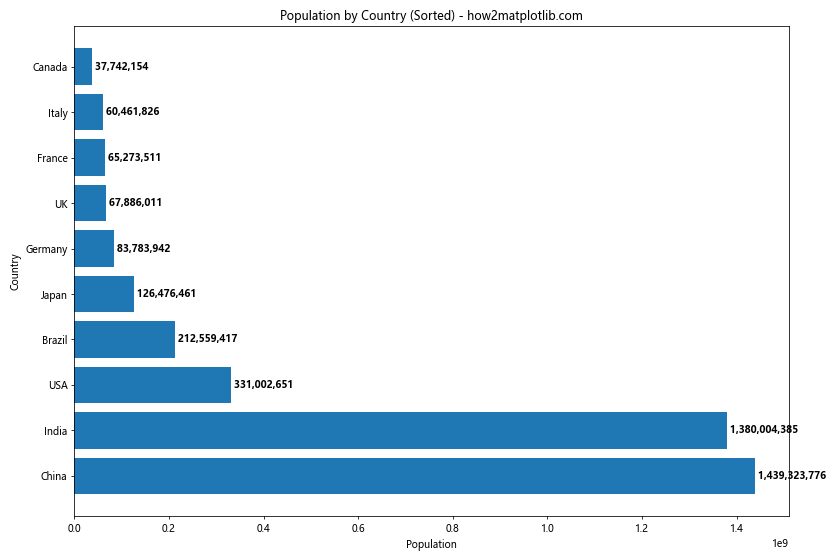
In this example, we first sort the data using the sorted() function with zip() to keep the country names and population values together. We then unpack the sorted data and use it to create the horizontal bar chart. The result is a chart where countries are ordered from highest to lowest population.
Grouping and Comparing in Matplotlib Bar Chart Horizontal
Horizontal bar charts are excellent for comparing multiple categories or groups side by side. Matplotlib provides several ways to create grouped or stacked horizontal bar charts for easy comparison.
Let’s start with a grouped horizontal bar chart:
import matplotlib.pyplot as plt
import numpy as np

categories = ['Category A', 'Category B', 'Category C', 'Category D']
group1 = [15, 30, 25, 20]
group2 = [25, 20, 30, 15]

y = np.arange(len(categories))
height = 0.35

fig, ax = plt.subplots(figsize=(10, 6))
ax.barh(y - height/2, group1, height, label='Group 1', color='#66B2FF')
ax.barh(y + height/2, group2, height, label='Group 2', color='#FF9999')

ax.set_yticks(y)
ax.set_yticklabels(categories)
ax.invert_yaxis()  # Labels read top-to-bottom
ax.set_xlabel('Values')
ax.set_title('Grouped Horizontal Bar Chart - how2matplotlib.com')
ax.legend()

plt.tight_layout()
plt.show()
Output:
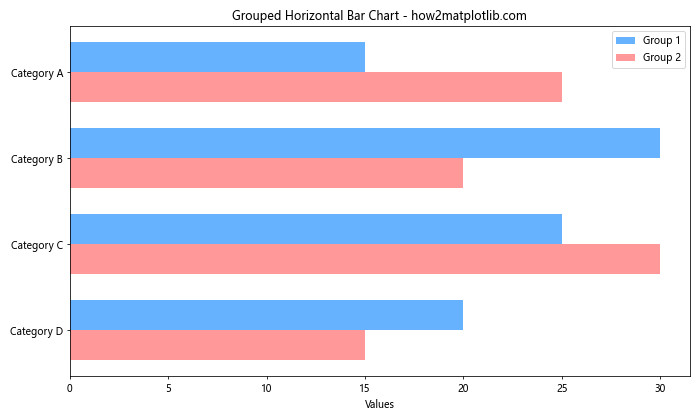
This example creates a grouped horizontal bar chart that compares two groups across four categories. We use the y - height/2 and y + height/2 to position the bars for each group side by side.
Now, let’s look at a stacked horizontal bar chart:
import matplotlib.pyplot as plt

categories = ['Product A', 'Product B', 'Product C', 'Product D']
sales_q1 = [100, 80, 120, 90]
sales_q2 = [110, 85, 130, 95]
sales_q3 = [105, 90, 125, 100]
sales_q4 = [115, 95, 135, 105]

fig, ax = plt.subplots(figsize=(10, 6))
ax.barh(categories, sales_q1, label='Q1', color='#66B2FF')
ax.barh(categories, sales_q2, left=sales_q1, label='Q2', color='#FF9999')
ax.barh(categories, sales_q3, left=[i+j for i,j in zip(sales_q1, sales_q2)], label='Q3', color='#99FF99')
ax.barh(categories, sales_q4, left=[i+j+k for i,j,k in zip(sales_q1, sales_q2, sales_q3)], label='Q4', color='#FFCC99')

ax.set_xlabel('Sales')
ax.set_title('Quarterly Sales by Product - how2matplotlib.com')
ax.legend(loc='lower right')

plt.tight_layout()
plt.show()
Output:
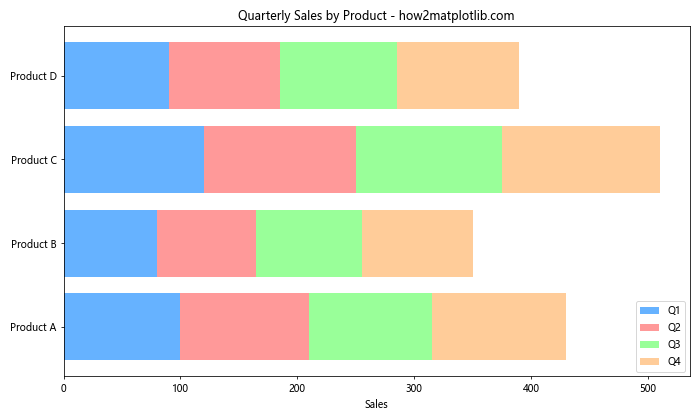
This example creates a stacked horizontal bar chart that shows sales data for four products across four quarters. We use the left parameter in ax.barh() to stack the bars on top of each other.
Adding Error Bars to Matplotlib Bar Chart Horizontal
Error bars are a great way to show the uncertainty or variability in your data. Matplotlib makes it easy to add error bars to your horizontal bar charts.
Here’s an example of how to add error bars to a horizontal bar chart:
import matplotlib.pyplot as plt
import numpy as np

categories = ['Category A', 'Category B', 'Category C', 'Category D']
values = [25, 40, 30, 55]
errors = [3, 5, 2, 8]```python
fig, ax = plt.subplots(figsize=(10, 6))
ax.barh(categories, values, xerr=errors, capsize=5)
ax.set_xlabel('Values')
ax.set_title('Horizontal Bar Chart with Error Bars - how2matplotlib.com')

# Add value labels
for i, v in enumerate(values):
    ax.text(v, i, f' {v}±{errors[i]}', va='center')

plt.tight_layout()
plt.show()
In this example, we use the xerr parameter in ax.barh() to add horizontal error bars to our chart. The capsize parameter controls the width of the error bar caps. We also add value labels that include both the value and the error margin.
You can also create asymmetric error bars:
import matplotlib.pyplot as plt
import numpy as np

categories = ['Product A', 'Product B', 'Product C', 'Product D']
sales = [1000, 1200, 900, 1500]
lower_errors = [100, 150, 80, 200]
upper_errors = [150, 100, 120, 180]

fig, ax = plt.subplots(figsize=(10, 6))
ax.barh(categories, sales, xerr=[lower_errors, upper_errors], capsize=5)
ax.set_xlabel('Sales ($)')
ax.set_title('Product Sales with Asymmetric Error Bars - how2matplotlib.com')

# Add value labels
for i, v in enumerate(sales):
    ax.text(v, i, f' ${v} (+{upper_errors[i]}/-{lower_errors[i]})', va='center')

plt.tight_layout()
plt.show()
Output:
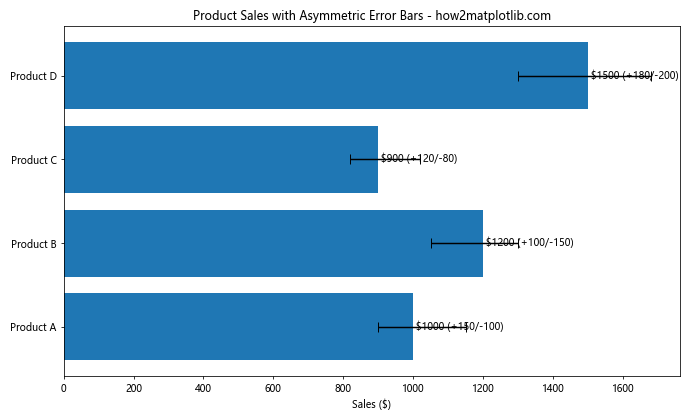
This example demonstrates how to create asymmetric error bars by passing a list of two arrays to the xerr parameter: one for the lower errors and one for the upper errors.
Creating Stacked Horizontal Bar Charts in Matplotlib
Stacked horizontal bar charts are useful for showing the composition of different categories. They allow you to display multiple data series in a single bar, making it easy to compare total values while also showing the contribution of each component.
Here’s an example of a simple stacked horizontal bar chart:
import matplotlib.pyplot as plt

categories = ['Category A', 'Category B', 'Category C', 'Category D']
values1 = [20, 35, 30, 25]
values2 = [25, 25, 20, 30]
values3 = [15, 15, 20, 20]

fig, ax = plt.subplots(figsize=(10, 6))
ax.barh(categories, values1, label='Series 1', color='#66B2FF')
ax.barh(categories, values2, left=values1, label='Series 2', color='#FF9999')
ax.barh(categories, values3, left=[i+j for i,j in zip(values1, values2)], label='Series 3', color='#99FF99')

ax.set_xlabel('Values')
ax.set_title('Stacked Horizontal Bar Chart - how2matplotlib.com')
ax.legend(loc='lower right')

plt.tight_layout()
plt.show()
Output:
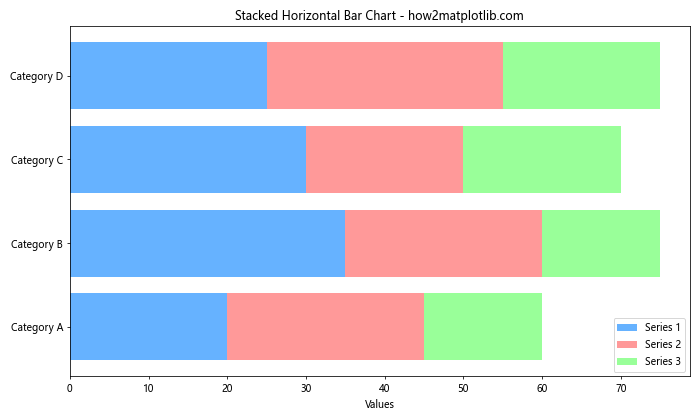
In this example, we create three series of data and stack them using the left parameter in ax.barh(). The left parameter specifies where each series should start, which is the sum of all previous series.
You can also create a 100% stacked horizontal bar chart, where each bar represents the percentage contribution of each component:
import matplotlib.pyplot as plt
import numpy as np

categories = ['Product A', 'Product B', 'Product C', 'Product D']
cost = [30, 40, 35, 45]
profit = [20, 25, 15, 30]
tax = [10, 15, 10, 15]

total = np.array(cost) + np.array(profit) + np.array(tax)
cost_percentage = 100 * np.array(cost) / total
profit_percentage = 100 * np.array(profit) / total
tax_percentage = 100 * np.array(tax) / total

fig, ax = plt.subplots(figsize=(10, 6))
ax.barh(categories, cost_percentage, label='Cost', color='#66B2FF')
ax.barh(categories, profit_percentage, left=cost_percentage, label='Profit', color='#FF9999')
ax.barh(categories, tax_percentage, left=cost_percentage+profit_percentage, label='Tax', color='#99FF99')

ax.set_xlabel('Percentage')
ax.set_title('100% Stacked Horizontal Bar Chart - how2matplotlib.com')
ax.legend(loc='lower right')

# Add percentage labels
for i, category in enumerate(categories):
    cost_x = cost_percentage[i] / 2
    profit_x = cost_percentage[i] + profit_percentage[i] / 2
    tax_x = cost_percentage[i] + profit_percentage[i] + tax_percentage[i] / 2

    ax.text(cost_x, i, f'{cost_percentage[i]:.1f}%', ha='center', va='center')
    ax.text(profit_x, i, f'{profit_percentage[i]:.1f}%', ha='center', va='center')
    ax.text(tax_x, i, f'{tax_percentage[i]:.1f}%', ha='center', va='center')

plt.tight_layout()
plt.show()
Output:
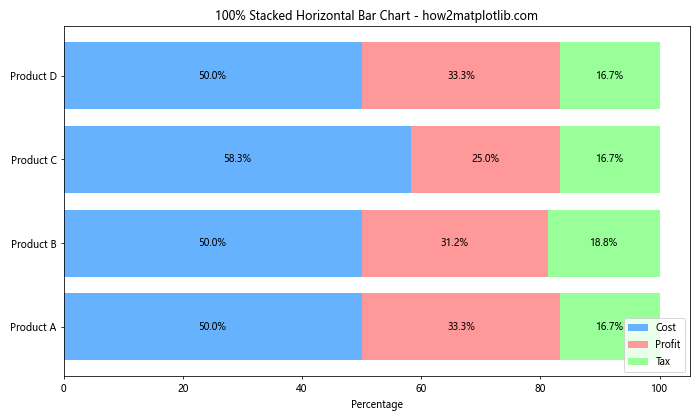
This example creates a 100% stacked horizontal bar chart where each bar shows the percentage breakdown of cost, profit, and tax for different products. We calculate the percentages and then use these to create the stacked bars. We also add percentage labels within each segment of the bars.
Creating Multi-panel Horizontal Bar Charts with Matplotlib
Sometimes, you may want to create multiple horizontal bar charts side by side or in a grid layout for comparison. Matplotlib’s subplots function makes it easy to create such multi-panel charts.
Here’s an example of creating a side-by-side comparison of two horizontal bar charts:
import matplotlib.pyplot as plt

categories = ['Category A', 'Category B', 'Category C', 'Category D']
values1 = [25, 40, 30, 55]
values2 = [30, 35, 25, 60]

fig, (ax1, ax2) = plt.subplots(1, 2, figsize=(15, 6))

# First subplot
ax1.barh(categories, values1, color='#66B2FF')
ax1.set_xlabel('Values')
ax1.set_title('Chart 1 - how2matplotlib.com')

# Second subplot
ax2.barh(categories, values2, color='#FF9999')
ax2.set_xlabel('Values')
ax2.set_title('Chart 2 - how2matplotlib.com')

# Add value labels
for ax, values in zip([ax1, ax2], [values1, values2]):
    for i, v in enumerate(values):
        ax.text(v, i, f' {v}', va='center')

plt.tight_layout()
plt.show()
Output:
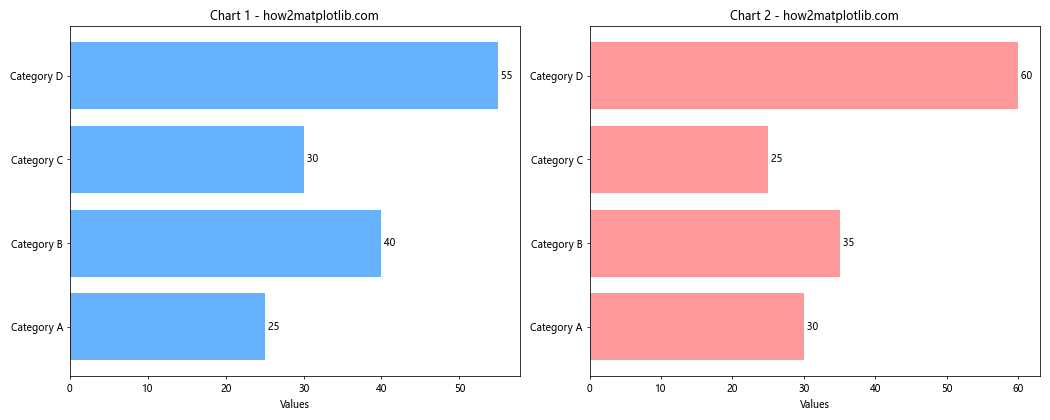
This example creates two horizontal bar charts side by side, allowing for easy comparison between two sets of data.
Animating Matplotlib Bar Chart Horizontal
Animations can make your horizontal bar charts more engaging and can be useful for showing changes over time. Matplotlib provides tools for creating animations, including the animation module.
Here’s an example of how to create a simple animation of a horizontal bar chart:
import matplotlib.pyplot as plt
import matplotlib.animation as animation
import numpy as np

# Prepare data
categories = ['A', 'B', 'C', 'D', 'E']
data = np.random.randint(0, 100, (50, 5))  # 50 frames, 5 categories

fig, ax = plt.subplots(figsize=(10, 6))

def animate(frame):
    ax.clear()
    bars = ax.barh(categories, data[frame], color=plt.cm.viridis(np.linspace(0, 1, 5)))
    ax.set_xlim(0, 100)
    ax.set_title(f'Frame {frame + 1} - how2matplotlib.com')

    # Add value labels
    for bar in bars:
        width = bar.get_width()
        ax.text(width, bar.get_y() + bar.get_height()/2, f'{width}',
                ha='left', va='center', fontweight='bold', fontsize=10, padding=5)

ani = animation.FuncAnimation(fig, animate, frames=50, interval=200, repeat=True)

plt.tight_layout()
plt.show()
Output:
This example creates an animation of a horizontal bar chart where the values change in each frame. The animate function is called for each frame, clearing the previous plot and drawing a new one with updated data.
You can also create more complex animations, such as a race chart:
import matplotlib.pyplot as plt
import matplotlib.animation as animation
import numpy as np

# Prepare data
categories = ['A', 'B', 'C', 'D', 'E']
data = np.cumsum(np.random.randint(1, 20, (50, 5)), axis=0)  # 50 frames, 5 categories

fig, ax = plt.subplots(figsize=(10, 6))

def animate(frame):
    ax.clear()
    current_data = data[frame]
    sorted_data = sorted(zip(current_data, categories), reverse=True)
    values, cats = zip(*sorted_data)

    bars = ax.barh(cats, values, color=plt.cm.viridis(np.linspace(0, 1, 5)))
    ax.set_xlim(0, data.max())
    ax.set_title(f'Race Chart - Frame {frame + 1} - how2matplotlib.com')

    # Add value labels
    for bar in bars:
        width = bar.get_width()
        ax.text(width, bar.get_y() + bar.get_height()/2, f'{width}',
                ha='left', va='center', fontweight='bold', fontsize=10, padding=5)

ani = animation.FuncAnimation(fig, animate, frames=50, interval=200, repeat=True)

plt.tight_layout()
plt.show()
Output:
This example creates a “race chart” animation where the bars are sorted in each frame based on their current values. This type of animation is particularly effective for showing how rankings change over time.
Matplotlib bar chart horizontal Conclusion
Matplotlib bar chart horizontal is a versatile and powerful tool for data visualization. Throughout this comprehensive guide, we’ve explored various aspects of creating and customizing horizontal bar charts, from basic plots to advanced techniques like animations and multi-panel charts.