How to Create and Customize Matplotlib Bar Chart Legends: A Comprehensive Guide
Matplotlib bar chart legend is an essential component of data visualization that helps readers understand the meaning of different bars in a bar chart. This comprehensive guide will explore various aspects of creating and customizing legends for matplotlib bar charts, providing you with the knowledge and tools to enhance your data visualizations effectively.
Introduction to Matplotlib Bar Chart Legends
Matplotlib bar chart legends are crucial elements that provide context and clarity to your visualizations. They help identify different categories or groups represented by the bars in your chart. A well-designed legend can significantly improve the readability and interpretability of your bar charts.
Let’s start with a simple example of creating a bar chart with a legend:
import matplotlib.pyplot as plt

categories = ['A', 'B', 'C', 'D']
values = [10, 20, 15, 25]

plt.figure(figsize=(8, 6))
bars = plt.bar(categories, values)
plt.legend(['Data from how2matplotlib.com'])
plt.title('Simple Bar Chart with Legend')
plt.xlabel('Categories')
plt.ylabel('Values')
plt.show()
Output:
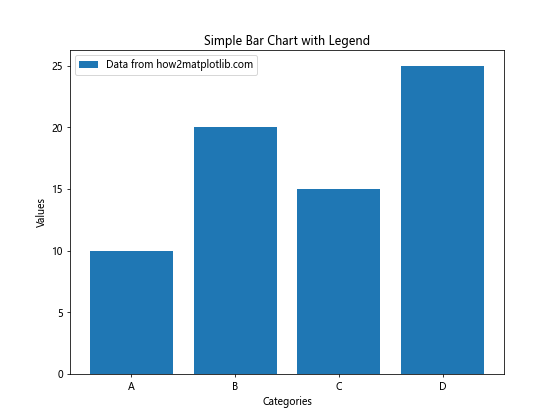
In this example, we create a basic bar chart and add a simple legend using the plt.legend() function. The legend displays a single entry, “Data from how2matplotlib.com”, which represents all the bars in the chart.
Adding Multiple Legend Entries to Matplotlib Bar Charts
When working with more complex data, you may need to add multiple legend entries to your matplotlib bar chart. This is particularly useful when you have different categories or groups of data represented by different bars.
Here’s an example of creating a bar chart with multiple legend entries:
import matplotlib.pyplot as plt
import numpy as np

categories = ['A', 'B', 'C', 'D']
values1 = [10, 20, 15, 25]
values2 = [8, 18, 12, 22]

x = np.arange(len(categories))
width = 0.35

fig, ax = plt.subplots(figsize=(10, 6))
rects1 = ax.bar(x - width/2, values1, width, label='Group 1')
rects2 = ax.bar(x + width/2, values2, width, label='Group 2')

ax.set_xlabel('Categories')
ax.set_ylabel('Values')
ax.set_title('Bar Chart with Multiple Legend Entries')
ax.set_xticks(x)
ax.set_xticklabels(categories)
ax.legend(title='Data from how2matplotlib.com')

plt.tight_layout()
plt.show()
Output:
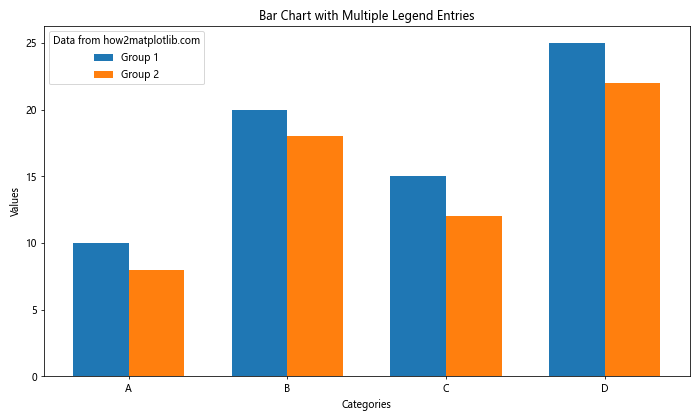
In this example, we create two sets of bars representing different groups of data. We use the label parameter in the ax.bar() function to specify the legend entries for each group. The ax.legend() function is then used to display the legend with a title.
Customizing Legend Appearance in Matplotlib Bar Charts
Matplotlib offers various options to customize the appearance of legends in bar charts. You can modify properties such as position, font size, color, and more to make your legend more visually appealing and informative.
Here’s an example demonstrating some legend customization options:
import matplotlib.pyplot as plt

categories = ['A', 'B', 'C', 'D']
values = [10, 20, 15, 25]

plt.figure(figsize=(8, 6))
bars = plt.bar(categories, values, label='Data')

plt.legend(title='Data from how2matplotlib.com',
           loc='upper right',
           fontsize=12,
           fancybox=True,
           shadow=True,
           borderpad=1)

plt.title('Bar Chart with Customized Legend')
plt.xlabel('Categories')
plt.ylabel('Values')
plt.show()
Output:
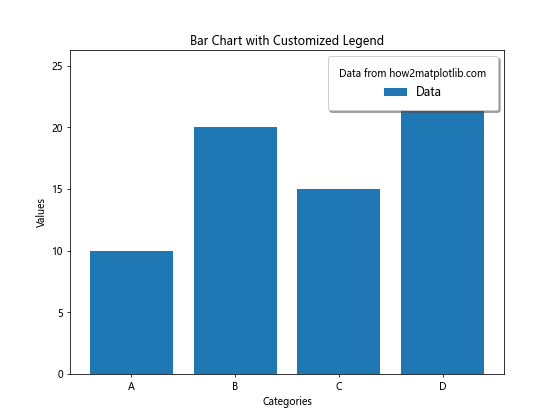
In this example, we customize the legend appearance using various parameters:
title: Sets the legend titleloc: Specifies the legend positionfontsize: Adjusts the font size of legend entriesfancybox: Adds a rounded box around the legendshadow: Adds a shadow effect to the legend boxborderpad: Adjusts the padding between the legend border and its contents
Creating Legends for Stacked Bar Charts in Matplotlib
Stacked bar charts are useful for displaying multiple categories of data in a single bar. Creating legends for stacked bar charts requires a slightly different approach compared to simple bar charts.
Here’s an example of creating a legend for a stacked bar chart:
import matplotlib.pyplot as plt
import numpy as np

categories = ['A', 'B', 'C', 'D']
values1 = [10, 20, 15, 25]
values2 = [5, 10, 8, 12]
values3 = [3, 7, 5, 8]

fig, ax = plt.subplots(figsize=(10, 6))

ax.bar(categories, values1, label='Group 1')
ax.bar(categories, values2, bottom=values1, label='Group 2')
ax.bar(categories, values3, bottom=np.array(values1) + np.array(values2), label='Group 3')

ax.set_xlabel('Categories')
ax.set_ylabel('Values')
ax.set_title('Stacked Bar Chart with Legend')
ax.legend(title='Data from how2matplotlib.com')

plt.tight_layout()
plt.show()
Output:
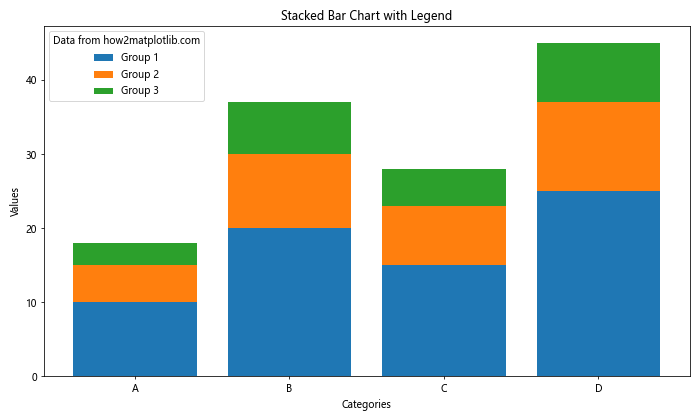
In this example, we create a stacked bar chart with three groups of data. We use the label parameter in each ax.bar() call to specify the legend entries for each group. The bottom parameter is used to stack the bars on top of each other.
Adding Legends to Grouped Bar Charts in Matplotlib
Grouped bar charts display multiple categories side by side for easy comparison. Creating legends for grouped bar charts helps distinguish between different groups of data.
Here’s an example of adding a legend to a grouped bar chart:
import matplotlib.pyplot as plt
import numpy as np

categories = ['A', 'B', 'C', 'D']
group1 = [10, 20, 15, 25]
group2 = [8, 18, 12, 22]
group3 = [12, 22, 17, 27]

x = np.arange(len(categories))
width = 0.25

fig, ax = plt.subplots(figsize=(10, 6))

rects1 = ax.bar(x - width, group1, width, label='Group 1')
rects2 = ax.bar(x, group2, width, label='Group 2')
rects3 = ax.bar(x + width, group3, width, label='Group 3')

ax.set_xlabel('Categories')
ax.set_ylabel('Values')
ax.set_title('Grouped Bar Chart with Legend')
ax.set_xticks(x)
ax.set_xticklabels(categories)
ax.legend(title='Data from how2matplotlib.com')

plt.tight_layout()
plt.show()
Output:
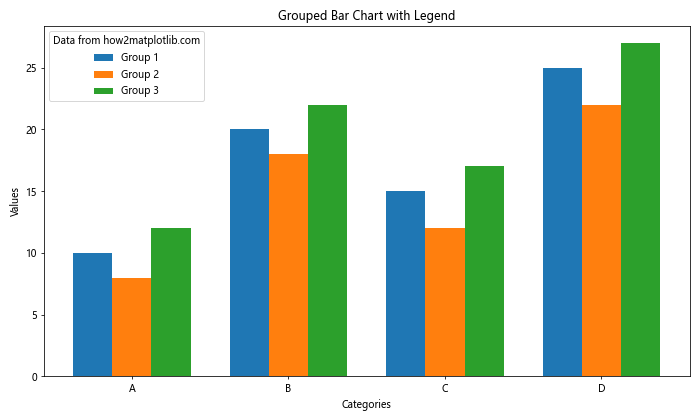
In this example, we create a grouped bar chart with three groups of data. We use the label parameter in each ax.bar() call to specify the legend entries for each group. The width parameter and positioning of the bars create the grouped effect.
Customizing Legend Markers in Matplotlib Bar Charts
Matplotlib allows you to customize the markers (symbols) used in legends to represent different data series. This can be particularly useful when you want to make your legend more visually distinctive or match specific design requirements.
Here’s an example of customizing legend markers:
import matplotlib.pyplot as plt
from matplotlib.patches import Rectangle

categories = ['A', 'B', 'C', 'D']
values1 = [10, 20, 15, 25]
values2 = [8, 18, 12, 22]

fig, ax = plt.subplots(figsize=(10, 6))

bars1 = ax.bar(categories, values1, label='Group 1')
bars2 = ax.bar(categories, values2, bottom=values1, label='Group 2')

custom_legend = [
    Rectangle((0, 0), 1, 1, fc="C0", ec="black", lw=2),
    Rectangle((0, 0), 1, 1, fc="C1", ec="black", lw=2, hatch="//")
]

ax.legend(custom_legend, ['Group 1', 'Group 2'], title='Data from how2matplotlib.com')

ax.set_xlabel('Categories')
ax.set_ylabel('Values')
ax.set_title('Bar Chart with Custom Legend Markers')

plt.tight_layout()
plt.show()
Output:
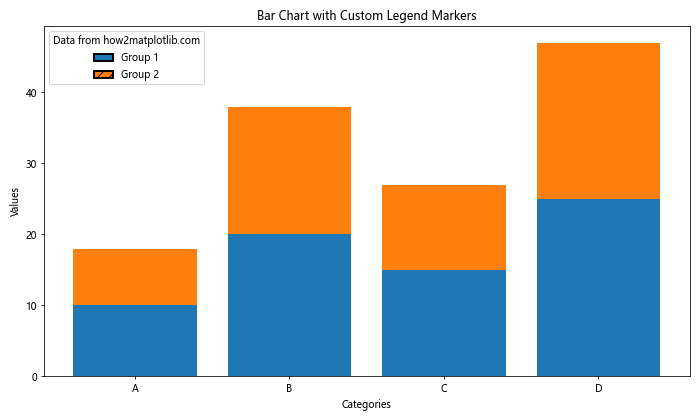
In this example, we create custom legend markers using Rectangle objects. We customize the fill color, edge color, line width, and hatch pattern of the markers to make them visually distinct.
Creating Legends for Horizontal Bar Charts in Matplotlib
Horizontal bar charts are useful for displaying categorical data with long labels. Creating legends for horizontal bar charts follows a similar process to vertical bar charts, with some adjustments to the orientation.
Here’s an example of creating a legend for a horizontal bar chart:
import matplotlib.pyplot as plt

categories = ['Category A', 'Category B', 'Category C', 'Category D', 'Category E']
values1 = [10, 20, 15, 25, 18]
values2 = [8, 18, 12, 22, 16]

fig, ax = plt.subplots(figsize=(10, 6))

ax.barh(categories, values1, label='Group 1')
ax.barh(categories, values2, left=values1, label='Group 2')

ax.set_xlabel('Values')
ax.set_ylabel('Categories')
ax.set_title('Horizontal Bar Chart with Legend')
ax.legend(title='Data from how2matplotlib.com')

plt.tight_layout()
plt.show()
Output:
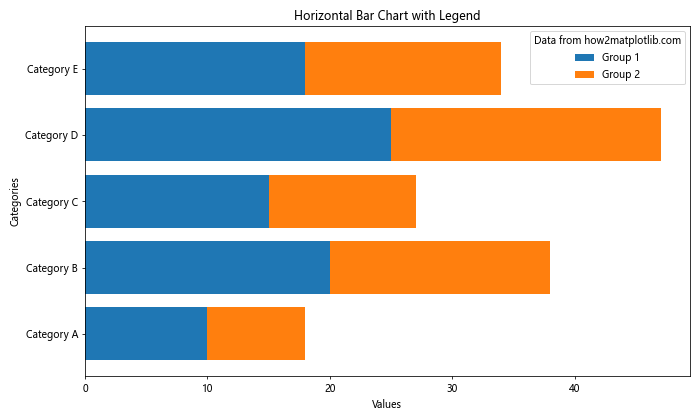
In this example, we create a horizontal stacked bar chart using ax.barh(). The legend is created in the same way as for vertical bar charts, using the label parameter and ax.legend() function.
Handling Overlapping Legends in Matplotlib Bar Charts
When working with complex bar charts or limited space, legend entries may overlap with the chart or each other. Matplotlib provides options to handle overlapping legends effectively.
Here’s an example demonstrating techniques to handle overlapping legends:
import matplotlib.pyplot as plt
import numpy as np

categories = ['A', 'B', 'C', 'D', 'E', 'F', 'G', 'H']
values = np.random.randint(10, 30, size=len(categories))

fig, (ax1, ax2) = plt.subplots(1, 2, figsize=(16, 6))

# Subplot 1: Legend outside the plot
bars1 = ax1.bar(categories, values, label='Data')
ax1.set_title('Legend Outside Plot')
ax1.set_xlabel('Categories')
ax1.set_ylabel('Values')
ax1.legend(title='Data from how2matplotlib.com', bbox_to_anchor=(1.05, 1), loc='upper left')

# Subplot 2: Legend with multiple columns
bars2 = ax2.bar(categories, values, label=['Data ' + str(i+1) for i in range(len(categories))])
ax2.set_title('Multi-column Legend')
ax2.set_xlabel('Categories')
ax2.set_ylabel('Values')
ax2.legend(title='Data from how2matplotlib.com', ncol=4, loc='upper center', bbox_to_anchor=(0.5, -0.15))

plt.tight_layout()
plt.show()
Output:
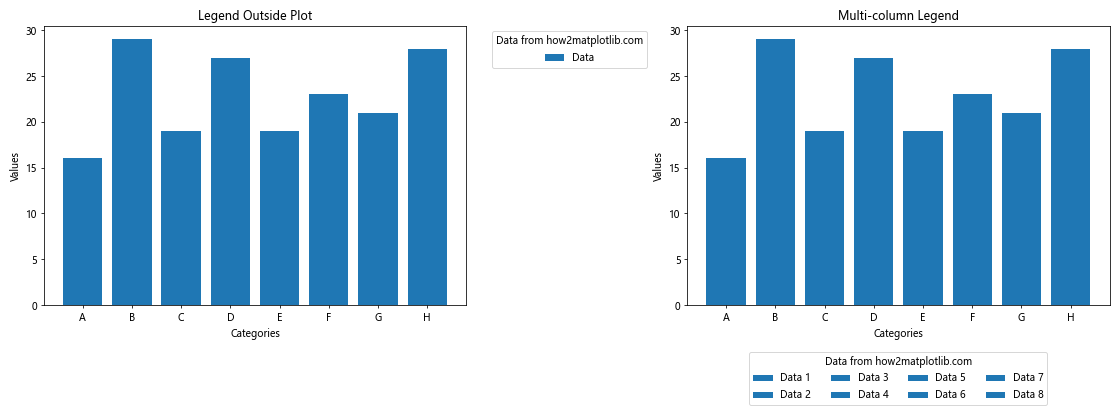
In this example, we demonstrate two techniques for handling overlapping legends:
- Placing the legend outside the plot area using
bbox_to_anchor - Creating a multi-column legend using the
ncolparameter
Adding Interactive Legends to Matplotlib Bar Charts
Interactive legends can enhance the user experience by allowing viewers to toggle the visibility of different data series. While Matplotlib itself doesn’t provide built-in interactivity, you can use libraries like ipywidgets in Jupyter notebooks to create interactive legends.
Here’s an example of creating an interactive legend for a bar chart using ipywidgets:
import matplotlib.pyplot as plt
import ipywidgets as widgets
from IPython.display import display

categories = ['A', 'B', 'C', 'D']
values1 = [10, 20, 15, 25]
values2 = [8, 18, 12, 22]
values3 = [12, 22, 17, 27]

fig, ax = plt.subplots(figsize=(10, 6))

bars1 = ax.bar(categories, values1, label='Group 1')
bars2 = ax.bar(categories, values2, bottom=values1, label='Group 2')
bars3 = ax.bar(categories, values3, bottom=[sum(x) for x in zip(values1, values2)], label='Group 3')

ax.set_xlabel('Categories')
ax.set_ylabel('Values')
ax.set_title('Interactive Bar Chart with Legend')
ax.legend(title='Data from how2matplotlib.com')

plt.tight_layout()

def update_visibility(group, value):
    if group == 'Group 1':
        for bar in bars1:
            bar.set_visible(value)
    elif group == 'Group 2':
        for bar in bars2:
            bar.set_visible(value)
    elif group == 'Group 3':
        for bar in bars3:
            bar.set_visible(value)
    fig.canvas.draw_idle()

group1_checkbox = widgets.Checkbox(value=True, description='Group 1')
group2_checkbox = widgets.Checkbox(value=True, description='Group 2')
group3_checkbox = widgets.Checkbox(value=True, description='Group 3')

widgets.interactive(update_visibility, group=['Group 1', 'Group 2', 'Group 3'], value=True)

display(widgets.VBox([group1_checkbox, group2_checkbox, group3_checkbox]))
plt.show()
In this example, we create a stacked bar chart with three groups of data. We then use ipywidgets to create checkboxes for each group. The update_visibility() function is called when a checkbox is toggled, updating the visibility of the corresponding bars.
Creating Legends for Multiple Bar Charts in Matplotlib Subplots
When working with multiple bar charts in subplots, you may want to create a single legend that applies to all subplots or individual legends for each subplot.
Here’s an example of creating legends for multiple bar charts in subplots:
import matplotlib.pyplot as plt
import numpy as np

categories = ['A', 'B', 'C', 'D']
values1 = np.random.randint(10, 30, size=(3, 4))
values2 = np.random.randint(10, 30, size=(3, 4))

fig, (ax1, ax2, ax3) = plt.subplots(1, 3, figsize=(18, 6))

for ax, data1, data2 in zip([ax1, ax2, ax3], values1, values2):
    ax.bar(categories, data1, label='Group 1')
    ax.bar(categories, data2, bottom=data1, label='Group 2')
    ax.set_xlabel('Categories')
    ax.set_ylabel('Values')
    ax.set_title('Bar Chart')

# Option 1: Individual legends for each subplot
ax1.legend(title='Subplot 1\nData from how2matplotlib.com')
ax2.legend(title='Subplot 2\nData from how2matplotlib.com')
ax3.legend(title='Subplot 3\nData from how2matplotlib.com')

# Option 2: Single legend for all subplots
# fig.legend(title='Data from how2matplotlib.com', loc='lower center', bbox_to_anchor=(0.5, -0.1), ncol=2)

plt.tight_layout()
plt.show()
Output:
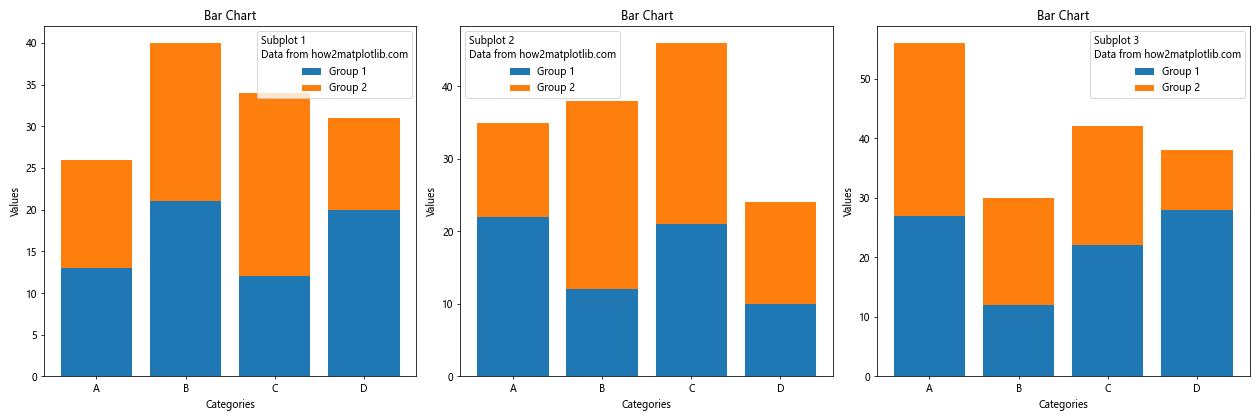
In this example, we create three subplots, each containing a stacked bar chart. We demonstrate two options for creating legends:
- Individual legends for each subplot using
ax.legend() - A single legend for all subplots using
fig.legend()(commented out in this example)
Customizing Legend Text and Font Properties in Matplotlib Bar Charts
Matplotlib allows you to customize various text and font properties of legends to match your visualization style or improve readability.
Here’s an example demonstrating text and font customization for legends:
import matplotlib.pyplot as plt
from matplotlib.font_manager import FontProperties

categories = ['A', 'B', 'C', 'D']
values1 = [10, 20, 15, 25]
values2 = [8, 18, 12, 22]

fig, ax = plt.subplots(figsize=(10, 6))

ax.bar(categories, values1, label='Group 1')
ax.bar(categories, values2, bottom=values1, label='Group 2')

ax.set_xlabel('Categories')
ax.set_ylabel('Values')
ax.set_title('Bar Chart with Customized Legend Text')

custom_font = FontProperties(family='serif', size=12, weight='bold', style='italic')

legend = ax.legend(title='Data from how2matplotlib.com', prop=custom_font)
legend.get_title().set_fontsize('14')
legend.get_title().set_fontweight('bold')

for text in legend.get_texts():
    text.set_color('navy')

plt.tight_layout()
plt.show()
Output:
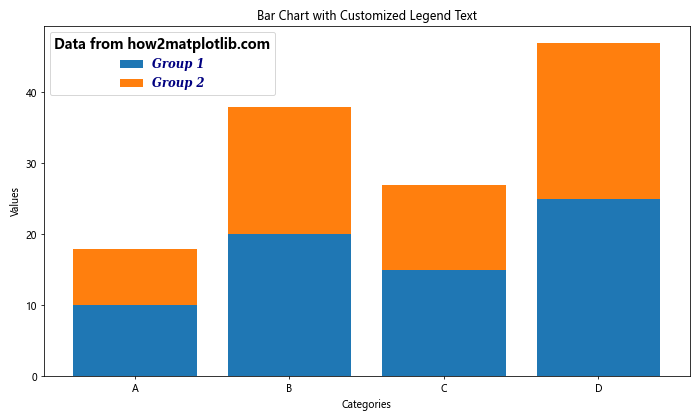
In this example, we customize the legend text and font properties:
- We create a custom
FontPropertiesobject to set the font family, size, weight, and style for legend entries - We use the
propparameter inax.legend()to apply the custom font properties - We adjust the title font size and weight using
legend.get_title().set_fontsize()andlegend.get_title().set_fontweight() - We change the color of legend text using a loop and
text.set_color()
Adding Icons or Images to Matplotlib Bar Chart Legends
In some cases, you may want to use custom icons or images in your legend instead of the default markers. This can be particularly useful for creating more visually appealing or branded visualizations.
Here’s an example of adding custom icons to a bar chart legend:
import matplotlib.pyplot as plt
import numpy as np
from matplotlib.offsetbox import OffsetImage, AnnotationBbox

def create_icon(color, shape):
    fig, ax = plt.subplots(figsize=(0.5, 0.5))
    if shape == 'circle':
        circle = plt.Circle((0.5, 0.5), 0.4, fc=color)
        ax.add_patch(circle)
    elif shape == 'square':
        square = plt.Rectangle((0.1, 0.1), 0.8, 0.8, fc=color)
        ax.add_patch(square)
    ax.axis('off')
    fig.canvas.draw()
    image = np.frombuffer(fig.canvas.tostring_rgb(), dtype='uint8')
    image = image.reshape(fig.canvas.get_width_height()[::-1] + (3,))
    plt.close(fig)
    return image

categories = ['A', 'B', 'C', 'D']
values1 = [10, 20, 15, 25]
values2 = [8, 18, 12, 22]

fig, ax = plt.subplots(figsize=(10, 6))

ax.bar(categories, values1, label='Group 1')
ax.bar(categories, values2, bottom=values1, label='Group 2')

ax.set_xlabel('Categories')
ax.set_ylabel('Values')
ax.set_title('Bar Chart with Custom Legend Icons')

legend = ax.legend(title='Data from how2matplotlib.com')
plt.draw()

icon1 = create_icon('red', 'circle')
icon2 = create_icon('blue', 'square')

for i, icon in enumerate([icon1, icon2]):
    box = OffsetImage(icon, zoom=0.5)
    ab = AnnotationBbox(box, (0, 0.5 - i * 0.25), xybox=(-30, 0),
                        xycoords='axes fraction', boxcoords="offset points",
                        frameon=False)
    ax.add_artist(ab)

plt.tight_layout()
plt.show()
Output:
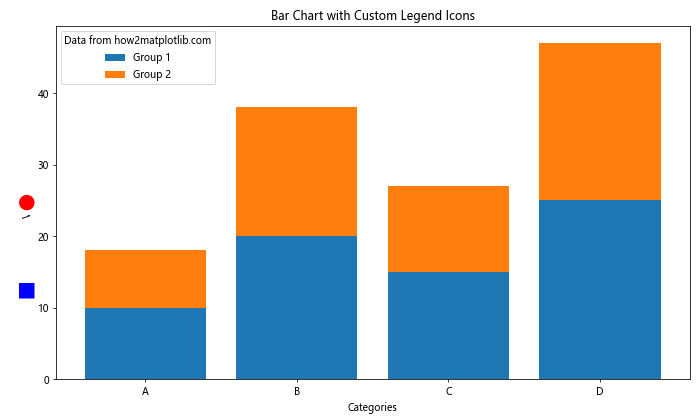
In this example, we create custom icons using the create_icon() function, which generates small images of circles and squares. We then add these icons to the legend using AnnotationBbox objects.
Creating Dynamic Legends for Animated Matplotlib Bar Charts
When creating animated bar charts, you may need to update the legend dynamically as the data changes. Here’s an example of how to create a dynamic legend for an animated bar chart:
import matplotlib.pyplot as plt
import matplotlib.animation as animation
import numpy as np

categories = ['A', 'B', 'C', 'D']
values = np.random.randint(10, 30, size=(4, 4))

fig, ax = plt.subplots(figsize=(10, 6))

def update(frame):
    ax.clear()
    current_values = values[frame]
    bars = ax.bar(categories, current_values)

    ax.set_ylim(0, 35)
    ax.set_xlabel('Categories')
    ax.set_ylabel('Values')
    ax.set_title(f'Animated Bar Chart (Frame {frame + 1})')

    legend_labels = [f'Value: {val}' for val in current_values]
    ax.legend(bars, legend_labels, title=f'Data from how2matplotlib.com\nFrame {frame + 1}')

ani = animation.FuncAnimation(fig, update, frames=4, interval=1000, repeat=True)

plt.tight_layout()
plt.show()
Output:
In this example, we create an animated bar chart where the values change in each frame. The update() function is called for each frame, clearing the previous plot and creating a new bar chart with updated values. The legend is dynamically updated with the current values for each bar.
Matplotlib bar chart legends Conclusion
Matplotlib bar chart legends are powerful tools for enhancing the clarity and informativeness of your data visualizations. Throughout this comprehensive guide, we’ve explored various aspects of creating, customizing, and optimizing legends for bar charts using Matplotlib.