Comprehensive Guide to Matplotlib.axis.Tick.get_sketch_params() in Python
Matplotlib.axis.Tick.get_sketch_params() in Python is a powerful method that allows you to retrieve the sketch parameters of a tick object in Matplotlib. This function is an essential tool for data visualization enthusiasts and professionals who want to fine-tune the appearance of their plots. In this comprehensive guide, we’ll explore the ins and outs of Matplotlib.axis.Tick.get_sketch_params(), providing you with detailed explanations and practical examples to help you master this feature.
Understanding Matplotlib.axis.Tick.get_sketch_params() in Python
Matplotlib.axis.Tick.get_sketch_params() is a method that belongs to the Tick class in Matplotlib’s axis module. It is used to retrieve the sketch parameters of a tick object, which control the appearance of the tick when it is drawn with a sketch-like style. The sketch parameters include three values: scale, length, and randomness.
To better understand how Matplotlib.axis.Tick.get_sketch_params() works, let’s start with a simple example:
import matplotlib.pyplot as plt

fig, ax = plt.subplots()
ax.set_title("How to use Matplotlib.axis.Tick.get_sketch_params() - how2matplotlib.com")
ax.plot([1, 2, 3, 4], [1, 4, 2, 3])

# Get the first x-axis tick
xtick = ax.xaxis.get_major_ticks()[0]

# Get the sketch parameters
sketch_params = xtick.get_sketch_params()

print(f"Sketch parameters: {sketch_params}")

plt.show()
Output:
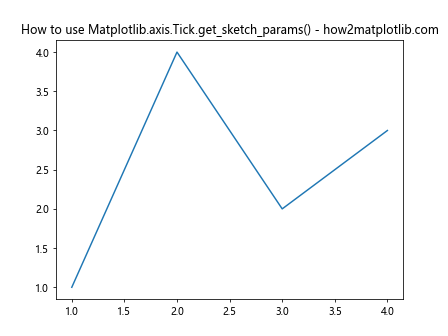
In this example, we create a simple line plot and then retrieve the sketch parameters of the first x-axis tick using Matplotlib.axis.Tick.get_sketch_params(). The returned value is a tuple containing the scale, length, and randomness parameters.
Exploring the Components of Matplotlib.axis.Tick.get_sketch_params()
When you call Matplotlib.axis.Tick.get_sketch_params(), it returns a tuple with three elements:
- Scale: Controls the overall size of the sketch effect
- Length: Determines the length of the sketch lines
- Randomness: Adds a random factor to the sketch effect
Let’s examine each of these components in more detail:
Scale in Matplotlib.axis.Tick.get_sketch_params()
The scale parameter affects the overall size of the sketch effect. A larger scale value will result in a more pronounced sketch appearance. Here’s an example that demonstrates how to set and retrieve the scale parameter:
import matplotlib.pyplot as plt

fig, ax = plt.subplots()
ax.set_title("Matplotlib.axis.Tick.get_sketch_params() Scale - how2matplotlib.com")
ax.plot([1, 2, 3, 4], [1, 4, 2, 3])

# Set sketch parameters for x-axis ticks
for tick in ax.xaxis.get_major_ticks():
    tick.set_sketch_params(scale=5)

# Get and print sketch parameters for the first x-axis tick
xtick = ax.xaxis.get_major_ticks()[0]
sketch_params = xtick.get_sketch_params()
print(f"Sketch parameters: {sketch_params}")

plt.show()
Output:
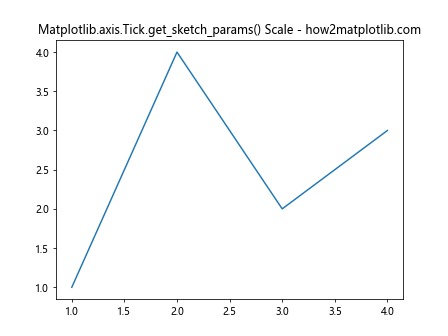
In this example, we set the scale parameter to 5 for all x-axis ticks and then retrieve the sketch parameters for the first tick using Matplotlib.axis.Tick.get_sketch_params().
Length in Matplotlib.axis.Tick.get_sketch_params()
The length parameter determines the length of the sketch lines. A larger length value will result in longer sketch lines. Here’s an example that demonstrates how to set and retrieve the length parameter:
import matplotlib.pyplot as plt

fig, ax = plt.subplots()
ax.set_title("Matplotlib.axis.Tick.get_sketch_params() Length - how2matplotlib.com")
ax.plot([1, 2, 3, 4], [1, 4, 2, 3])

# Set sketch parameters for y-axis ticks
for tick in ax.yaxis.get_major_ticks():
    tick.set_sketch_params(length=10)

# Get and print sketch parameters for the first y-axis tick
ytick = ax.yaxis.get_major_ticks()[0]
sketch_params = ytick.get_sketch_params()
print(f"Sketch parameters: {sketch_params}")

plt.show()
Output:
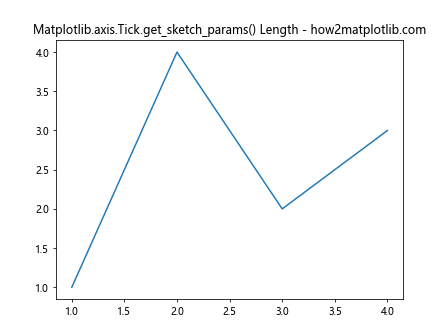
In this example, we set the length parameter to 10 for all y-axis ticks and then retrieve the sketch parameters for the first tick using Matplotlib.axis.Tick.get_sketch_params().
Randomness in Matplotlib.axis.Tick.get_sketch_params()
The randomness parameter adds a random factor to the sketch effect. A larger randomness value will result in a more irregular and hand-drawn appearance. Here’s an example that demonstrates how to set and retrieve the randomness parameter:
import matplotlib.pyplot as plt

fig, ax = plt.subplots()
ax.set_title("Matplotlib.axis.Tick.get_sketch_params() Randomness - how2matplotlib.com")
ax.plot([1, 2, 3, 4], [1, 4, 2, 3])

# Set sketch parameters for both x-axis and y-axis ticks
for tick in ax.xaxis.get_major_ticks() + ax.yaxis.get_major_ticks():
    tick.set_sketch_params(randomness=2)

# Get and print sketch parameters for the first x-axis tick
xtick = ax.xaxis.get_major_ticks()[0]
sketch_params = xtick.get_sketch_params()
print(f"Sketch parameters: {sketch_params}")

plt.show()
Output:
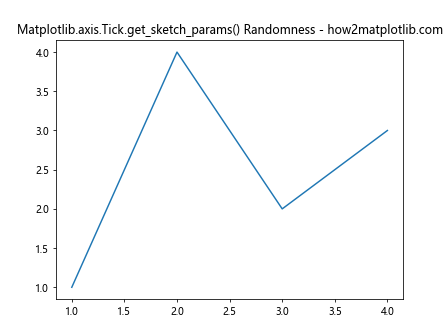
In this example, we set the randomness parameter to 2 for all x-axis and y-axis ticks and then retrieve the sketch parameters for the first x-axis tick using Matplotlib.axis.Tick.get_sketch_params().
Practical Applications of Matplotlib.axis.Tick.get_sketch_params()
Now that we understand the basics of Matplotlib.axis.Tick.get_sketch_params(), let’s explore some practical applications and more advanced usage scenarios.
Customizing Tick Appearance with Matplotlib.axis.Tick.get_sketch_params()
One common use case for Matplotlib.axis.Tick.get_sketch_params() is to customize the appearance of individual ticks. Here’s an example that demonstrates how to create a plot with custom tick styles:
import matplotlib.pyplot as plt
import numpy as np

fig, ax = plt.subplots()
ax.set_title("Custom Tick Styles with Matplotlib.axis.Tick.get_sketch_params() - how2matplotlib.com")

x = np.linspace(0, 10, 100)
y = np.sin(x)
ax.plot(x, y)

# Customize x-axis ticks
for i, tick in enumerate(ax.xaxis.get_major_ticks()):
    if i % 2 == 0:
        tick.set_sketch_params(scale=5, length=10, randomness=1)
    else:
        tick.set_sketch_params(scale=3, length=5, randomness=0.5)

# Get and print sketch parameters for all x-axis ticks
for i, tick in enumerate(ax.xaxis.get_major_ticks()):
    sketch_params = tick.get_sketch_params()
    print(f"Tick {i} sketch parameters: {sketch_params}")

plt.show()
Output:
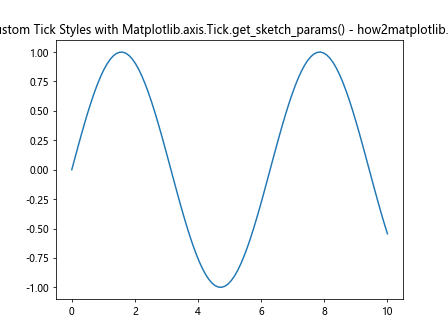
In this example, we create a sine wave plot and customize the x-axis ticks with alternating sketch styles. We then use Matplotlib.axis.Tick.get_sketch_params() to retrieve and print the sketch parameters for all x-axis ticks.
Advanced Techniques with Matplotlib.axis.Tick.get_sketch_params()
Let’s explore some advanced techniques and use cases for Matplotlib.axis.Tick.get_sketch_params() in Python.
Animating Tick Styles with Matplotlib.axis.Tick.get_sketch_params()
You can create animated plots that change tick styles over time using Matplotlib.axis.Tick.get_sketch_params(). Here’s an example that demonstrates this technique:
import matplotlib.pyplot as plt
import matplotlib.animation as animation
import numpy as np

fig, ax = plt.subplots()
ax.set_title("Animated Tick Styles with Matplotlib.axis.Tick.get_sketch_params() - how2matplotlib.com")

x = np.linspace(0, 10, 100)
y = np.sin(x)
line, = ax.plot(x, y)

def animate(frame):
    for tick in ax.xaxis.get_major_ticks() + ax.yaxis.get_major_ticks():
        scale = 5 + 3 * np.sin(frame / 10)
        length = 10 + 5 * np.cos(frame / 10)
        randomness = 2 + np.sin(frame / 5)
        tick.set_sketch_params(scale=scale, length=length, randomness=randomness)

    # Get and print sketch parameters for the first x-axis tick
    xtick = ax.xaxis.get_major_ticks()[0]
    sketch_params = xtick.get_sketch_params()
    print(f"Frame {frame} sketch parameters: {sketch_params}")

    return line,

ani = animation.FuncAnimation(fig, animate, frames=100, interval=50, blit=True)
plt.show()
Output:
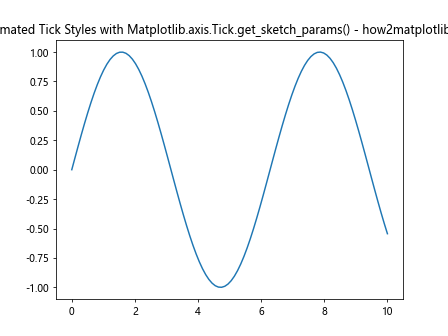
In this example, we create an animated plot where the tick styles change over time. We use Matplotlib.axis.Tick.get_sketch_params() to retrieve and print the sketch parameters for the first x-axis tick in each frame.
Combining Matplotlib.axis.Tick.get_sketch_params() with Other Tick Customizations
You can combine Matplotlib.axis.Tick.get_sketch_params() with other tick customization techniques to create unique and visually appealing plots. Here’s an example that demonstrates this approach:
import matplotlib.pyplot as plt
import numpy as np

fig, ax = plt.subplots(figsize=(10, 6))
ax.set_title("Advanced Tick Customization with Matplotlib.axis.Tick.get_sketch_params() - how2matplotlib.com")

x = np.linspace(0, 10, 100)
y = np.sin(x) * np.exp(-x/10)
ax.plot(x, y)

# Customize x-axis ticks
for i, tick in enumerate(ax.xaxis.get_major_ticks()):
    if i % 2 == 0:
        tick.set_sketch_params(scale=5, length=10, randomness=1)
        tick.label1.set_color('red')
    else:
        tick.set_sketch_params(scale=3, length=5, randomness=0.5)
        tick.label1.set_color('blue')

    tick.label1.set_rotation(45)
    tick.label1.set_fontweight('bold')

# Customize y-axis ticks
for i, tick in enumerate(ax.yaxis.get_major_ticks()):
    tick.set_sketch_params(scale=4, length=8, randomness=1.5)
    tick.label1.set_fontsize(10 + i)

# Get and print sketch parameters for all ticks
for i, tick in enumerate(ax.xaxis.get_major_ticks()):
    sketch_params = tick.get_sketch_params()
    print(f"X-axis tick {i} sketch parameters: {sketch_params}")

for i, tick in enumerate(ax.yaxis.get_major_ticks()):
    sketch_params = tick.get_sketch_params()
    print(f"Y-axis tick {i} sketch parameters: {sketch_params}")

plt.grid(True, linestyle='--', alpha=0.5)
plt.show()
Output:
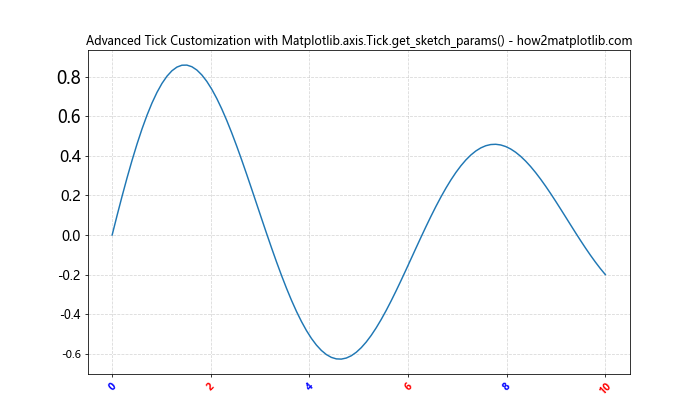
In this example, we combine Matplotlib.axis.Tick.get_sketch_params() with other tick customizations such as color, rotation, and font size to create a unique plot appearance. We also retrieve and print the sketch parameters for all ticks using Matplotlib.axis.Tick.get_sketch_params().
Best Practices for Using Matplotlib.axis.Tick.get_sketch_params()
When working with Matplotlib.axis.Tick.get_sketch_params() in Python, it’s important to follow some best practices to ensure your visualizations are effective and maintainable. Here are some tips to keep in mind:
- Use consistent sketch parameters: When applying sketch effects to multiple ticks or axes, try to use consistent parameters to maintain a cohesive look throughout your plot.
Combine with other styling techniques: Matplotlib.axis.Tick.get_sketch_params() works well in combination with other Matplotlib styling options. Experiment with different combinations to achieve the desired visual effect.
Consider readability: While sketch effects can add visual interest, make sure they don’t compromise the readability of your plot. Use Matplotlib.axis.Tick.get_sketch_params() judiciously to enhance rather than distract from your data visualization.
Document your customizations: When using Matplotlib.axis.Tick.get_sketch_params() to create complex visualizations, document your customizations for future reference and maintainability.
Test different parameter values: Experiment with different scale, length, and randomness values to find the optimal combination for your specific visualization needs.
Troubleshooting Common Issues with Matplotlib.axis.Tick.get_sketch_params()
When working with Matplotlib.axis.Tick.get_sketch_params(), you may encounter some common issues. Here are a few potential problems and their solutions: