Comprehensive Guide to Using Matplotlib.axis.Tick.get_picker() in Python
Matplotlib.axis.Tick.get_picker() in Python is an essential method for customizing and interacting with tick objects in Matplotlib plots. This comprehensive guide will explore the various aspects of using Matplotlib.axis.Tick.get_picker() in Python, providing detailed explanations and practical examples to help you master this powerful feature.
Understanding Matplotlib.axis.Tick.get_picker() in Python
Matplotlib.axis.Tick.get_picker() in Python is a method that allows you to retrieve the picker object associated with a tick in a Matplotlib plot. The picker object determines how the tick responds to mouse events, such as clicking or hovering. By using Matplotlib.axis.Tick.get_picker() in Python, you can customize the interactivity of your plots and create more dynamic visualizations.
Let’s start with a simple example to demonstrate how to use Matplotlib.axis.Tick.get_picker() in Python:
import matplotlib.pyplot as plt

# Create a simple plot
fig, ax = plt.subplots()
ax.plot([1, 2, 3, 4], [1, 4, 2, 3])

# Get the x-axis ticks
x_ticks = ax.get_xticks()

# Get the picker object for the first x-axis tick
first_tick = ax.xaxis.get_major_ticks()[0]
picker = first_tick.get_picker()

print(f"Picker object for the first x-axis tick: {picker}")

plt.title("How2matplotlib.com - Matplotlib.axis.Tick.get_picker() Example")
plt.show()
Output:
In this example, we create a simple line plot and then use Matplotlib.axis.Tick.get_picker() in Python to retrieve the picker object for the first x-axis tick. The picker object is then printed to the console.
The Importance of Matplotlib.axis.Tick.get_picker() in Python
Matplotlib.axis.Tick.get_picker() in Python plays a crucial role in creating interactive and customizable plots. By understanding and utilizing this method, you can:
- Retrieve the current picker settings for ticks
- Modify tick behavior based on user interactions
- Implement custom click or hover events for ticks
- Create more engaging and informative visualizations
Let’s explore these aspects in more detail with examples using Matplotlib.axis.Tick.get_picker() in Python.
Retrieving Picker Settings with Matplotlib.axis.Tick.get_picker() in Python
One of the primary uses of Matplotlib.axis.Tick.get_picker() in Python is to retrieve the current picker settings for ticks. This information can be valuable when you want to understand the existing interactivity of your plot or when you need to modify the picker settings based on certain conditions.
Here’s an example that demonstrates how to retrieve picker settings for both x-axis and y-axis ticks using Matplotlib.axis.Tick.get_picker() in Python:
import matplotlib.pyplot as plt

# Create a simple plot
fig, ax = plt.subplots()
ax.plot([1, 2, 3, 4], [1, 4, 2, 3])

# Get the x-axis and y-axis ticks
x_ticks = ax.xaxis.get_major_ticks()
y_ticks = ax.yaxis.get_major_ticks()

# Retrieve picker settings for x-axis ticks
print("X-axis tick picker settings:")
for i, tick in enumerate(x_ticks):
    picker = tick.get_picker()
    print(f"Tick {i}: {picker}")

# Retrieve picker settings for y-axis ticks
print("\nY-axis tick picker settings:")
for i, tick in enumerate(y_ticks):
    picker = tick.get_picker()
    print(f"Tick {i}: {picker}")

plt.title("How2matplotlib.com - Retrieving Picker Settings")
plt.show()
Output:
In this example, we use Matplotlib.axis.Tick.get_picker() in Python to retrieve the picker settings for both x-axis and y-axis ticks. The picker settings are then printed to the console, allowing you to inspect the current interactivity configuration for each tick.
Modifying Tick Behavior with Matplotlib.axis.Tick.get_picker() in Python
Matplotlib.axis.Tick.get_picker() in Python can be used in conjunction with other methods to modify tick behavior based on user interactions. By retrieving the current picker settings and then updating them, you can create more dynamic and responsive plots.
Here’s an example that demonstrates how to modify tick behavior using Matplotlib.axis.Tick.get_picker() in Python:
import matplotlib.pyplot as plt

def on_pick(event):
    tick = event.artist
    print(f"Clicked on tick: {tick.get_text()}")

# Create a simple plot
fig, ax = plt.subplots()
ax.plot([1, 2, 3, 4], [1, 4, 2, 3])

# Get the x-axis ticks
x_ticks = ax.xaxis.get_major_ticks()

# Modify tick behavior
for tick in x_ticks:
    current_picker = tick.get_picker()
    if current_picker is None:
        tick.set_picker(True)

# Connect the pick event to the on_pick function
fig.canvas.mpl_connect('pick_event', on_pick)

plt.title("How2matplotlib.com - Modifying Tick Behavior")
plt.show()
Output:
In this example, we use Matplotlib.axis.Tick.get_picker() in Python to check if the ticks have a picker object assigned. If not, we set the picker to True, making the ticks clickable. We then connect a pick event to a custom function that prints the clicked tick’s text.
Implementing Custom Events with Matplotlib.axis.Tick.get_picker() in Python
Matplotlib.axis.Tick.get_picker() in Python can be used to implement custom click or hover events for ticks. This allows you to create more interactive and informative visualizations by responding to user actions on specific ticks.
Here’s an example that demonstrates how to implement custom events using Matplotlib.axis.Tick.get_picker() in Python:
import matplotlib.pyplot as plt

def on_tick_hover(event):
    if event.artist in x_ticks:
        tick = event.artist
        value = tick.get_text()
        ax.set_title(f"How2matplotlib.com - Hovering over tick: {value}")
        fig.canvas.draw_idle()

# Create a simple plot
fig, ax = plt.subplots()
ax.plot([1, 2, 3, 4], [1, 4, 2, 3])

# Get the x-axis ticks
x_ticks = ax.xaxis.get_major_ticks()

# Enable hover events for x-axis ticks
for tick in x_ticks:
    tick.set_picker(True)

# Connect the hover event to the on_tick_hover function
fig.canvas.mpl_connect('pick_event', on_tick_hover)

plt.title("How2matplotlib.com - Custom Tick Events")
plt.show()
Output:
In this example, we use Matplotlib.axis.Tick.get_picker() in Python to enable hover events for x-axis ticks. When a user hovers over a tick, the plot title is updated to show the tick value.
Advanced Usage of Matplotlib.axis.Tick.get_picker() in Python
Matplotlib.axis.Tick.get_picker() in Python can be used in more advanced scenarios to create complex interactive visualizations. Let’s explore some advanced techniques and use cases for this method.
Dynamic Picker Modification
Matplotlib.axis.Tick.get_picker() in Python can be used to dynamically modify picker settings based on user interactions or other events. This allows you to create plots that change their interactivity based on certain conditions.
Here’s an example that demonstrates dynamic picker modification using Matplotlib.axis.Tick.get_picker() in Python:
import matplotlib.pyplot as plt

def toggle_picker(event):
    if event.key == 't':
        for tick in x_ticks:
            current_picker = tick.get_picker()
            tick.set_picker(not current_picker)
        plt.title("How2matplotlib.com - Picker Toggled")
        fig.canvas.draw_idle()

def on_pick(event):
    tick = event.artist
    print(f"Clicked on tick: {tick.get_text()}")

# Create a simple plot
fig, ax = plt.subplots()
ax.plot([1, 2, 3, 4, 5, 6], [1, 4, 2, 3, 5, 2])

# Get the x-axis ticks
x_ticks = ax.xaxis.get_major_ticks()

# Initially set all ticks as clickable
for tick in x_ticks:
    tick.set_picker(True)

# Connect events
fig.canvas.mpl_connect('key_press_event', toggle_picker)
fig.canvas.mpl_connect('pick_event', on_pick)

plt.title("How2matplotlib.com - Dynamic Picker Modification")
plt.show()
Output:
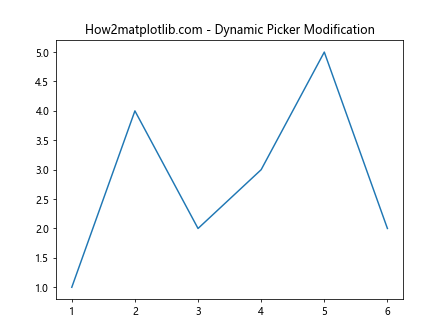
In this example, we use Matplotlib.axis.Tick.get_picker() in Python to implement a toggle functionality. When the user presses the ‘t’ key, the picker settings for all x-axis ticks are toggled between True and False, effectively enabling or disabling their clickability.
Combining Matplotlib.axis.Tick.get_picker() with Other Matplotlib Features
Matplotlib.axis.Tick.get_picker() in Python can be combined with other Matplotlib features to create more sophisticated visualizations. Let’s explore some examples of how this method can be integrated with other Matplotlib functionalities.
Custom Tick Formatting and Picking
You can use Matplotlib.axis.Tick.get_picker() in Python along with custom tick formatting to create interactive plots with specially formatted ticks.
Here’s an example that demonstrates custom tick formatting and picking using Matplotlib.axis.Tick.get_picker() in Python:
import matplotlib.pyplot as plt
import matplotlib.ticker as ticker

def format_tick(value, pos):
    return f"${value:.2f}"

def on_pick(event):
    tick = event.artist
    print(f"Clicked on tick: {tick.get_text()}")

# Create a simple plot
fig, ax = plt.subplots()
ax.plot([1, 2, 3, 4, 5], [10, 20, 15, 30, 25])

# Set custom tick formatter
ax.xaxis.set_major_formatter(ticker.FuncFormatter(format_tick))

# Get the x-axis ticks
x_ticks = ax.xaxis.get_major_ticks()

# Make ticks clickable
for tick in x_ticks:
    tick.set_picker(True)

# Connect the pick event to the on_pick function
fig.canvas.mpl_connect('pick_event', on_pick)

plt.title("How2matplotlib.com - Custom Tick Formatting and Picking")
plt.show()
Output:
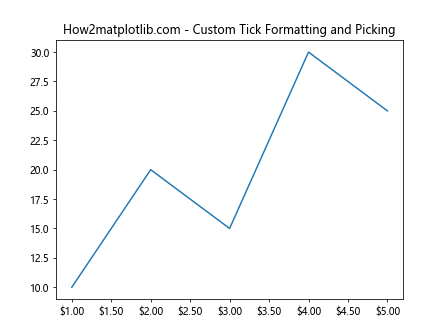
In this example, we use Matplotlib.axis.Tick.get_picker() in Python to make custom-formatted ticks clickable. The ticks are formatted as currency values, and when clicked, they print their text to the console.
Interactive Legends with Tick Picking
Matplotlib.axis.Tick.get_picker() in Python can be used in conjunction with interactive legends to create more dynamic plots. This combination allows users to interact with both the legend and the ticks for a richer experience.
Here’s an example that demonstrates interactive legends with tick picking using Matplotlib.axis.Tick.get_picker() in Python:
import matplotlib.pyplot as plt

def on_pick(event):
    if isinstance(event.artist, plt.Line2D):
        line = event.artist
        visibility = line.get_visible()
        line.set_visible(not visibility)
    elif isinstance(event.artist, plt.Text):
        tick = event.artist
        print(f"Clicked on tick: {tick.get_text()}")
    fig.canvas.draw()

# Create a plot with multiple lines
fig, ax = plt.subplots()
line1, = ax.plot([1, 2, 3, 4], [1, 4, 2, 3], label='Line 1')
line2, = ax.plot([1, 2, 3, 4], [2, 3, 4, 1], label='Line 2')

# Make legend and ticks pickable
legend = ax.legend()
for legline in legend.get_lines():
    legline.set_picker(5)

x_ticks = ax.xaxis.get_major_ticks()
for tick in x_ticks:
    tick.label1.set_picker(True)

# Connect the pick event to the on_pick function
fig.canvas.mpl_connect('pick_event', on_pick)

plt.title("How2matplotlib.com - Interactive Legends and Tick Picking")
plt.show()
Output:
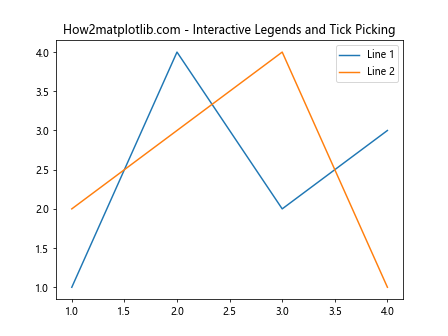
In this example, we use Matplotlib.axis.Tick.get_picker() in Python to make both legend items and x-axis ticks interactive. Clicking on a legend item toggles the visibility of the corresponding line, while clicking on a tick prints its text to the console.
Best Practices for Using Matplotlib.axis.Tick.get_picker() in Python
When working with Matplotlib.axis.Tick.get_picker() in Python, it’s important to follow some best practices to ensure your code is efficient, readable, and maintainable. Here are some tips to keep in mind:
- Always check for existing picker objects before setting new ones to avoid overwriting custom settings.
- Use meaningful names for your event handler functions to improve code readability.
- Consider performance implications when adding interactivity to large numbers of ticks.
- Provide clear visual feedback to users when ticks are interactive.
- Use comments to explain the purpose of your picker implementations, especially for complex interactions.
Let’s look at an example that incorporates these best practices:
import matplotlib.pyplot as plt

def handle_tick_click(event):
    """Handle click events on ticks."""
    if isinstance(event.artist, plt.Text):
        tick = event.artist
        value = float(tick.get_text())
        if value % 2 == 0:
            print(f"Clicked on even tick: {value}")
        else:
            print(f"Clicked on odd tick: {value}")

# Create a simple plot
fig, ax = plt.subplots()
ax.plot([1, 2, 3, 4, 5, 6], [1, 4, 2, 3, 5, 2])

# Get the x-axis ticks
x_ticks = ax.xaxis.get_major_ticks()

# Make ticks clickable and add visual feedback
for tick in x_ticks:
    current_picker = tick.get_picker()
    if current_picker is None:
        tick.set_picker(True)
        tick.label1.set_color('blue')  # Visual feedback for interactive ticks

# Connect the pick event to the handler function
fig.canvas.mpl_connect('pick_event', handle_tick_click)

plt.title("How2matplotlib.com - Best Practices for Tick Picking")
plt.show()
Output:
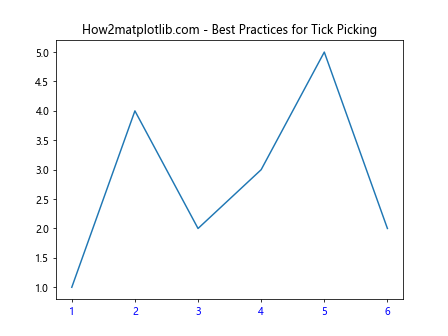
In this example, we follow best practices by checking for existing picker objects, using a descriptive name for the event handler function, providing visual feedback for interactive ticks, and including comments to explain the purpose of the code.
Troubleshooting Common Issues with Matplotlib.axis.Tick.get_picker() in Python
When working with Matplotlib.axis.Tick.get_picker() in Python, you may encounter some common issues. Here are some problems you might face and how to resolve them:
- Picker not working on ticks
- Inconsistent behavior across different Matplotlib versions
- Performance issues with large numbers of interactive ticks
- Conflicts with other interactive elements in the plot
Let’s address each of these issues with examples and solutions.
Issue 1: Picker not working on ticks
If you find that the picker is not working on your ticks, it might be because the picker is not properly set or the event is not connected correctly.
Here’s an example of how to troubleshoot and fix this issue:
import matplotlib.pyplot as plt

def on_pick(event):
    if isinstance(event.artist, plt.Text):
        tick = event.artist
        print(f"Clicked on tick: {tick.get_text()}")

# Create a simple plot
fig, ax = plt.subplots()
ax.plot([1, 2, 3, 4], [1, 4, 2, 3])

# Get the x-axis ticks
x_ticks = ax.xaxis.get_major_ticks()

# Ensure picker is set correctly
for tick in x_ticks:
    tick.label1.set_picker(True)  # Set picker on the tick label

# Connect the pick event to the on_pick function
fig.canvas.mpl_connect('pick_event', on_pick)

plt.title("How2matplotlib.com - Troubleshooting Tick Picker")
plt.show()
Output:
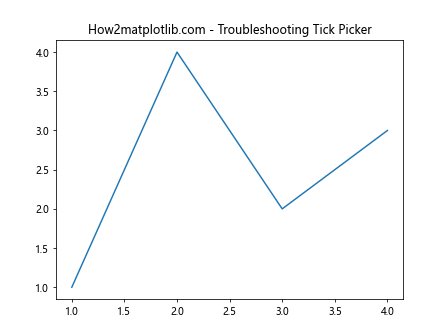
In this example, we ensure that the picker is set on the tick label (tick.label1) rather than the tick itself. We also double-check that the pick event is correctly connected to the handler function.
Issue 2: Inconsistent behavior across different Matplotlib versions
Different versions of Matplotlib may handle tick picking slightly differently. To ensure consistency, it’s a good practice to check the Matplotlib version and adjust your code accordingly.
Here’s an example that demonstrates version-specific handling:
import matplotlib.pyplot as plt
import matplotlib as mpl

def on_pick(event):
    if isinstance(event.artist, plt.Text):
        tick = event.artist
        print(f"Clicked on tick: {tick.get_text()}")

# Create a simple plot
fig, ax = plt.subplots()
ax.plot([1, 2, 3, 4], [1, 4, 2, 3])

# Get the x-axis ticks
x_ticks = ax.xaxis.get_major_ticks()

# Version-specific handling
if mpl.__version__ >= '3.3.0':
    for tick in x_ticks:
        tick.label1.set_picker(True)
else:
    for tick in x_ticks:
        tick.set_picker(True)

# Connect the pick event to the on_pick function
fig.canvas.mpl_connect('pick_event', on_pick)

plt.title(f"How2matplotlib.com - Matplotlib {mpl.__version__} Tick Picking")
plt.show()
Output:
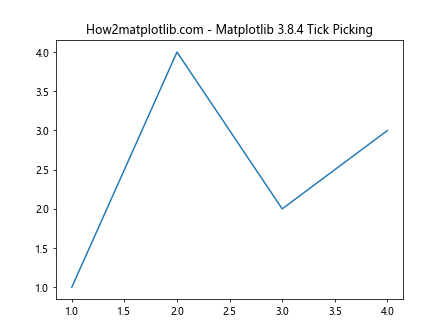
In this example, we check the Matplotlib version and adjust how we set the picker based on whether the version is 3.3.0 or higher.
Issue 3: Performance issues with large numbers of interactive ticks
When dealing with plots that have a large number of ticks, making all of them interactive can lead to performance issues. To mitigate this, you can implement a strategy to make only a subset of ticks interactive or use a more efficient event handling approach.
Here’s an example that demonstrates a performance-optimized approach:
import matplotlib.pyplot as plt

def on_motion(event):
    if event.inaxes == ax:
        for tick in x_ticks:
            if tick.contains(event)[0]:
                print(f"Hovering over tick: {tick.get_text()}")
                return

# Create a plot with many ticks
fig, ax = plt.subplots()
ax.plot(range(100), range(100))

# Get the x-axis ticks
x_ticks = ax.xaxis.get_major_ticks()

# Connect the motion event instead of pick event
fig.canvas.mpl_connect('motion_notify_event', on_motion)

plt.title("How2matplotlib.com - Performance Optimized Tick Interaction")
plt.show()
Output:
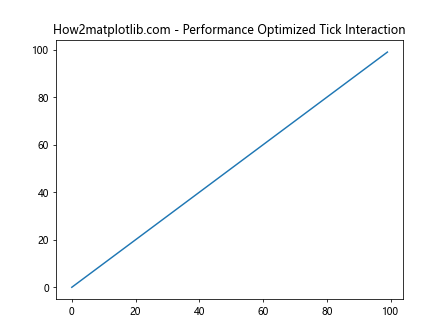
In this example, instead of using Matplotlib.axis.Tick.get_picker() in Python, we use a motion event to check for hover interactions with ticks. This approach can be more efficient for plots with many ticks.
Issue 4: Conflicts with other interactive elements
When using Matplotlib.axis.Tick.get_picker() in Python alongside other interactive elements in your plot, you may encounter conflicts. To resolve this, you can implement a priority system or use different events for different elements.
Here’s an example that demonstrates how to handle potential conflicts:
import matplotlib.pyplot as plt

def on_pick(event):
    if isinstance(event.artist, plt.Line2D):
        line = event.artist
        print(f"Clicked on line: {line.get_label()}")
    elif isinstance(event.artist, plt.Text):
        tick = event.artist
        print(f"Clicked on tick: {tick.get_text()}")

# Create a plot with interactive lines and ticks
fig, ax = plt.subplots()
line1, = ax.plot([1, 2, 3, 4], [1, 4, 2, 3], label='Line 1', picker=5)
line2, = ax.plot([1, 2, 3, 4], [2, 3, 4, 1], label='Line 2', picker=5)

# Get the x-axis ticks
x_ticks = ax.xaxis.get_major_ticks()

# Make ticks clickable
for tick in x_ticks:
    tick.label1.set_picker(True)

# Connect the pick event to the on_pick function
fig.canvas.mpl_connect('pick_event', on_pick)

plt.title("How2matplotlib.com - Handling Multiple Interactive Elements")
plt.show()
Output:
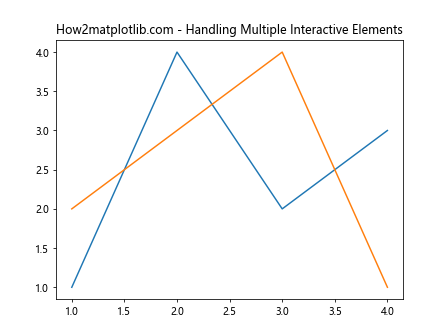
In this example, we handle both line and tick picking in the same event handler, distinguishing between them based on the type of the picked artist.
Advanced Techniques with Matplotlib.axis.Tick.get_picker() in Python
As you become more comfortable with Matplotlib.axis.Tick.get_picker() in Python, you can explore more advanced techniques to create highly interactive and customized visualizations. Let’s look at some advanced use cases and examples.
Animated Tick Interactions
You can combine Matplotlib.axis.Tick.get_picker() in Python with animation features to create dynamic, interactive visualizations that respond to tick interactions.
Here’s an example that demonstrates animated tick interactions:
import matplotlib.pyplot as plt
import matplotlib.animation as animation
import numpy as np

class AnimatedTicks:
    def __init__(self, ax):
        self.ax = ax
        self.highlighted_tick = None

    def on_pick(self, event):
        if isinstance(event.artist, plt.Text):
            tick = event.artist
            self.highlighted_tick = float(tick.get_text())

    def update(self, frame):
        x = np.linspace(0, 10, 100)
        if self.highlighted_tick is not None:
            y = np.sin(x + self.highlighted_tick)
        else:
            y = np.sin(x)
        self.line.set_ydata(y)
        self.ax.set_title(f"How2matplotlib.com - Highlighted: {self.highlighted_tick}")
        return self.line,

# Create the plot
fig, ax = plt.subplots()
x = np.linspace(0, 10, 100)
y = np.sin(x)
animated_ticks = AnimatedTicks(ax)
animated_ticks.line, = ax.plot(x, y)

# Make ticks clickable
for tick in ax.xaxis.get_major_ticks():
    tick.label1.set_picker(True)

# Connect the pick event
fig.canvas.mpl_connect('pick_event', animated_ticks.on_pick)

# Create the animation
anim = animation.FuncAnimation(fig, animated_ticks.update, frames=200, interval=50, blit=True)

plt.title("How2matplotlib.com - Animated Tick Interactions")
plt.show()
Output:
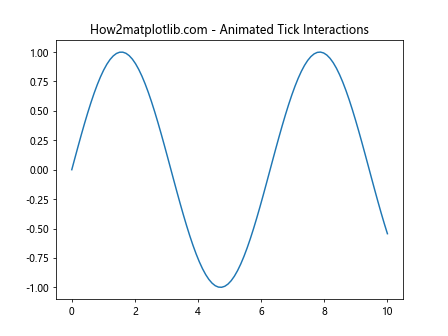
In this example, we use Matplotlib.axis.Tick.get_picker() in Python to create an interactive plot where clicking on a tick changes the phase of a sine wave. The animation continuously updates to reflect the current highlighted tick value.
Conclusion
Matplotlib.axis.Tick.get_picker() in Python is a powerful method that allows you to create interactive and customizable visualizations. Throughout this comprehensive guide, we’ve explored various aspects of using this method, from basic usage to advanced techniques.