How can I place a table on a plot in Matplotlib
Matplotlib is a powerful plotting library used for creating static, interactive, and animated visualizations in Python. One of the useful features of Matplotlib is its ability to add tables to plots. This can be particularly handy when you want to display data directly on the plot for better understanding and clarity. In this article, we will explore various ways to place a table on a plot using Matplotlib, along with detailed examples.
1. Basic Table Placement
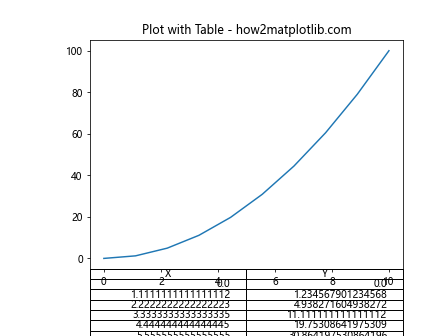
Let’s start with the basics of adding a table to a plot. We will create a simple line plot and add a table at the bottom of the plot that displays some data.
Example 1: Adding a Basic Table to a Plot
import matplotlib.pyplot as plt
import numpy as np

# Data for plotting
x = np.linspace(0, 10, 10)
y = x**2

# Creating the plot
fig, ax = plt.subplots()
ax.plot(x, y, label='y = x^2')

# Data for the table
data = {'X': x, 'Y': y}

# Adding a table at the bottom of the axes
table = ax.table(cellText=list(zip(data['X'], data['Y'])),
                 colLabels=['X', 'Y'],
                 loc='bottom')

# Adjust layout to make room for the table:
plt.subplots_adjust(left=0.2, bottom=0.2)

ax.set_title("Plot with Table - how2matplotlib.com")
plt.show()
Output:
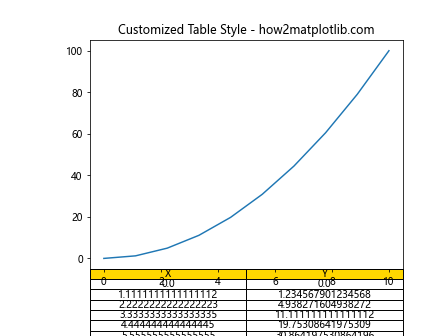
2. Formatting the Table
You can customize the appearance of the table in various ways, such as adjusting the font size, changing the cell colors, and modifying the grid lines.
Example 2: Customizing Table Style
import matplotlib.pyplot as plt
import numpy as np

# Data for plotting
x = np.linspace(0, 10, 10)
y = x**2

# Creating the plot
fig, ax = plt.subplots()
ax.plot(x, y, label='y = x^2')

# Data for the table
data = {'X': x, 'Y': y}

# Adding a table at the bottom of the axes
table = ax.table(cellText=list(zip(data['X'], data['Y'])),
                 colLabels=['X', 'Y'],
                 loc='bottom',
                 cellLoc='center',
                 colColours=['#FFD700', '#FFD700'])

# Adjust layout to make room for the table:
plt.subplots_adjust(left=0.2, bottom=0.2)

ax.set_title("Customized Table Style - how2matplotlib.com")
plt.show()
Output:
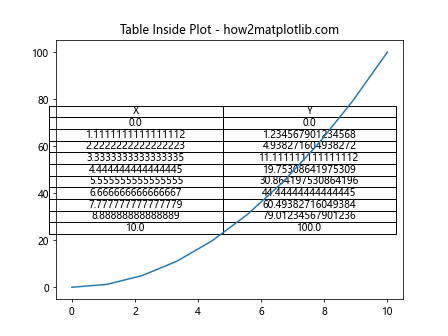
3. Positioning the Table
The location of the table can be adjusted according to your needs. You can place it inside the plot area or outside it, depending on the layout of your visualization.
Example 3: Positioning Table Inside the Plot
import matplotlib.pyplot as plt
import numpy as np

# Data for plotting
x = np.linspace(0, 10, 10)
y = x**2

# Creating the plot
fig, ax = plt.subplots()
ax.plot(x, y, label='y = x^2')

# Data for the table
data = {'X': x, 'Y': y}

# Adding a table inside the plot area
table = ax.table(cellText=list(zip(data['X'], data['Y'])),
                 colLabels=['X', 'Y'],
                 loc='center right',
                 cellLoc='center')

ax.set_title("Table Inside Plot - how2matplotlib.com")
plt.show()
Output:
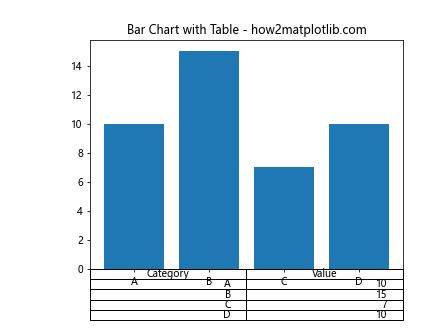
4. Adding a Table to a Bar Chart
Tables can also be added to other types of plots, such as bar charts. This can be useful for providing additional details about the data represented by the bars.
Example 4: Table with a Bar Chart
import matplotlib.pyplot as plt
import numpy as np

# Data for plotting
categories = ['A', 'B', 'C', 'D']
values = [10, 15, 7, 10]

# Creating the bar chart
fig, ax = plt.subplots()
bars = ax.bar(categories, values)

# Data for the table
data = {'Category': categories, 'Value': values}

# Adding a table at the bottom of the axes
table = ax.table(cellText=list(zip(data['Category'], data['Value'])),
                 colLabels=['Category', 'Value'],
                 loc='bottom')

# Adjust layout to make room for the table:
plt.subplots_adjust(left=0.2, bottom=0.2)

ax.set_title("Bar Chart with Table - how2matplotlib.com")
plt.show()
Output:
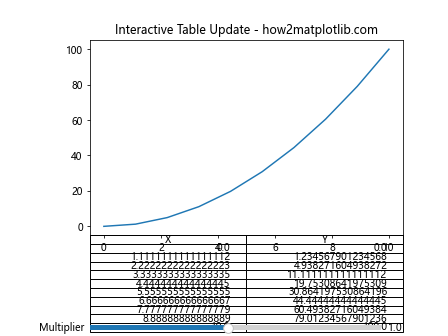
5. Interactive Tables
For interactive plots, you can integrate tables that update based on user input or other dynamic data sources.
Example 5: Interactive Table Update
import matplotlib.pyplot as plt
import numpy as np

# Initial data
x = np.linspace(0, 10, 10)
y = x**2

fig, ax = plt.subplots()
line, = ax.plot(x, y, label='y = x^2')

# Initial table
data = {'X': x, 'Y': y}
table = ax.table(cellText=list(zip(data['X'], data['Y'])),
                 colLabels=['X', 'Y'],
                 loc='bottom')

def update(val):
    y_new = val * x**2
    line.set_ydata(y_new)
    # Update table
    for i, cell in enumerate(table.get_celld().values()):
        if i > 0:  # skip header
            row, col = divmod(i-1, 2)
            cell.get_text().set_text(f'{y_new[row]:.1f}' if col else f'{x[row]:.1f}')

# Slider for interaction
from matplotlib.widgets import Slider
slider_ax = plt.axes([0.2, 0.01, 0.65, 0.03])
slider = Slider(slider_ax, 'Multiplier', 0.1, 2.0, valinit=1)

slider.on_changed(update)

plt.subplots_adjust(left=0.2, bottom=0.3)
ax.set_title("Interactive Table Update - how2matplotlib.com")
plt.show()
Output:
Conclusion
In this article, we explored various ways to add and customize tables in Matplotlib plots. We covered basic table addition, styling, positioning, and even interactive updates. These examples should provide a solid foundation for incorporating tables into your own Matplotlib visualizations to enhance data presentation and user interaction.