How to Master Matplotlib Markers and Fillstyle: A Comprehensive Guide
Matplotlib markers and fillstyle are essential components for creating visually appealing and informative plots in Python. This comprehensive guide will explore the various aspects of matplotlib markers and fillstyle, providing you with the knowledge and skills to enhance your data visualization projects. We’ll cover everything from basic marker types to advanced fillstyle techniques, accompanied by easy-to-understand code examples.
Understanding Matplotlib Markers
Matplotlib markers are symbols used to represent individual data points on a plot. They come in various shapes and sizes, allowing you to differentiate between different data series or highlight specific points of interest. Let’s start by exploring the basic marker types available in matplotlib.
Basic Marker Types
Matplotlib offers a wide range of marker types, including:
- Point markers: ‘.’, ‘,’
- Pixel markers: ‘,’
- Circle markers: ‘o’
- Square markers: ‘s’
- Triangle markers: ‘^’, ‘v’, ‘<', '>‘
- Star markers: ‘*’
- Plus markers: ‘+’
- X markers: ‘x’
- Diamond markers: ‘D’
- Pentagon markers: ‘p’
- Hexagon markers: ‘h’
Let’s create a simple plot using different marker types:
import matplotlib.pyplot as plt

x = [1, 2, 3, 4, 5]
y = [2, 4, 6, 8, 10]

markers = ['.', 'o', 's', '^', 'D']

for i, marker in enumerate(markers):
    plt.plot(x, [yi + i*2 for yi in y], marker=marker, label=f'Marker: {marker}')

plt.title('Different Marker Types in Matplotlib - how2matplotlib.com')
plt.xlabel('X-axis')
plt.ylabel('Y-axis')
plt.legend()
plt.show()
Output:
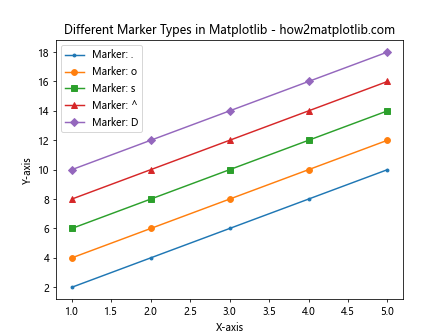
In this example, we create a plot with five different marker types. Each line uses a different marker, demonstrating the variety of options available in matplotlib.
Customizing Marker Size
You can adjust the size of matplotlib markers using the markersize or ms parameter. This allows you to emphasize certain data points or improve visibility on crowded plots.
import matplotlib.pyplot as plt

x = [1, 2, 3, 4, 5]
y = [2, 4, 6, 8, 10]

sizes = [5, 10, 15, 20, 25]

for i, size in enumerate(sizes):
    plt.plot(x, [yi + i*2 for yi in y], marker='o', markersize=size, label=f'Size: {size}')

plt.title('Customizing Marker Sizes in Matplotlib - how2matplotlib.com')
plt.xlabel('X-axis')
plt.ylabel('Y-axis')
plt.legend()
plt.show()
Output:
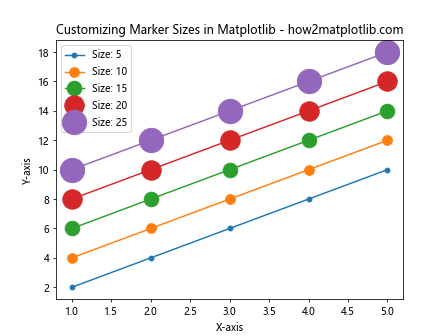
This example demonstrates how to create a plot with markers of different sizes. Each line uses the same marker type (‘o’) but with increasing sizes.
Marker Colors
Matplotlib allows you to customize the color of markers independently from the line color. This can be useful for highlighting specific data points or creating visually distinct data series.
import matplotlib.pyplot as plt

x = [1, 2, 3, 4, 5]
y = [2, 4, 6, 8, 10]

colors = ['red', 'green', 'blue', 'orange', 'purple']

for i, color in enumerate(colors):
    plt.plot(x, [yi + i*2 for yi in y], marker='o', color='gray', markerfacecolor=color, markeredgecolor='black', label=f'Color: {color}')

plt.title('Customizing Marker Colors in Matplotlib - how2matplotlib.com')
plt.xlabel('X-axis')
plt.ylabel('Y-axis')
plt.legend()
plt.show()
Output:
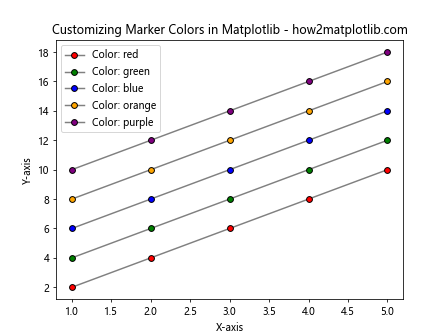
In this example, we create a plot with markers of different colors. The line color is set to gray, while the marker face color varies for each line. The marker edge color is set to black for all markers.
Exploring Matplotlib Fillstyle
Matplotlib fillstyle refers to the way markers are filled or left empty. This feature allows you to create visually distinct markers and convey additional information through your plots.
Basic Fillstyle Options
Matplotlib provides several fillstyle options for markers:
- ‘full’: The marker is completely filled.
- ‘none’: The marker is not filled (only the outline is drawn).
- ‘top’: The top half of the marker is filled.
- ‘bottom’: The bottom half of the marker is filled.
- ‘left’: The left half of the marker is filled.
- ‘right’: The right half of the marker is filled.
Let’s create a plot demonstrating these fillstyle options:
import matplotlib.pyplot as plt

x = [1, 2, 3, 4, 5, 6]
y = [2, 4, 6, 8, 10, 12]

fillstyles = ['full', 'none', 'top', 'bottom', 'left', 'right']

for i, fillstyle in enumerate(fillstyles):
    plt.plot(x, [yi + i*2 for yi in y], marker='o', markersize=15, fillstyle=fillstyle, label=f'Fillstyle: {fillstyle}')

plt.title('Matplotlib Marker Fillstyle Options - how2matplotlib.com')
plt.xlabel('X-axis')
plt.ylabel('Y-axis')
plt.legend()
plt.show()
Output:
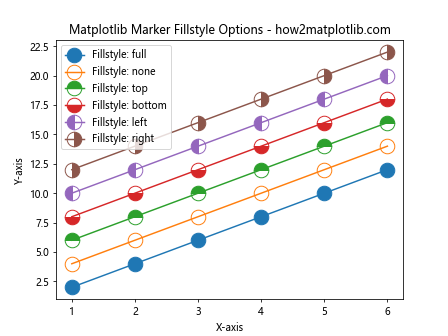
This example creates a plot with markers using different fillstyle options. Each line uses the same marker type (‘o’) but with a different fillstyle.
Combining Fillstyle with Marker Colors
You can combine fillstyle options with marker colors to create even more visually distinct markers. This can be particularly useful when you need to represent multiple data series or categories in a single plot.
import matplotlib.pyplot as plt

x = [1, 2, 3, 4, 5]
y = [2, 4, 6, 8, 10]

fillstyles = ['full', 'none', 'top', 'bottom', 'left']
colors = ['red', 'green', 'blue', 'orange', 'purple']

for i, (fillstyle, color) in enumerate(zip(fillstyles, colors)):
    plt.plot(x, [yi + i*2 for yi in y], marker='o', markersize=15, fillstyle=fillstyle,
             markerfacecolor=color, markeredgecolor='black', label=f'Fillstyle: {fillstyle}, Color: {color}')

plt.title('Combining Fillstyle and Colors in Matplotlib - how2matplotlib.com')
plt.xlabel('X-axis')
plt.ylabel('Y-axis')
plt.legend()
plt.show()
Output:
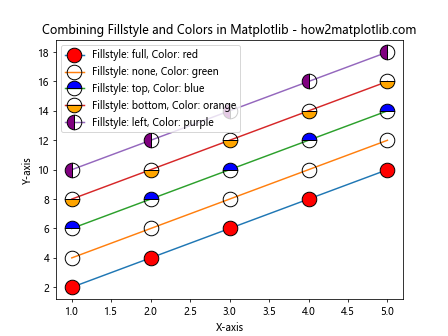
In this example, we combine different fillstyle options with various colors to create a visually rich plot. Each line uses a unique combination of fillstyle and color for its markers.
Advanced Matplotlib Marker Techniques
Now that we’ve covered the basics of matplotlib markers and fillstyle, let’s explore some advanced techniques to further enhance your plots.
Marker Rotation
You can rotate markers to create unique visual effects or to align them with specific data trends. This is particularly useful when working with directional data or when you want to emphasize certain aspects of your plot.
import matplotlib.pyplot as plt
import numpy as np

x = np.linspace(0, 2*np.pi, 20)
y = np.sin(x)

rotations = np.degrees(x)

plt.plot(x, y, linestyle='-', marker=(3, 0, 0), markersize=15,
         markerfacecolor='none', markeredgecolor='blue')

for xi, yi, rot in zip(x, y, rotations):
    plt.plot(xi, yi, marker=(3, 0, rot), markersize=15,
             markerfacecolor='red', markeredgecolor='black')

plt.title('Marker Rotation in Matplotlib - how2matplotlib.com')
plt.xlabel('X-axis')
plt.ylabel('Y-axis')
plt.show()
Output:
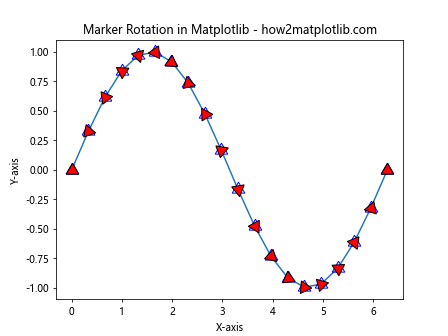
In this example, we create a sine wave plot with triangular markers. The blue markers are not rotated, while the red markers are rotated based on their position along the x-axis. This creates an interesting visual effect that follows the curve of the sine wave.
Varying Marker Properties
You can create more dynamic and informative plots by varying marker properties based on data values. This technique allows you to encode additional information within your markers.
import matplotlib.pyplot as plt
import numpy as np

x = np.linspace(0, 10, 50)
y = np.sin(x)

sizes = np.abs(y) * 100 + 10
colors = plt.cm.viridis(y / 2 + 0.5)

plt.scatter(x, y, s=sizes, c=colors, alpha=0.7, marker='o')

plt.title('Varying Marker Properties in Matplotlib - how2matplotlib.com')
plt.xlabel('X-axis')
plt.ylabel('Y-axis')
plt.colorbar(label='Y-value')
plt.show()
Output:
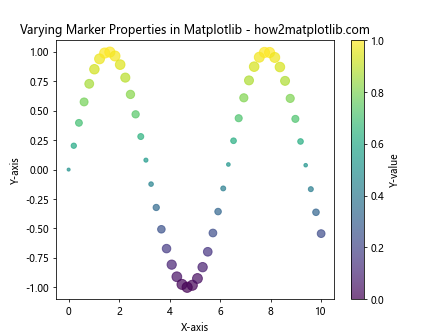
This example creates a scatter plot where the marker size is proportional to the absolute y-value, and the marker color is determined by the y-value. This allows us to represent three dimensions of data (x, y, and magnitude) in a two-dimensional plot.
Combining Matplotlib Markers and Fillstyle with Other Plot Types
Matplotlib markers and fillstyle can be used with various plot types to create more informative and visually appealing visualizations. Let’s explore how to incorporate markers and fillstyle with different plot types.
Scatter Plots with Custom Markers
Scatter plots are ideal for showcasing the versatility of matplotlib markers and fillstyle. You can use different marker shapes, sizes, and colors to represent various data categories or values.
import matplotlib.pyplot as plt
import numpy as np

np.random.seed(42)
x = np.random.rand(50)
y = np.random.rand(50)
colors = np.random.rand(50)
sizes = 1000 * np.random.rand(50)

plt.scatter(x, y, c=colors, s=sizes, alpha=0.5,
            marker='o', edgecolors='black', linewidths=2)

plt.title('Scatter Plot with Custom Markers - how2matplotlib.com')
plt.xlabel('X-axis')
plt.ylabel('Y-axis')
plt.colorbar(label='Color Value')
plt.show()
Output:
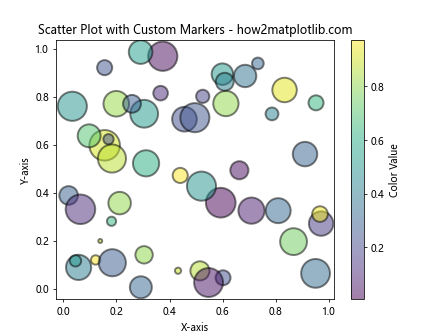
In this example, we create a scatter plot with circular markers. The marker size varies based on the sizes array, and the color is determined by the colors array. The markers have a black edge to improve visibility.
Line Plots with Markers
Adding markers to line plots can help highlight individual data points and make trends more apparent. Let’s create a line plot with custom markers and fillstyles.
import matplotlib.pyplot as plt
import numpy as np

x = np.linspace(0, 10, 20)
y1 = np.sin(x)
y2 = np.cos(x)

plt.plot(x, y1, marker='o', markersize=10, fillstyle='full',
         markerfacecolor='red', markeredgecolor='black', label='Sin(x)')
plt.plot(x, y2, marker='s', markersize=10, fillstyle='none',
         markerfacecolor='blue', markeredgecolor='black', label='Cos(x)')

plt.title('Line Plot with Custom Markers - how2matplotlib.com')
plt.xlabel('X-axis')
plt.ylabel('Y-axis')
plt.legend()
plt.grid(True)
plt.show()
Output:
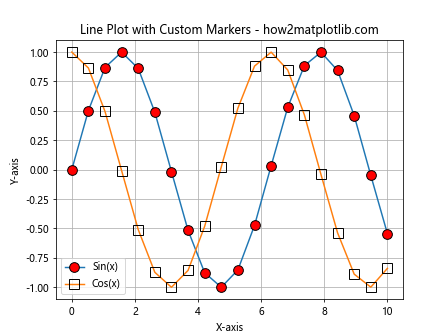
This example creates a line plot with two curves: sin(x) and cos(x). The sin(x) curve uses filled circular markers, while the cos(x) curve uses unfilled square markers. This helps distinguish between the two curves and highlights individual data points.
Bar Plots with Marker Annotations
You can use matplotlib markers to annotate bar plots, adding extra information or highlighting specific data points.
import matplotlib.pyplot as plt
import numpy as np

categories = ['A', 'B', 'C', 'D', 'E']
values = [23, 45, 56, 78, 32]
highlights = [False, True, False, True, False]

fig, ax = plt.subplots()

bars = ax.bar(categories, values, color='lightblue', edgecolor='black')

for i, (bar, highlight) in enumerate(zip(bars, highlights)):
    if highlight:
        ax.plot(bar.get_x() + bar.get_width() / 2, bar.get_height(),
                marker='*', markersize=15, color='red', markeredgecolor='black')

plt.title('Bar Plot with Marker Annotations - how2matplotlib.com')
plt.xlabel('Categories')
plt.ylabel('Values')
plt.show()
Output:
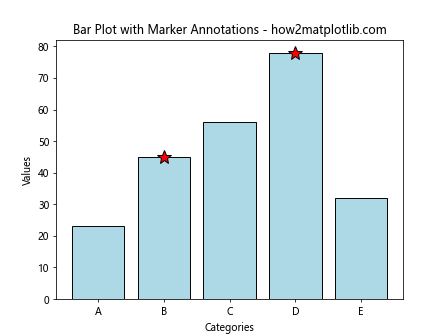
In this example, we create a bar plot and use star markers to highlight specific bars. This technique can be useful for drawing attention to important data points or outliers in your dataset.
Advanced Fillstyle Techniques
Let’s explore some advanced techniques for using fillstyle in matplotlib to create more complex and informative visualizations.
Gradient-Filled Markers
While matplotlib doesn’t directly support gradient-filled markers, we can simulate this effect by overlaying multiple markers with different fillstyles and colors.
import matplotlib.pyplot as plt
import numpy as np

x = np.linspace(0, 10, 10)
y = np.sin(x)

plt.plot(x, y, linestyle='-', color='gray', alpha=0.5)

for xi, yi in zip(x, y):
    plt.plot(xi, yi, marker='o', markersize=20, fillstyle='bottom', markerfacecolor='blue', markeredgecolor='none')
    plt.plot(xi, yi, marker='o', markersize=20, fillstyle='top', markerfacecolor='red', markeredgecolor='black')

plt.title('Gradient-Filled Markers in Matplotlib - how2matplotlib.com')
plt.xlabel('X-axis')
plt.ylabel('Y-axis')
plt.show()
Output:
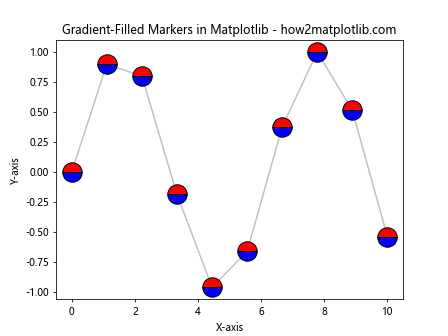
This example creates the illusion of gradient-filled markers by overlaying two half-filled markers with different colors. The bottom half is filled with blue, and the top half is filled with red, creating a two-tone effect.
Combining Markers and Fillstyle with Statistical Plots
Matplotlib markers and fillstyle can be particularly useful when working with statistical plots. Let’s explore how to incorporate these features into some common statistical visualizations.
Box Plots with Custom Markers for Outliers
Box plots are great for visualizing the distribution of data, and custom markers can be used to highlight outliers.
import matplotlib.pyplot as plt
import numpy as np

np.random.seed(42)
data = [np.random.normal(0, std, 100) for std in range(1, 4)]

fig, ax = plt.subplots()

bp = ax.boxplot(data, patch_artist=True)

for element in ['boxes', 'whiskers', 'fliers', 'means', 'medians', 'caps']:
    plt.setp(bp[element], color='black')

for patch in bp['boxes']:
    patch.set_facecolor('lightblue')

plt.setp(bp['fliers'], marker='D', markersize=8, markerfacecolor='red', markeredgecolor='black')

plt.title('Box Plot with Custom Markers for Outliers - how2matplotlib.com')
plt.xlabel('Groups')
plt.ylabel('Values')
plt.show()
Output:
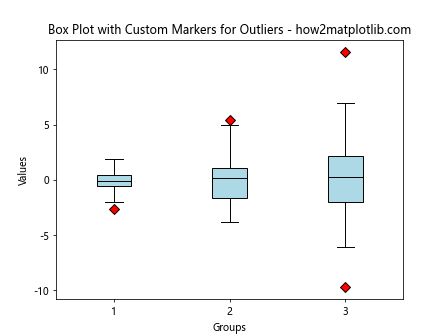
In this example, we create a box plot with custom diamond-shaped markers for outliers. The outlier markers are filled with red and have a black edge, making them stand out from the rest of the plot.
Violin Plots with Marker Annotations
Violin plots can be enhanced with marker annotations to show specific statistics or data points.
import matplotlib.pyplot as plt
import numpy as np
import seaborn as sns

np.random.seed(42)
data = [np.random.normal(0, std, 100) for std in range(1, 4)]

fig, ax = plt.subplots()

parts = ax.violinplot(data, showmeans=False, showmedians=False, showextrema=False)

for pc in parts['bodies']:
    pc.set_facecolor('lightblue')
    pc.set_edgecolor('black')
    pc.set_alpha(0.7)

quartile1, medians, quartile3 = np.percentile(data, [25, 50, 75], axis=1)

inds = np.arange(1, len(medians) + 1)
ax.scatter(inds, medians, marker='o', color='white', s=30, zorder=3)
ax.vlines(inds, quartile1, quartile3, color='k', linestyle='-', lw=5)

plt.title('Violin Plot with Marker Annotations - how2matplotlib.com')
plt.xlabel('Groups')
plt.ylabel('Values')
plt.show()
Output:
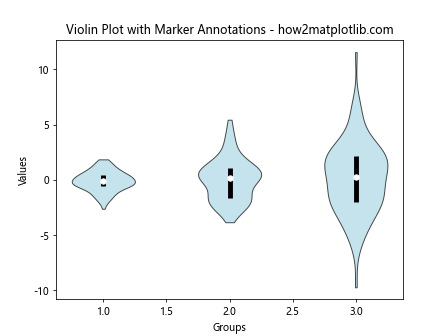
This example creates a violin plot with marker annotations for the median and interquartile range. The median is represented by a white circular marker, while the interquartile range is shown as a black vertical line.
Best Practices for Using Matplotlib Markers and Fillstyle
When working with matplotlib markers and fillstyle, it’s important to follow some best practices to ensure your visualizations are effective and easy to interpret. Here are some guidelines to keep in mind:
- Choose appropriate marker sizes: Ensure that your markers are large enough to be visible but not so large that they obscure other data points or overwhelm the plot.
Use consistent marker styles: When representing different data series, use consistent marker styles throughout your visualization to avoid confusion.
Consider color contrast: Choose marker colors that contrast well with the background and other elements of your plot. This is especially important when using fillstyle options.
Don’t overuse markers: In line plots with many data points, using markers for every point can make the plot cluttered. Consider using markers sparingly or only for key data points.
Combine markers with other visual elements: Use markers in conjunction with other visual elements like color, size, and shape to convey multiple dimensions of information.
Provide a legend: When using different marker styles or colors to represent different data categories, always include a clear legend to explain their meaning.
Consider accessibility: Choose marker styles and colors that are distinguishable for people with color vision deficiencies.
Let’s create an example that demonstrates these best practices: