How to Use Empty Circle Markers in Matplotlib: A Comprehensive Guide
Matplotlib markers empty circle are a powerful tool for data visualization in Python. This article will explore the various aspects of using empty circle markers in Matplotlib, providing detailed explanations and practical examples to help you master this essential feature.
Introduction to Matplotlib Markers Empty Circle
Matplotlib markers empty circle are a specific type of marker used in plotting data points. These markers are particularly useful when you want to emphasize the position of data points without obscuring the underlying plot. Matplotlib offers a wide range of marker styles, and the empty circle is one of the most commonly used options.
To begin working with Matplotlib markers empty circle, you’ll need to import the necessary libraries:
import matplotlib.pyplot as plt
import numpy as np
Now, let’s dive into the various aspects of using Matplotlib markers empty circle in your plots.
Basic Usage of Matplotlib Markers Empty Circle
The most straightforward way to use Matplotlib markers empty circle is by specifying the marker style in the plot function. Here’s a simple example:
import matplotlib.pyplot as plt
import numpy as np

x = np.linspace(0, 10, 20)
y = np.sin(x)

plt.plot(x, y, marker='o', markerfacecolor='none', markersize=10, linestyle='--', label='how2matplotlib.com')
plt.title('Matplotlib Markers Empty Circle Example')
plt.xlabel('X-axis')
plt.ylabel('Y-axis')
plt.legend()
plt.show()
Output:
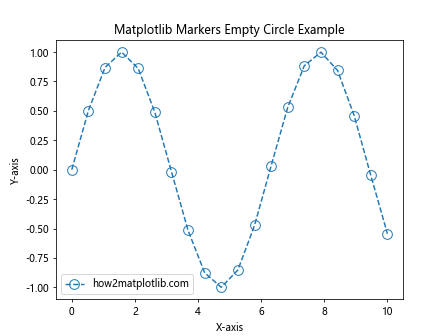
In this example, we use the marker='o' parameter to specify a circular marker, and markerfacecolor='none' to make it an empty circle. The markersize parameter controls the size of the markers.
Customizing Matplotlib Markers Empty Circle
Matplotlib offers various options to customize the appearance of empty circle markers. Let’s explore some of these options:
Marker Size
You can adjust the size of Matplotlib markers empty circle using the markersize or ms parameter:
import matplotlib.pyplot as plt
import numpy as np

x = np.linspace(0, 5, 10)
y1 = x**2
y2 = x**3

plt.plot(x, y1, marker='o', markerfacecolor='none', markersize=5, label='Small how2matplotlib.com')
plt.plot(x, y2, marker='o', markerfacecolor='none', markersize=15, label='Large how2matplotlib.com')
plt.title('Matplotlib Markers Empty Circle - Different Sizes')
plt.xlabel('X-axis')
plt.ylabel('Y-axis')
plt.legend()
plt.show()
Output:
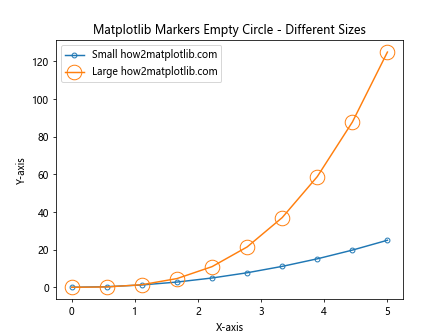
This example demonstrates how to create Matplotlib markers empty circle with different sizes on the same plot.
Marker Edge Color
You can change the edge color of Matplotlib markers empty circle using the markeredgecolor or mec parameter:
import matplotlib.pyplot as plt
import numpy as np

x = np.linspace(0, 5, 10)
y = np.sin(x)

plt.plot(x, y, marker='o', markerfacecolor='none', markeredgecolor='red', markersize=10, label='how2matplotlib.com')
plt.title('Matplotlib Markers Empty Circle - Custom Edge Color')
plt.xlabel('X-axis')
plt.ylabel('Y-axis')
plt.legend()
plt.show()
Output:
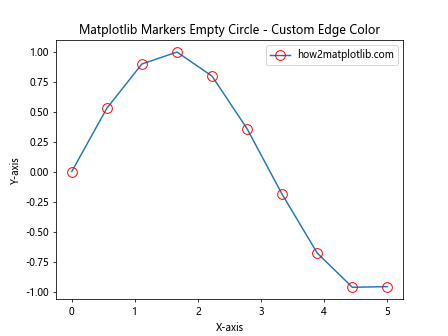
This example shows how to create Matplotlib markers empty circle with a red edge color.
Marker Edge Width
You can adjust the edge width of Matplotlib markers empty circle using the markeredgewidth or mew parameter:
import matplotlib.pyplot as plt
import numpy as np

x = np.linspace(0, 5, 10)
y1 = x**2
y2 = x**3

plt.plot(x, y1, marker='o', markerfacecolor='none', markeredgewidth=1, label='Thin how2matplotlib.com')
plt.plot(x, y2, marker='o', markerfacecolor='none', markeredgewidth=3, label='Thick how2matplotlib.com')
plt.title('Matplotlib Markers Empty Circle - Different Edge Widths')
plt.xlabel('X-axis')
plt.ylabel('Y-axis')
plt.legend()
plt.show()
Output:
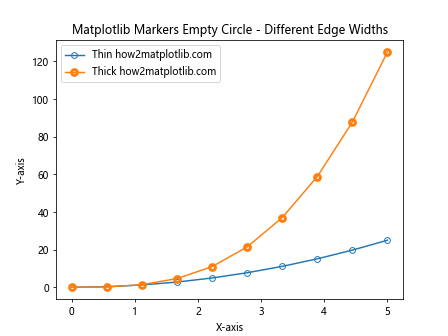
This example demonstrates how to create Matplotlib markers empty circle with different edge widths.
Using Matplotlib Markers Empty Circle in Scatter Plots
While the plot function is commonly used for line plots, you can also use Matplotlib markers empty circle in scatter plots. The scatter function provides more flexibility in customizing individual markers:
import matplotlib.pyplot as plt
import numpy as np

x = np.random.rand(50)
y = np.random.rand(50)
sizes = np.random.rand(50) * 100

plt.scatter(x, y, s=sizes, facecolors='none', edgecolors='blue', label='how2matplotlib.com')
plt.title('Matplotlib Markers Empty Circle in Scatter Plot')
plt.xlabel('X-axis')
plt.ylabel('Y-axis')
plt.legend()
plt.show()
Output:
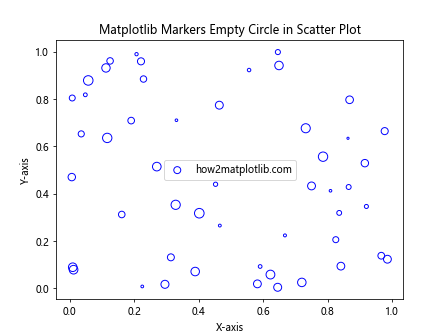
In this example, we use facecolors='none' to create empty circles and edgecolors='blue' to set the edge color. The s parameter controls the size of each marker individually.
Combining Matplotlib Markers Empty Circle with Other Marker Types
You can combine Matplotlib markers empty circle with other marker types to create more informative visualizations:
import matplotlib.pyplot as plt
import numpy as np

x = np.linspace(0, 10, 20)
y1 = np.sin(x)
y2 = np.cos(x)

plt.plot(x, y1, marker='o', markerfacecolor='none', label='Empty Circle how2matplotlib.com')
plt.plot(x, y2, marker='s', markerfacecolor='red', label='Filled Square how2matplotlib.com')
plt.title('Matplotlib Markers Empty Circle and Filled Square')
plt.xlabel('X-axis')
plt.ylabel('Y-axis')
plt.legend()
plt.show()
Output:
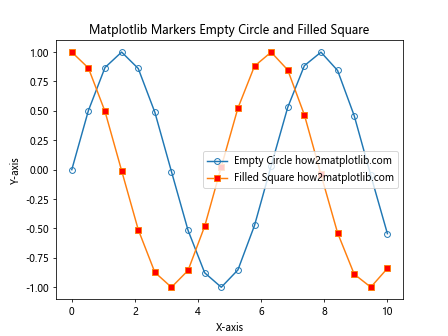
This example shows how to use Matplotlib markers empty circle alongside filled square markers in the same plot.
Using Matplotlib Markers Empty Circle in Subplots
You can use Matplotlib markers empty circle in subplots to create more complex visualizations:
import matplotlib.pyplot as plt
import numpy as np

x = np.linspace(0, 10, 20)
y1 = np.sin(x)
y2 = np.cos(x)

fig, (ax1, ax2) = plt.subplots(1, 2, figsize=(12, 5))

ax1.plot(x, y1, marker='o', markerfacecolor='none', label='how2matplotlib.com')
ax1.set_title('Subplot 1: Sin Function')
ax1.set_xlabel('X-axis')
ax1.set_ylabel('Y-axis')
ax1.legend()

ax2.plot(x, y2, marker='o', markerfacecolor='none', label='how2matplotlib.com')
ax2.set_title('Subplot 2: Cos Function')
ax2.set_xlabel('X-axis')
ax2.set_ylabel('Y-axis')
ax2.legend()

plt.tight_layout()
plt.show()
Output:
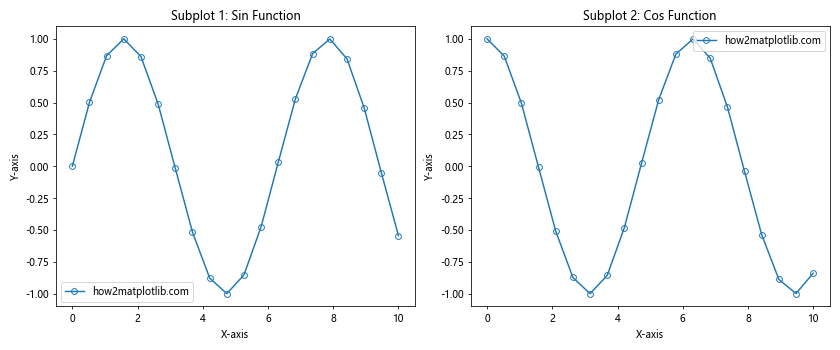
This example demonstrates how to use Matplotlib markers empty circle in two separate subplots.
Animating Matplotlib Markers Empty Circle
You can create animations using Matplotlib markers empty circle to visualize dynamic data:
import matplotlib.pyplot as plt
import numpy as np
from matplotlib.animation import FuncAnimation

fig, ax = plt.subplots()
xdata, ydata = [], []
ln, = ax.plot([], [], 'o', markerfacecolor='none', markersize=10)

def init():
    ax.set_xlim(0, 2*np.pi)
    ax.set_ylim(-1, 1)
    return ln,

def update(frame):
    xdata.append(frame)
    ydata.append(np.sin(frame))
    ln.set_data(xdata, ydata)
    return ln,

ani = FuncAnimation(fig, update, frames=np.linspace(0, 2*np.pi, 128),
                    init_func=init, blit=True)
plt.title('Animated Matplotlib Markers Empty Circle (how2matplotlib.com)')
plt.show()
Output:
This example creates an animation of a sine wave using Matplotlib markers empty circle.
Using Matplotlib Markers Empty Circle with Different Line Styles
You can combine Matplotlib markers empty circle with various line styles to create visually appealing plots:
import matplotlib.pyplot as plt
import numpy as np

x = np.linspace(0, 10, 20)
y1 = np.sin(x)
y2 = np.cos(x)
y3 = np.tan(x)

plt.plot(x, y1, marker='o', markerfacecolor='none', linestyle='-', label='Solid Line how2matplotlib.com')
plt.plot(x, y2, marker='o', markerfacecolor='none', linestyle='--', label='Dashed Line how2matplotlib.com')
plt.plot(x, y3, marker='o', markerfacecolor='none', linestyle=':', label='Dotted Line how2matplotlib.com')
plt.title('Matplotlib Markers Empty Circle with Different Line Styles')
plt.xlabel('X-axis')
plt.ylabel('Y-axis')
plt.legend()
plt.show()
Output:
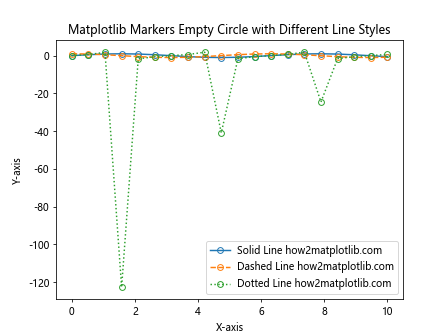
This example demonstrates how to use Matplotlib markers empty circle with solid, dashed, and dotted line styles.
Creating a Custom Marker Style with Matplotlib Markers Empty Circle
You can create custom marker styles by combining Matplotlib markers empty circle with other shapes:
import matplotlib.pyplot as plt
import numpy as np

x = np.linspace(0, 10, 20)
y = np.sin(x)

plt.plot(x, y, marker='o', markerfacecolor='none', markersize=15, label='Outer Circle how2matplotlib.com')
plt.plot(x, y, marker='o', markerfacecolor='red', markersize=5, label='Inner Circle how2matplotlib.com')
plt.title('Custom Marker Style with Matplotlib Markers Empty Circle')
plt.xlabel('X-axis')
plt.ylabel('Y-axis')
plt.legend()
plt.show()
Output:
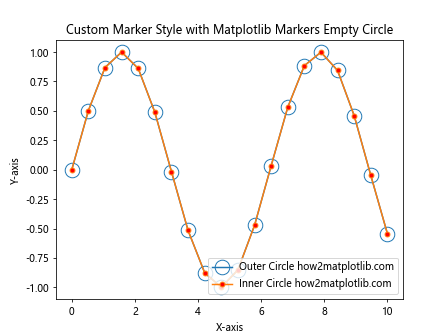
This example creates a custom marker style by overlaying a small filled circle on top of a larger empty circle.
Using Matplotlib Markers Empty Circle in 3D Plots
You can use Matplotlib markers empty circle in 3D plots to visualize three-dimensional data:
import matplotlib.pyplot as plt
import numpy as np

fig = plt.figure()
ax = fig.add_subplot(111, projection='3d')

x = np.random.rand(50)
y = np.random.rand(50)
z = np.random.rand(50)

ax.scatter(x, y, z, marker='o', facecolors='none', edgecolors='blue', s=100, label='how2matplotlib.com')
ax.set_xlabel('X-axis')
ax.set_ylabel('Y-axis')
ax.set_zlabel('Z-axis')
ax.set_title('Matplotlib Markers Empty Circle in 3D Plot')
ax.legend()
plt.show()
Output:
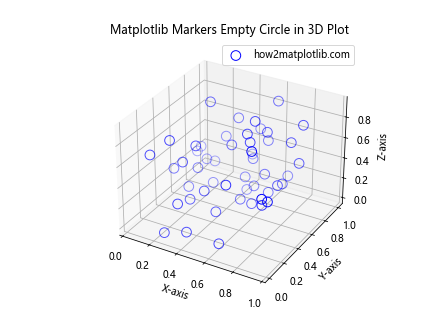
This example demonstrates how to use Matplotlib markers empty circle in a 3D scatter plot.
Applying Matplotlib Markers Empty Circle to Real-World Data
Let’s apply Matplotlib markers empty circle to a real-world dataset:
import matplotlib.pyplot as plt
import numpy as np

# Simulating temperature data for a week
days = ['Mon', 'Tue', 'Wed', 'Thu', 'Fri', 'Sat', 'Sun']
temperatures = [20, 22, 25, 19, 23, 26, 24]

plt.figure(figsize=(10, 6))
plt.plot(days, temperatures, marker='o', markerfacecolor='none', markersize=12, linestyle='-', linewidth=2, label='how2matplotlib.com')
plt.title('Weekly Temperature Data with Matplotlib Markers Empty Circle')
plt.xlabel('Day of the Week')
plt.ylabel('Temperature (°C)')
plt.grid(True, linestyle='--', alpha=0.7)
plt.legend()
plt.show()
Output:
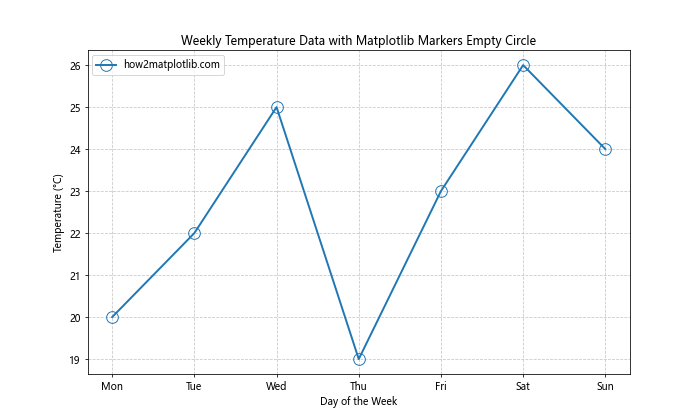
This example uses Matplotlib markers empty circle to visualize temperature data for a week.
Combining Matplotlib Markers Empty Circle with Error Bars
You can combine Matplotlib markers empty circle with error bars to show data uncertainty:
import matplotlib.pyplot as plt
import numpy as np

x = np.linspace(0, 10, 5)
y = np.exp(-x/10.0)
error = 0.1 + 0.2 * np.random.rand(len(x))

plt.errorbar(x, y, yerr=error, fmt='o', markerfacecolor='none', markersize=10, capsize=5, label='how2matplotlib.com')
plt.title('Matplotlib Markers Empty Circle with Error Bars')
plt.xlabel('X-axis')
plt.ylabel('Y-axis')
plt.legend()
plt.show()
Output:
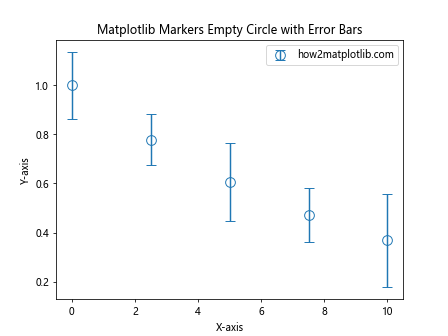
This example demonstrates how to use Matplotlib markers empty circle in combination with error bars.
Using Matplotlib Markers Empty Circle in Polar Plots
Matplotlib markers empty circle can also be used in polar plots:
import matplotlib.pyplot as plt
import numpy as np

theta = np.linspace(0, 2*np.pi, 8, endpoint=False)
r = np.random.rand(8) + 1

ax = plt.subplot(111, projection='polar')
ax.plot(theta, r, marker='o', markerfacecolor='none', markersize=10, linestyle='--', label='how2matplotlib.com')
ax.set_title('Matplotlib Markers Empty Circle in Polar Plot')
ax.legend()
plt.show()
Output:
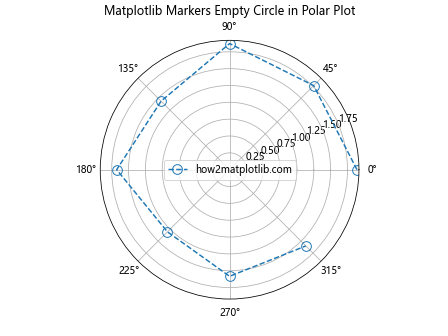
This example shows how to use Matplotlib markers empty circle in a polar plot.
Matplotlib markers empty circle Conclusion
Matplotlib markers empty circle are a versatile and powerful tool for data visualization in Python. They offer a wide range of customization options and can be used in various types of plots, from simple line graphs to complex 3D visualizations. By mastering the use of Matplotlib markers empty circle, you can create more informative and visually appealing plots for your data analysis projects.
Remember to experiment with different marker sizes, colors, and combinations to find the best way to represent your data. The examples provided in this article serve as a starting point, and you can build upon them to create even more sophisticated visualizations using Matplotlib markers empty circle.