Comprehensive Guide to Matplotlib.axis.Axis.get_view_interval() Function in Python
Matplotlib.axis.Axis.get_view_interval() function in Python is an essential method for retrieving the view interval of an axis in Matplotlib plots. This function plays a crucial role in understanding and manipulating the visible range of data displayed on a plot. In this comprehensive guide, we’ll explore the Matplotlib.axis.Axis.get_view_interval() function in depth, covering its usage, parameters, return values, and practical applications in various plotting scenarios.
Understanding the Matplotlib.axis.Axis.get_view_interval() Function
The Matplotlib.axis.Axis.get_view_interval() function is a method of the Axis class in Matplotlib. It returns the view interval, which represents the range of data currently visible on the axis. This function is particularly useful when you need to retrieve the current limits of an axis, especially after zooming or panning operations have been performed on the plot.
Let’s start with a simple example to demonstrate how to use the Matplotlib.axis.Axis.get_view_interval() function:
import matplotlib.pyplot as plt
import numpy as np

# Create a simple plot
x = np.linspace(0, 10, 100)
y = np.sin(x)

fig, ax = plt.subplots()
ax.plot(x, y, label='how2matplotlib.com')
ax.set_title('Matplotlib.axis.Axis.get_view_interval() Example')

# Get the view interval of the x-axis
x_view_interval = ax.xaxis.get_view_interval()
print(f"X-axis view interval: {x_view_interval}")

# Get the view interval of the y-axis
y_view_interval = ax.yaxis.get_view_interval()
print(f"Y-axis view interval: {y_view_interval}")

plt.show()
Output:
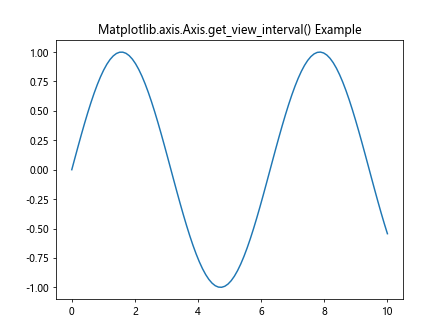
In this example, we create a simple sine wave plot and use the Matplotlib.axis.Axis.get_view_interval() function to retrieve the view intervals for both the x-axis and y-axis. The function returns a tuple containing the minimum and maximum values of the visible range for each axis.
Exploring the Return Value of Matplotlib.axis.Axis.get_view_interval()
The Matplotlib.axis.Axis.get_view_interval() function returns a tuple of two float values representing the minimum and maximum values of the visible range on the axis. Let’s examine the return value in more detail:
import matplotlib.pyplot as plt
import numpy as np

# Create a plot with custom limits
fig, ax = plt.subplots()
ax.plot([1, 2, 3, 4], [1, 4, 2, 3], label='how2matplotlib.com')
ax.set_xlim(0, 5)
ax.set_ylim(0, 6)
ax.set_title('Matplotlib.axis.Axis.get_view_interval() Return Value')

# Get the view intervals
x_interval = ax.xaxis.get_view_interval()
y_interval = ax.yaxis.get_view_interval()

print(f"X-axis view interval: {x_interval}")
print(f"Y-axis view interval: {y_interval}")

plt.show()
Output:
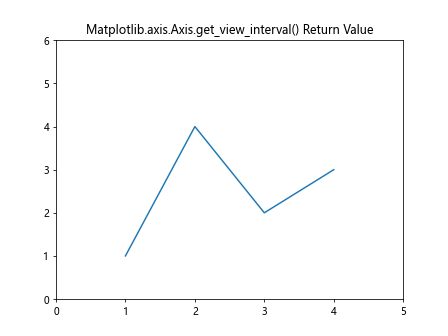
In this example, we set custom limits for both axes using set_xlim() and set_ylim(). The Matplotlib.axis.Axis.get_view_interval() function returns these custom limits as tuples. The first value in each tuple represents the lower limit, and the second value represents the upper limit of the visible range.
Using Matplotlib.axis.Axis.get_view_interval() with Different Plot Types
The Matplotlib.axis.Axis.get_view_interval() function can be used with various types of plots in Matplotlib. Let’s explore how it works with different plot types:
Bar Plot
import matplotlib.pyplot as plt
import numpy as np

# Create a bar plot
categories = ['A', 'B', 'C', 'D']
values = [3, 7, 2, 5]

fig, ax = plt.subplots()
ax.bar(categories, values)
ax.set_title('Matplotlib.axis.Axis.get_view_interval() with Bar Plot')

# Get the view intervals
x_interval = ax.xaxis.get_view_interval()
y_interval = ax.yaxis.get_view_interval()

print(f"X-axis view interval: {x_interval}")
print(f"Y-axis view interval: {y_interval}")

plt.show()
Output:
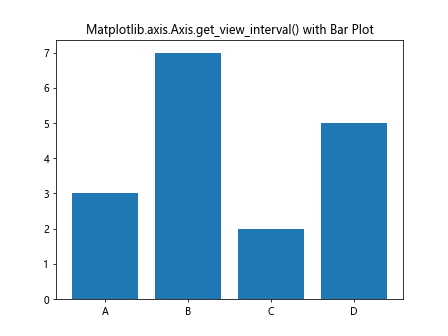
In this bar plot example, the Matplotlib.axis.Axis.get_view_interval() function returns the range of categories on the x-axis and the range of values on the y-axis.
Scatter Plot
import matplotlib.pyplot as plt
import numpy as np

# Create a scatter plot
x = np.random.rand(50)
y = np.random.rand(50)

fig, ax = plt.subplots()
ax.scatter(x, y, label='how2matplotlib.com')
ax.set_title('Matplotlib.axis.Axis.get_view_interval() with Scatter Plot')

# Get the view intervals
x_interval = ax.xaxis.get_view_interval()
y_interval = ax.yaxis.get_view_interval()

print(f"X-axis view interval: {x_interval}")
print(f"Y-axis view interval: {y_interval}")

plt.show()
Output:
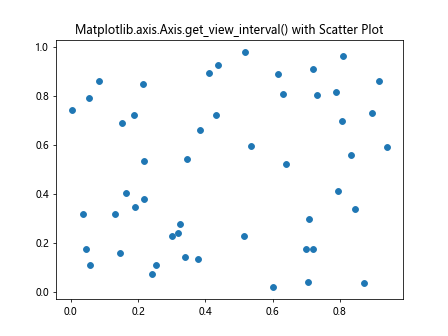
For scatter plots, the Matplotlib.axis.Axis.get_view_interval() function returns the range of x and y coordinates that are currently visible in the plot.
Matplotlib.axis.Axis.get_view_interval() and Axis Scaling
The Matplotlib.axis.Axis.get_view_interval() function works with different axis scaling options, such as linear and logarithmic scales. Let’s see how it behaves with different scales:
Linear Scale
import matplotlib.pyplot as plt
import numpy as np

# Create a plot with linear scale
x = np.linspace(0, 10, 100)
y = np.exp(x)

fig, ax = plt.subplots()
ax.plot(x, y, label='how2matplotlib.com')
ax.set_title('Matplotlib.axis.Axis.get_view_interval() with Linear Scale')

# Get the view intervals
x_interval = ax.xaxis.get_view_interval()
y_interval = ax.yaxis.get_view_interval()

print(f"X-axis view interval (linear): {x_interval}")
print(f"Y-axis view interval (linear): {y_interval}")

plt.show()
Output:
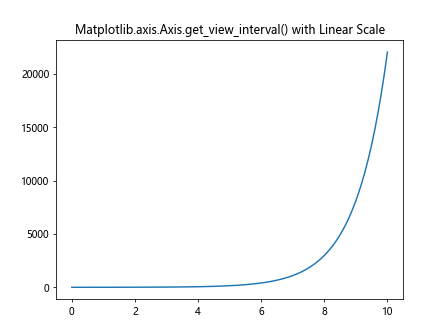
With a linear scale, the Matplotlib.axis.Axis.get_view_interval() function returns the actual data range visible on each axis.
Logarithmic Scale
import matplotlib.pyplot as plt
import numpy as np

# Create a plot with logarithmic y-scale
x = np.linspace(0, 10, 100)
y = np.exp(x)

fig, ax = plt.subplots()
ax.semilogy(x, y, label='how2matplotlib.com')
ax.set_title('Matplotlib.axis.Axis.get_view_interval() with Log Scale')

# Get the view intervals
x_interval = ax.xaxis.get_view_interval()
y_interval = ax.yaxis.get_view_interval()

print(f"X-axis view interval (linear): {x_interval}")
print(f"Y-axis view interval (log): {y_interval}")

plt.show()
Output:
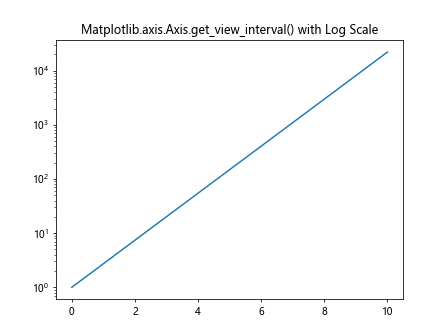
When using a logarithmic scale, the Matplotlib.axis.Axis.get_view_interval() function returns the logarithmic range for the y-axis, while the x-axis remains in linear scale.
Matplotlib.axis.Axis.get_view_interval() and Subplots
The Matplotlib.axis.Axis.get_view_interval() function can be used with subplots to retrieve the view intervals for each individual subplot. Here’s an example:
import matplotlib.pyplot as plt
import numpy as np

# Create subplots
fig, (ax1, ax2) = plt.subplots(2, 1, figsize=(8, 8))
fig.suptitle('Matplotlib.axis.Axis.get_view_interval() with Subplots')

# Plot data in the first subplot
x1 = np.linspace(0, 5, 100)
y1 = np.sin(x1)
ax1.plot(x1, y1, label='how2matplotlib.com')
ax1.set_title('Subplot 1')

# Plot data in the second subplot
x2 = np.linspace(0, 10, 100)
y2 = np.cos(x2)
ax2.plot(x2, y2, label='how2matplotlib.com')
ax2.set_title('Subplot 2')

# Get view intervals for both subplots
for i, ax in enumerate([ax1, ax2], 1):
    x_interval = ax.xaxis.get_view_interval()
    y_interval = ax.yaxis.get_view_interval()
    print(f"Subplot {i} - X-axis view interval: {x_interval}")
    print(f"Subplot {i} - Y-axis view interval: {y_interval}")

plt.tight_layout()
plt.show()
Output:
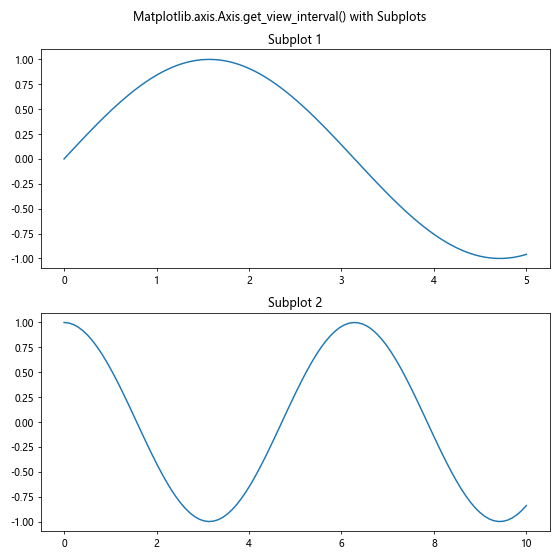
In this example, we create two subplots and use the Matplotlib.axis.Axis.get_view_interval() function to retrieve the view intervals for each subplot separately.
Matplotlib.axis.Axis.get_view_interval() and Zooming
The Matplotlib.axis.Axis.get_view_interval() function is particularly useful when working with interactive plots that allow zooming. Let’s create an example that demonstrates how the view interval changes after zooming:
import matplotlib.pyplot as plt
import numpy as np

# Create a plot
x = np.linspace(0, 10, 100)
y = np.sin(x)

fig, ax = plt.subplots()
ax.plot(x, y, label='how2matplotlib.com')
ax.set_title('Matplotlib.axis.Axis.get_view_interval() and Zooming')

# Get initial view intervals
print("Initial view intervals:")
print(f"X-axis: {ax.xaxis.get_view_interval()}")
print(f"Y-axis: {ax.yaxis.get_view_interval()}")

# Zoom in to a specific region
ax.set_xlim(2, 4)
ax.set_ylim(-0.5, 0.5)

# Get updated view intervals after zooming
print("\nView intervals after zooming:")
print(f"X-axis: {ax.xaxis.get_view_interval()}")
print(f"Y-axis: {ax.yaxis.get_view_interval()}")

plt.show()
Output:
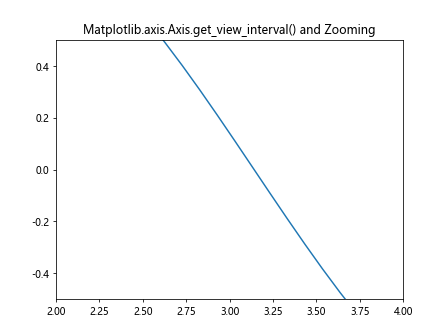
This example demonstrates how the Matplotlib.axis.Axis.get_view_interval() function returns different values before and after zooming, reflecting the current visible range of the plot.
Matplotlib.axis.Axis.get_view_interval() and Polar Plots
The Matplotlib.axis.Axis.get_view_interval() function can also be used with polar plots. Let’s see how it works in this context:
import matplotlib.pyplot as plt
import numpy as np

# Create a polar plot
theta = np.linspace(0, 2*np.pi, 100)
r = np.cos(4*theta)

fig, ax = plt.subplots(subplot_kw={'projection': 'polar'})
ax.plot(theta, r, label='how2matplotlib.com')
ax.set_title('Matplotlib.axis.Axis.get_view_interval() with Polar Plot')

# Get view intervals for polar plot
theta_interval = ax.xaxis.get_view_interval()
r_interval = ax.yaxis.get_view_interval()

print(f"Theta (angle) view interval: {theta_interval}")
print(f"R (radius) view interval: {r_interval}")

plt.show()
Output:
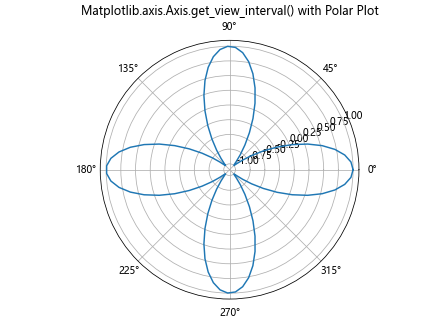
In polar plots, the Matplotlib.axis.Axis.get_view_interval() function returns the range of angles (theta) for the angular axis and the range of radii for the radial axis.
Matplotlib.axis.Axis.get_view_interval() and 3D Plots
The Matplotlib.axis.Axis.get_view_interval() function can be used with 3D plots as well. Here’s an example:
import matplotlib.pyplot as plt
import numpy as np

# Create a 3D plot
fig = plt.figure()
ax = fig.add_subplot(111, projection='3d')

# Generate data for a 3D surface
X = np.arange(-5, 5, 0.25)
Y = np.arange(-5, 5, 0.25)
X, Y = np.meshgrid(X, Y)
R = np.sqrt(X**2 + Y**2)
Z = np.sin(R)

# Plot the surface
surf = ax.plot_surface(X, Y, Z, cmap='viridis')
ax.set_title('Matplotlib.axis.Axis.get_view_interval() with 3D Plot')

# Get view intervals for all three axes
x_interval = ax.xaxis.get_view_interval()
y_interval = ax.yaxis.get_view_interval()
z_interval = ax.zaxis.get_view_interval()

print(f"X-axis view interval: {x_interval}")
print(f"Y-axis view interval: {y_interval}")
print(f"Z-axis view interval: {z_interval}")

plt.show()
Output:
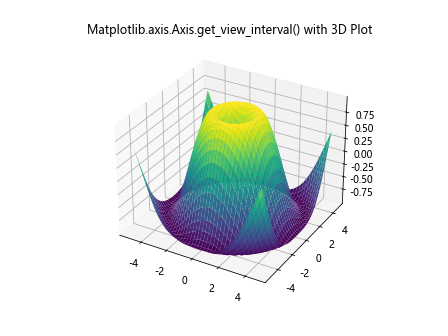
In 3D plots, the Matplotlib.axis.Axis.get_view_interval() function returns the view intervals for all three axes: x, y, and z.
Matplotlib.axis.Axis.get_view_interval() and Custom Tick Locations
The Matplotlib.axis.Axis.get_view_interval() function can be used in conjunction with custom tick locations. Let’s see how it works:
import matplotlib.pyplot as plt
import numpy as np

# Create a plot with custom tick locations
fig, ax = plt.subplots()
x = np.linspace(0, 10, 100)
y = np.sin(x)
ax.plot(x, y, label='how2matplotlib.com')
ax.set_title('Matplotlib.axis.Axis.get_view_interval() with Custom Ticks')

# Set custom tick locations
ax.set_xticks([0, 2.5, 5, 7.5, 10])
ax.set_yticks([-1, -0.5, 0, 0.5, 1])

# Get view intervals
x_interval = ax.xaxis.get_view_interval()
y_interval = ax.yaxis.get_view_interval()

print(f"X-axis view interval: {x_interval}")
print(f"Y-axis view interval: {y_interval}")

plt.show()
Output:
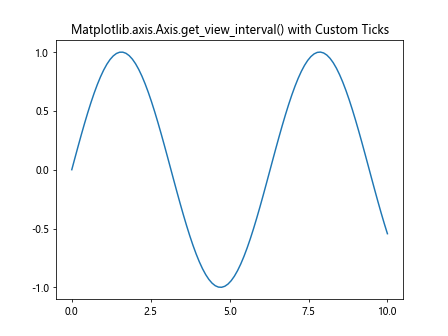
This example demonstrates that the Matplotlib.axis.Axis.get_view_interval() function returns the full range of the axis, regardless of the custom tick locations.
Matplotlib.axis.Axis.get_view_interval() and Date Axes
The Matplotlib.axis.Axis.get_view_interval() function can also be used with date axes. Here’s an example:
import matplotlib.pyplot as plt
import numpy as np
from datetime import datetime, timedelta

# Create a plot with date axis
fig, ax = plt.subplots()
start_date = datetime(2023, 1, 1)
dates = [start_date + timedelta(days=i) for i in range(100)]
values = np.cumsum(np.random.randn(100))

ax.plot(dates, values, label='how2matplotlib.com')
ax.set_title('Matplotlib.axis.Axis.get_view_interval() with Date Axis')

# Format x-axis as dates
plt.gcf().autofmt_xdate()

# Get view intervals
x_interval = ax.xaxis.get_view_interval()
y_interval = ax.yaxis.get_view_interval()

print(f"X-axis (date) view interval: {x_interval}")
print(f"Y-axis view interval: {y_interval}")

plt.show()
Output:
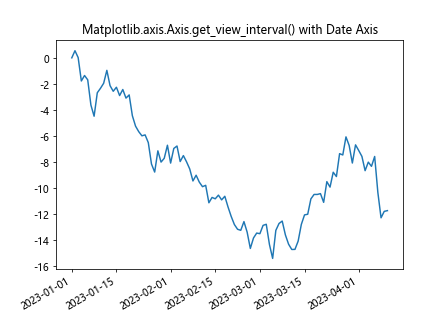
When working with date axes, the Matplotlib.axis.Axis.get_view_interval() function returns the date range as floating-point numbers representing the number of days since the epoch (January 1, 1970).
Matplotlib.axis.Axis.get_view_interval() and Shared Axes
The Matplotlib.axis.Axis.get_view_interval() function can be used with shared axes to compare view intervals across multiple subplots. Here’s an example:
import matplotlib.pyplot as plt
import numpy as np

# Create subplots with shared x-axis
fig, (ax1, ax2) = plt.subplots(2, 1, sharex=True)
fig.suptitle('Matplotlib.axis.Axis.get_view_interval() with Shared Axes')

# Plot data in both subplots
x = np.linspace(0, 10, 100)
y1 = np.sin(x)
y2 = np.cos(x)

ax1.plot(x, y1, label='how2matplotlib.com')
ax2.plot(x, y2, label='how2matplotlib.com')

# Get view intervals for both subplots
for i, ax in enumerate([ax1, ax2], 1):
    x_interval = ax.xaxis.get_view_interval()
    y_interval = ax.yaxis.get_view_interval()
    print(f"Subplot {i} - X-axis view interval: {x_interval}")
    print(f"Subplot {i} - Y-axis view interval: {y_interval}")

plt.tight_layout()
plt.show()
Output:
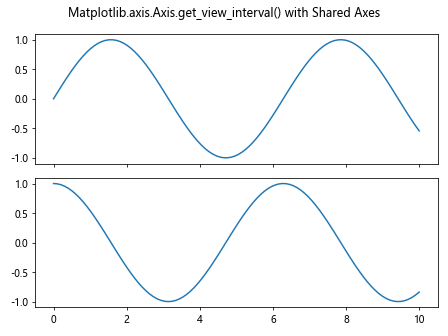
In this example, we create two subplots with a shared x-axis. The Matplotlib.axis.Axis.get_view_interval() function returns the same x-axis view interval for both subplots, while the y-axis view intervals may differ.
Matplotlib.axis.Axis.get_view_interval() and Inverted Axes
The Matplotlib.axis.Axis.get_view_interval() function can be used with inverted axes as well. Let’s see how it behaves:
import matplotlib.pyplot as plt
import numpy as np

# Create a plot with inverted y-axis
fig, ax = plt.subplots()
x = np.linspace(0, 10, 100)
y = np.sin(x)

ax.plot(x, y, label='how2matplotlib.com')
ax.set_title('Matplotlib.axis.Axis.get_view_interval() with Inverted Y-axis')
ax.invert_yaxis()

# Get view intervals
x_interval = ax.xaxis.get_view_interval()
y_interval = ax.yaxis.get_view_interval()

print(f"X-axis view interval: {x_interval}")
print(f"Y-axis view interval (inverted): {y_interval}")

plt.show()
Output:
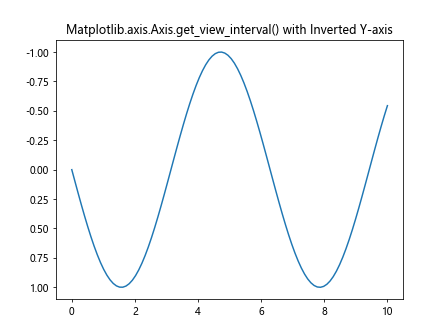
When an axis is inverted, the Matplotlib.axis.Axis.get_view_interval() function still returns the view interval in the original order (min, max), even though the axis direction is reversed on the plot.
Matplotlib.axis.Axis.get_view_interval() and Axis Limits
The Matplotlib.axis.Axis.get_view_interval() function is closely related to axis limits. Let’s explore how it interacts with different ways of setting axis limits:
import matplotlib.pyplot as plt
import numpy as np

# Create a plot
fig, ax = plt.subplots()
x = np.linspace(0, 10, 100)
y = np.sin(x)

ax.plot(x, y, label='how2matplotlib.com')
ax.set_title('Matplotlib.axis.Axis.get_view_interval() and Axis Limits')

# Get initial view intervals
print("Initial view intervals:")
print(f"X-axis: {ax.xaxis.get_view_interval()}")
print(f"Y-axis: {ax.yaxis.get_view_interval()}")

# Set new limits using set_xlim() and set_ylim()
ax.set_xlim(2, 8)
ax.set_ylim(-0.5, 0.5)

# Get updated view intervals
print("\nView intervals after setting limits:")
print(f"X-axis: {ax.xaxis.get_view_interval()}")
print(f"Y-axis: {ax.yaxis.get_view_interval()}")

plt.show()
Output:
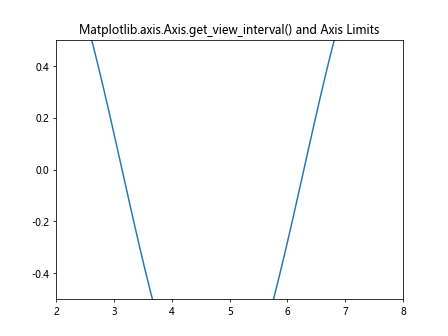
This example demonstrates how the Matplotlib.axis.Axis.get_view_interval() function reflects changes in axis limits set using set_xlim() and set_ylim() methods.
Matplotlib.axis.Axis.get_view_interval() and Autoscaling
The Matplotlib.axis.Axis.get_view_interval() function can be used to observe how autoscaling affects the view interval. Let’s see an example:
import matplotlib.pyplot as plt
import numpy as np

# Create a plot
fig, ax = plt.subplots()
x = np.linspace(0, 10, 100)
y = np.sin(x)

ax.plot(x, y, label='how2matplotlib.com')
ax.set_title('Matplotlib.axis.Axis.get_view_interval() and Autoscaling')

# Get initial view intervals
print("Initial view intervals:")
print(f"X-axis: {ax.xaxis.get_view_interval()}")
print(f"Y-axis: {ax.yaxis.get_view_interval()}")

# Add new data points outside the current range
ax.plot([11, 12], [0.5, 0.7], 'ro')

# Autoscale the axes
ax.autoscale()

# Get updated view intervals after autoscaling
print("\nView intervals after autoscaling:")
print(f"X-axis: {ax.xaxis.get_view_interval()}")
print(f"Y-axis: {ax.yaxis.get_view_interval()}")

plt.show()
Output:
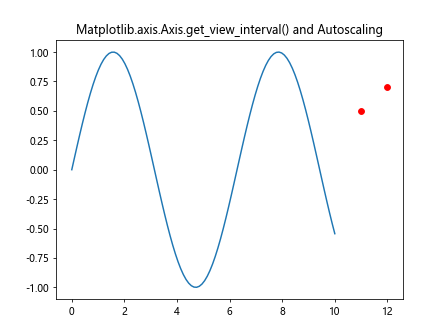
This example shows how the Matplotlib.axis.Axis.get_view_interval() function returns different values after autoscaling is applied to accommodate new data points.
Matplotlib.axis.Axis.get_view_interval() and Axis Padding
The Matplotlib.axis.Axis.get_view_interval() function can be used to observe the effects of axis padding. Here’s an example:
import matplotlib.pyplot as plt
import numpy as np

# Create a plot
fig, ax = plt.subplots()
x = np.linspace(0, 10, 100)
y = np.sin(x)

ax.plot(x, y, label='how2matplotlib.com')
ax.set_title('Matplotlib.axis.Axis.get_view_interval() and Axis Padding')

# Get initial view intervals
print("Initial view intervals:")
print(f"X-axis: {ax.xaxis.get_view_interval()}")
print(f"Y-axis: {ax.yaxis.get_view_interval()}")

# Add padding to the axes
ax.set_xmargin(0.1)
ax.set_ymargin(0.2)

# Get updated view intervals after adding padding
print("\nView intervals after adding padding:")
print(f"X-axis: {ax.xaxis.get_view_interval()}")
print(f"Y-axis: {ax.yaxis.get_view_interval()}")

plt.show()
Output:
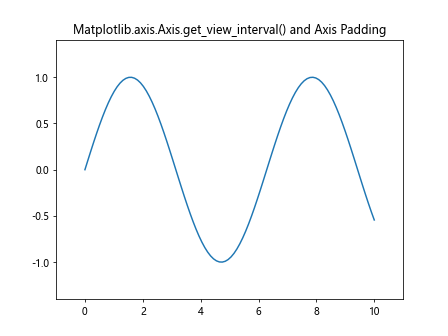
This example demonstrates how the Matplotlib.axis.Axis.get_view_interval() function reflects changes in the view interval when axis padding is applied using set_xmargin() and set_ymargin() methods.
Conclusion
The Matplotlib.axis.Axis.get_view_interval() function is a powerful tool for retrieving the current visible range of an axis in Matplotlib plots. Throughout this comprehensive guide, we’ve explored various aspects of this function, including its usage with different plot types, axis scales, subplots, and interactive features like zooming.
We’ve seen how the Matplotlib.axis.Axis.get_view_interval() function can be used to:
- Retrieve the visible range of both x and y axes
- Work with different plot types, including line plots, scatter plots, bar plots, and more
- Handle different axis scales, such as linear and logarithmic
- Operate on individual subplots
- Reflect changes in view intervals after zooming or panning
- Work with polar and 3D plots
- Handle custom tick locations and date axes
- Operate on shared and inverted axes
- Interact with axis limits and autoscaling features
- Reflect changes due to axis padding
By mastering the Matplotlib.axis.Axis.get_view_interval() function, you can gain better control over your plots and create more dynamic and interactive visualizations. This function is particularly useful when you need to programmatically access the current view of a plot, which can be essential for tasks such as data analysis, plot customization, and creating responsive visualizations.