How to Master Plotting Multiple Bar Charts Using Matplotlib in Python
Plotting multiple bar charts using Matplotlib in Python is an essential skill for data visualization. This comprehensive guide will walk you through various techniques and best practices for creating stunning and informative multiple bar charts with Matplotlib. Whether you’re a beginner or an experienced data scientist, this article will provide you with valuable insights and practical examples to enhance your data visualization skills.
Introduction to Plotting Multiple Bar Charts Using Matplotlib
Plotting multiple bar charts using Matplotlib in Python allows you to compare different categories or groups of data side by side. This powerful visualization technique is widely used in various fields, including data analysis, scientific research, and business reporting. Matplotlib, a popular plotting library in Python, provides a flexible and customizable framework for creating multiple bar charts.
Let’s start with a simple example of plotting multiple bar charts using Matplotlib:
import matplotlib.pyplot as plt
import numpy as np

categories = ['Category A', 'Category B', 'Category C']
values1 = [10, 15, 7]
values2 = [8, 12, 9]

x = np.arange(len(categories))
width = 0.35

fig, ax = plt.subplots(figsize=(10, 6))
rects1 = ax.bar(x - width/2, values1, width, label='Group 1')
rects2 = ax.bar(x + width/2, values2, width, label='Group 2')

ax.set_xlabel('Categories')
ax.set_ylabel('Values')
ax.set_title('Multiple Bar Chart Example - how2matplotlib.com')
ax.set_xticks(x)
ax.set_xticklabels(categories)
ax.legend()

plt.tight_layout()
plt.show()
Output:
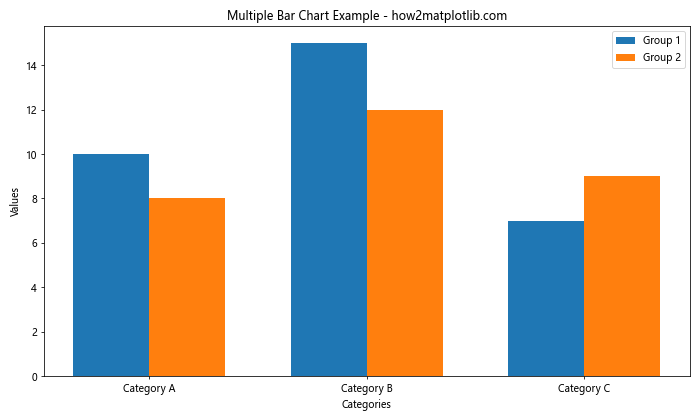
In this example, we create a simple multiple bar chart comparing two groups across three categories. The bar() function is used to plot the bars, and we adjust their positions using the width parameter to create side-by-side bars.
Understanding the Basics of Plotting Multiple Bar Charts
Before diving deeper into advanced techniques for plotting multiple bar charts using Matplotlib in Python, it’s essential to understand the fundamental concepts and components involved.
Bar Chart Components
When plotting multiple bar charts using Matplotlib, you’ll typically work with the following components:
- Figure: The overall container for the plot
- Axes: The area where the data is plotted
- Bars: The rectangular elements representing data values
- Labels: Text elements for axes, titles, and legends
- Ticks: Markers along the axes indicating data points
Let’s create a more detailed example to illustrate these components:
import matplotlib.pyplot as plt
import numpy as np

categories = ['Product A', 'Product B', 'Product C', 'Product D']
sales_2021 = [100, 150, 80, 120]
sales_2022 = [120, 180, 90, 140]

x = np.arange(len(categories))
width = 0.35

fig, ax = plt.subplots(figsize=(12, 7))
rects1 = ax.bar(x - width/2, sales_2021, width, label='2021 Sales')
rects2 = ax.bar(x + width/2, sales_2022, width, label='2022 Sales')

ax.set_xlabel('Products')
ax.set_ylabel('Sales (in thousands)')
ax.set_title('Product Sales Comparison 2021 vs 2022 - how2matplotlib.com')
ax.set_xticks(x)
ax.set_xticklabels(categories)
ax.legend()

ax.spines['top'].set_visible(False)
ax.spines['right'].set_visible(False)

for i, v in enumerate(sales_2021):
    ax.text(i - width/2, v + 3, str(v), ha='center', va='bottom')

for i, v in enumerate(sales_2022):
    ax.text(i + width/2, v + 3, str(v), ha='center', va='bottom')

plt.tight_layout()
plt.show()
Output:
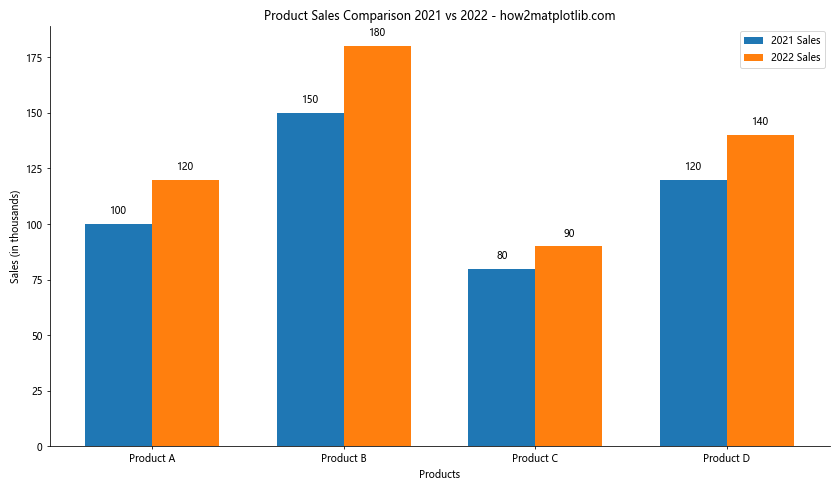
This example demonstrates a more sophisticated multiple bar chart comparing product sales for two years. We’ve added value labels on top of each bar and removed the top and right spines for a cleaner look.
Customizing Colors and Styles in Multiple Bar Charts
When plotting multiple bar charts using Matplotlib in Python, customizing colors and styles can greatly enhance the visual appeal and readability of your charts. Let’s explore various techniques to customize the appearance of your multiple bar charts.
Using Custom Colors
You can specify custom colors for each group of bars using the color parameter in the bar() function:
import matplotlib.pyplot as plt
import numpy as np

categories = ['Category X', 'Category Y', 'Category Z']
values1 = [15, 25, 20]
values2 = [10, 20, 15]
values3 = [12, 18, 22]

x = np.arange(len(categories))
width = 0.25

fig, ax = plt.subplots(figsize=(10, 6))
rects1 = ax.bar(x - width, values1, width, label='Group A', color='#FF9999')
rects2 = ax.bar(x, values2, width, label='Group B', color='#66B2FF')
rects3 = ax.bar(x + width, values3, width, label='Group C', color='#99FF99')

ax.set_xlabel('Categories')
ax.set_ylabel('Values')
ax.set_title('Custom Colored Multiple Bar Chart - how2matplotlib.com')
ax.set_xticks(x)
ax.set_xticklabels(categories)
ax.legend()

plt.tight_layout()
plt.show()
Output:
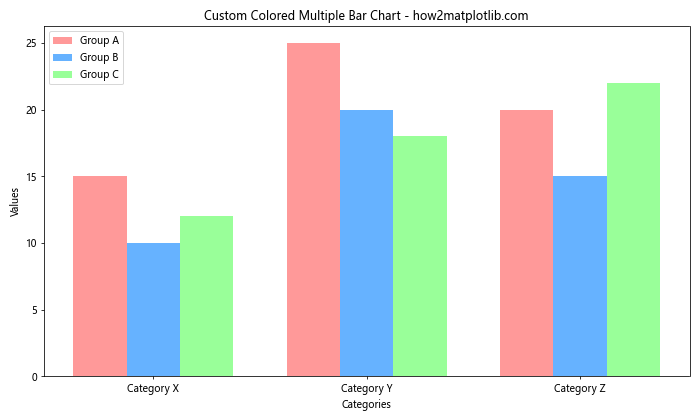
In this example, we use custom hex color codes to set different colors for each group of bars.
Applying Color Gradients
You can create a color gradient effect for your bars using the plt.cm module:
import matplotlib.pyplot as plt
import numpy as np

categories = ['Item 1', 'Item 2', 'Item 3', 'Item 4', 'Item 5']
values1 = [10, 15, 12, 18, 20]
values2 = [8, 12, 10, 15, 17]

x = np.arange(len(categories))
width = 0.35

fig, ax = plt.subplots(figsize=(12, 7))

cmap1 = plt.cm.get_cmap('Blues')
cmap2 = plt.cm.get_cmap('Oranges')

rects1 = ax.bar(x - width/2, values1, width, label='Series 1',
                color=cmap1(np.linspace(0.3, 0.8, len(categories))))
rects2 = ax.bar(x + width/2, values2, width, label='Series 2',
                color=cmap2(np.linspace(0.3, 0.8, len(categories))))

ax.set_xlabel('Categories')
ax.set_ylabel('Values')
ax.set_title('Color Gradient Multiple Bar Chart - how2matplotlib.com')
ax.set_xticks(x)
ax.set_xticklabels(categories)
ax.legend()

plt.tight_layout()
plt.show()
Output:
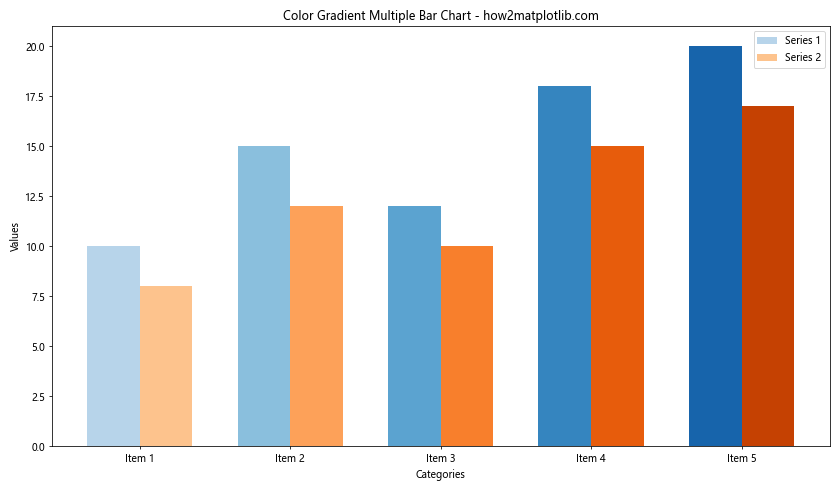
This example demonstrates how to apply color gradients to your bars using the ‘Blues’ and ‘Oranges’ colormaps.
Handling Large Datasets in Multiple Bar Charts
When plotting multiple bar charts using Matplotlib in Python with large datasets, you may face challenges in terms of readability and performance. Let’s explore some techniques to effectively handle large datasets in multiple bar charts.
Using Subplots for Multiple Bar Charts
For large datasets, it’s often beneficial to split the data into multiple subplots:
import matplotlib.pyplot as plt
import numpy as np

categories = [f'Category {i}' for i in range(1, 21)]
values1 = np.random.randint(50, 100, 20)
values2 = np.random.randint(40, 90, 20)

fig, (ax1, ax2) = plt.subplots(2, 1, figsize=(12, 10))

x = np.arange(10)
width = 0.35

ax1.bar(x - width/2, values1[:10], width, label='Group 1')
ax1.bar(x + width/2, values2[:10], width, label='Group 2')
ax1.set_xticks(x)
ax1.set_xticklabels(categories[:10], rotation=45, ha='right')
ax1.legend()
ax1.set_title('Categories 1-10 - how2matplotlib.com')

ax2.bar(x - width/2, values1[10:], width, label='Group 1')
ax2.bar(x + width/2, values2[10:], width, label='Group 2')
ax2.set_xticks(x)
ax2.set_xticklabels(categories[10:], rotation=45, ha='right')
ax2.legend()
ax2.set_title('Categories 11-20 - how2matplotlib.com')

plt.tight_layout()
plt.show()
Output:
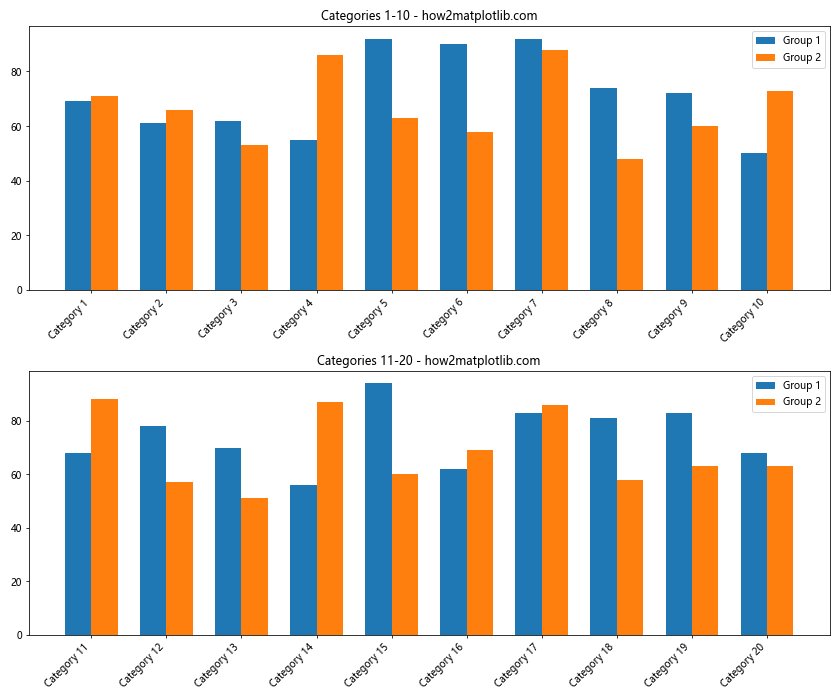
This example splits a large dataset into two subplots, making it easier to read and compare the data.
Creating Stacked Bar Charts for Multiple Groups
Another approach to handling large datasets is to use stacked bar charts:
import matplotlib.pyplot as plt
import numpy as np

categories = [f'Cat {i}' for i in range(1, 16)]
values1 = np.random.randint(10, 50, 15)
values2 = np.random.randint(10, 50, 15)
values3 = np.random.randint(10, 50, 15)

fig, ax = plt.subplots(figsize=(14, 7))

ax.bar(categories, values1, label='Group A')
ax.bar(categories, values2, bottom=values1, label='Group B')
ax.bar(categories, values3, bottom=values1+values2, label='Group C')

ax.set_xlabel('Categories')
ax.set_ylabel('Values')
ax.set_title('Stacked Bar Chart for Multiple Groups - how2matplotlib.com')
ax.legend(loc='upper left', bbox_to_anchor=(1, 1))

plt.xticks(rotation=45, ha='right')
plt.tight_layout()
plt.show()
Output:
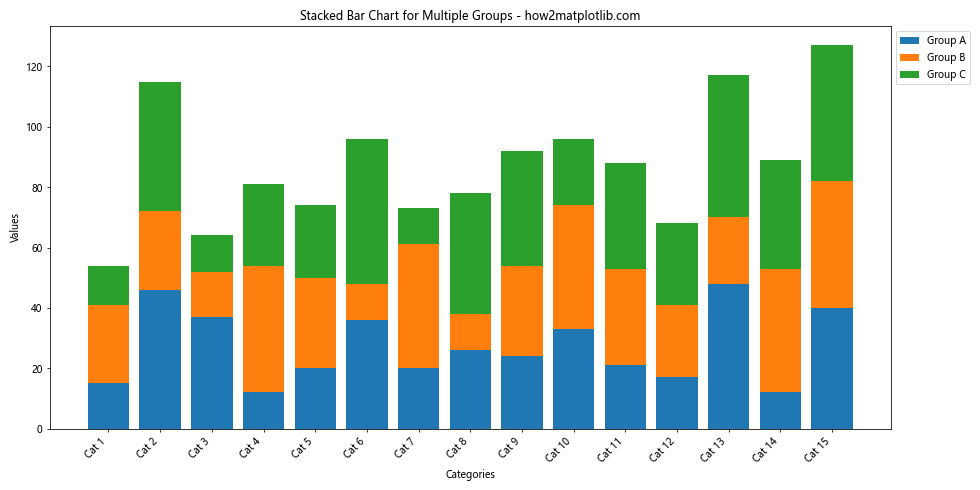
This example creates a stacked bar chart to represent multiple groups in a single bar for each category, which can be useful for comparing total values across categories.
Adding Data Labels and Annotations to Multiple Bar Charts
When plotting multiple bar charts using Matplotlib in Python, adding data labels and annotations can significantly improve the readability and informativeness of your visualizations. Let’s explore various techniques to add labels and annotations to your multiple bar charts.
Adding Value Labels to Bars
You can add value labels on top of each bar to display the exact values:
import matplotlib.pyplot as plt
import numpy as np

categories = ['A', 'B', 'C', 'D']
values1 = [15, 25, 20, 30]
values2 = [10, 20, 15, 25]

x = np.arange(len(categories))
width = 0.35

fig, ax = plt.subplots(figsize=(10, 6))
rects1 = ax.bar(x - width/2, values1, width, label='Group 1')
rects2 = ax.bar(x + width/2, values2, width, label='Group 2')

ax.set_ylabel('Values')
ax.set_title('Multiple Bar Chart with Value Labels - how2matplotlib.com')
ax.set_xticks(x)
ax.set_xticklabels(categories)
ax.legend()

def add_value_labels(ax, rects):
    for rect in rects:
        height = rect.get_height()
        ax.annotate(f'{height}',
                    xy=(rect.get_x() + rect.get_width() / 2, height),
                    xytext=(0, 3),  # 3 points vertical offset
                    textcoords="offset points",
                    ha='center', va='bottom')

add_value_labels(ax, rects1)
add_value_labels(ax, rects2)

plt.tight_layout()
plt.show()
Output:
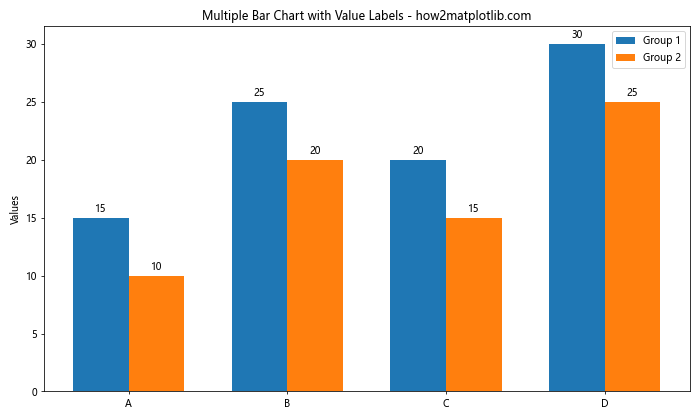
This example demonstrates how to add value labels on top of each bar using the annotate() function.
Adding Percentage Labels
You can also display percentage labels for each bar:
import matplotlib.pyplot as plt
import numpy as np

categories = ['Product X', 'Product Y', 'Product Z']
values1 = [30, 45, 25]
values2 = [35, 40, 30]

total1 = sum(values1)
total2 = sum(values2)

x = np.arange(len(categories))
width = 0.35

fig, ax = plt.subplots(figsize=(12, 7))
rects1 = ax.bar(x - width/2, values1, width, label='2021')
rects2 = ax.bar(x + width/2, values2, width, label='2022')

ax.set_ylabel('Sales')
ax.set_title('Product Sales Comparison with Percentage Labels - how2matplotlib.com')
ax.set_xticks(x)
ax.set_xticklabels(categories)
ax.legend()

def add_percentage_labels(ax, rects, total):
    for rect in rects:
        height = rect.get_height()
        percentage = f'{height/total*100:.1f}%'
        ax.annotate(percentage,
                    xy=(rect.get_x() + rect.get_width() / 2, height),
                    xytext=(0, 3),  # 3 points vertical offset
                    textcoords="offset points",
                    ha='center', va='bottom')

add_percentage_labels(ax, rects1, total1)
add_percentage_labels(ax, rects2, total2)

plt.tight_layout()
plt.show()
Output:
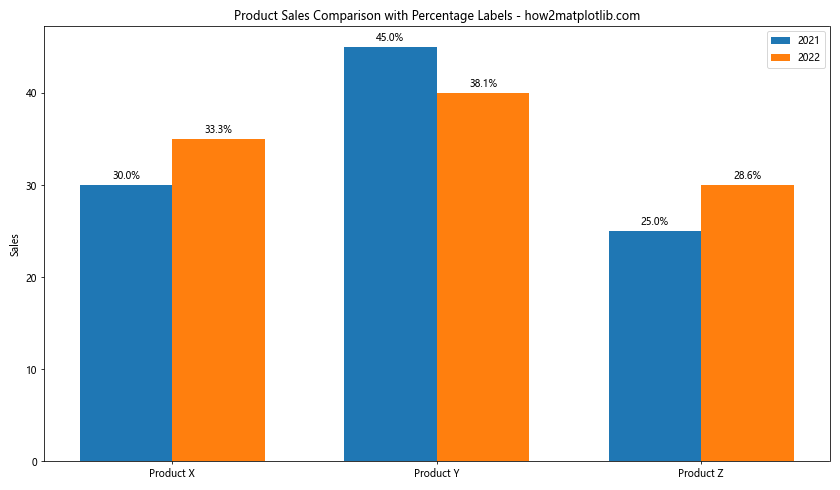
This example shows how to add percentage labels to each bar, calculated based on the total value for each group.
Customizing Axes and Grids in Multiple Bar Charts
When plotting multiple bar charts using Matplotlib in Python, customizing axes and grids can greatly enhance the visual appeal and readability of your charts. Let’s explore various techniques to customize axes and grids in your multiple bar charts.
Adjusting Axis Limits and Ticks
You can customize the axis limits and ticks to better fit your data:
import matplotlib.pyplot as plt
import numpy as np

categories = ['Category A', 'Category B', 'Category C', 'Category D']
values1 = [15, 25, 20, 30]
values2 = [10, 20, 15, 25]

x = np.arange(len(categories))
width = 0.35

fig, ax = plt.subplots(figsize=(10, 6))
rects1 = ax.bar(x - width/2, values1, width, label='Group 1')
rects2 = ax.bar(x + width/2, values2, width, label='Group 2')

ax.set_ylabel('Values')
ax.set_title('Multiple Bar Chart with Customized Axes - how2matplotlib.com')
ax.set_xticks(x)
ax.set_xticklabels(categories)
ax.legend()

ax.set_ylim(0, 40)  # Set y-axis limits
ax.set_yticks(np.arange(0, 41, 5))  # Set custom y-axis ticks

ax.spines['top'].set_visible(False)
ax.spines['right'].set_visible(False)

plt.tight_layout()
plt.show()
Output:
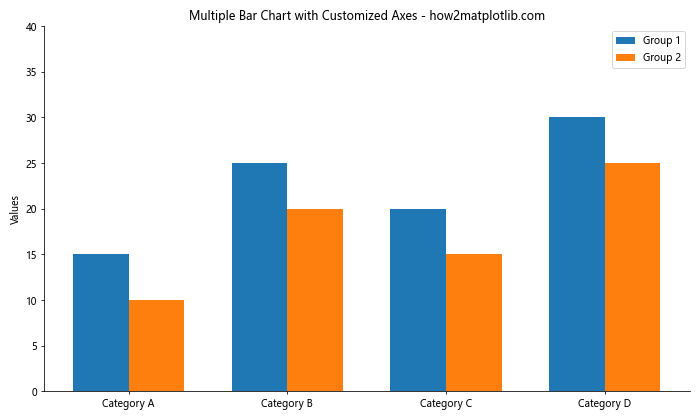
This example demonstrates how to set custom y-axis limits and ticks, as well as remove the top and right spines for a cleaner look.
Adding Grid Lines
Adding grid lines can help readers compare values more easily:
import matplotlib.pyplot as plt
import numpy as np

categories = ['Product A', 'Product B', 'Product C', 'Product D']
values1 = [100, 150, 80, 120]
values2 = [120, 180, 90, 140]

x = np.arange(len(categories))
width = 0.35

fig, ax = plt.subplots(figsize=(12, 7))
rects1 = ax.bar(x - width/2, values1, width, label='2021 Sales')
rects2 = ax.bar(x + width/2, values2, width, label='2022 Sales')

ax.set_xlabel('Products')
ax.set_ylabel('Sales (in thousands)')
ax.set_title('Product Sales Comparison with Grid Lines - how2matplotlib.com')
ax.set_xticks(x)
ax.set_xticklabels(categories)
ax.legend()

ax.grid(axis='y', linestyle='--', alpha=0.7)
ax.set_axisbelow(True)

plt.tight_layout()
plt.show()
Output:
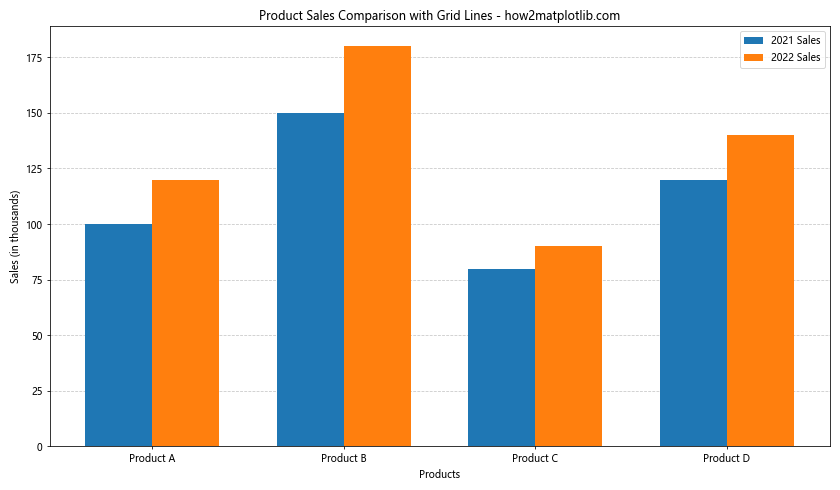
This example adds horizontal grid lines to the chart, making it easier to read the values for each bar.
Creating Grouped Bar Charts
Grouped bar charts are an effective way of plotting multiple bar charts using Matplotlib in Python when you want to compare multiple categories across different groups.
Basic Grouped Bar Chart
Let’s create a basic grouped bar chart:
import matplotlib.pyplot as plt
import numpy as np

categories = ['Category 1', 'Category 2', 'Category 3', 'Category 4']
group1 = [10, 15, 12, 18]
group2 = [12, 14, 16, 13]
group3 = [8, 11, 13, 15]

x = np.arange(len(categories))
width = 0.25

fig, ax = plt.subplots(figsize=(12, 7))
rects1 = ax.bar(x - width, group1, width, label='Group A')
rects2 = ax.bar(x, group2, width, label='Group B')
rects3 = ax.bar(x + width, group3, width, label='Group C')

ax.set_ylabel('Values')
ax.set_title('Grouped Bar Chart - how2matplotlib.com')
ax.set_xticks(x)
ax.set_xticklabels(categories)
ax.legend()

plt.tight_layout()
plt.show()
Output:
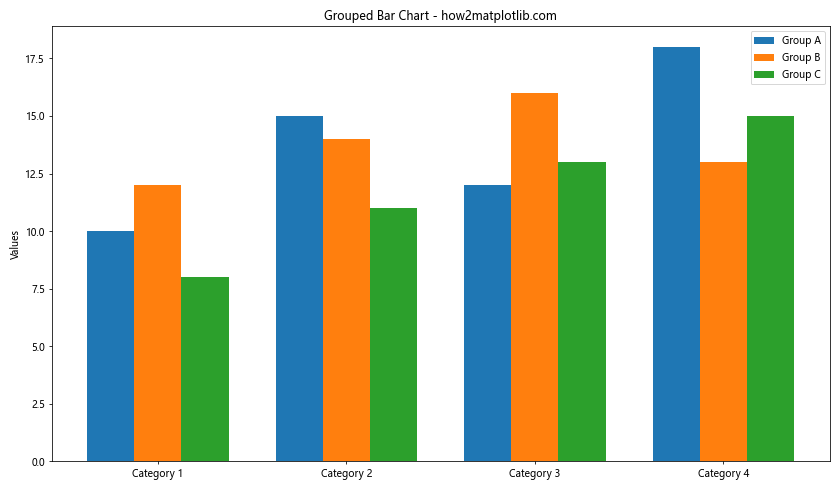
This example creates a grouped bar chart with three groups across four categories.
Customizing Grouped Bar Charts
You can further customize your grouped bar charts to make them more informative:
import matplotlib.pyplot as plt
import numpy as np

categories = ['Q1', 'Q2', 'Q3', 'Q4']
product1 = [100, 120, 110, 130]
product2 = [90, 110, 100, 120]
product3 = [80, 95, 105, 115]

x = np.arange(len(categories))
width = 0.25

fig, ax = plt.subplots(figsize=(12, 7))
rects1 = ax.bar(x - width, product1, width, label='Product X', color='#ff9999')
rects2 = ax.bar(x, product2, width, label='Product Y', color='#66b3ff')
rects3 = ax.bar(x + width, product3, width, label='Product Z', color='#99ff99')

ax.set_ylabel('Sales (in thousands)')
ax.set_title('Quarterly Sales by Product - how2matplotlib.com')
ax.set_xticks(x)
ax.set_xticklabels(categories)
ax.legend()

ax.spines['top'].set_visible(False)
ax.spines['right'].set_visible(False)
ax.grid(axis='y', linestyle='--', alpha=0.7)
ax.set_axisbelow(True)

def add_value_labels(ax, rects):
    for rect in rects:
        height = rect.get_height()
        ax.annotate(f'{height}k',
                    xy=(rect.get_x() + rect.get_width() / 2, height),
                    xytext=(0, 3),  # 3 points vertical offset
                    textcoords="offset points",
                    ha='center', va='bottom')

add_value_labels(ax, rects1)
add_value_labels(ax, rects2)
add_value_labels(ax, rects3)

plt.tight_layout()
plt.show()
Output:
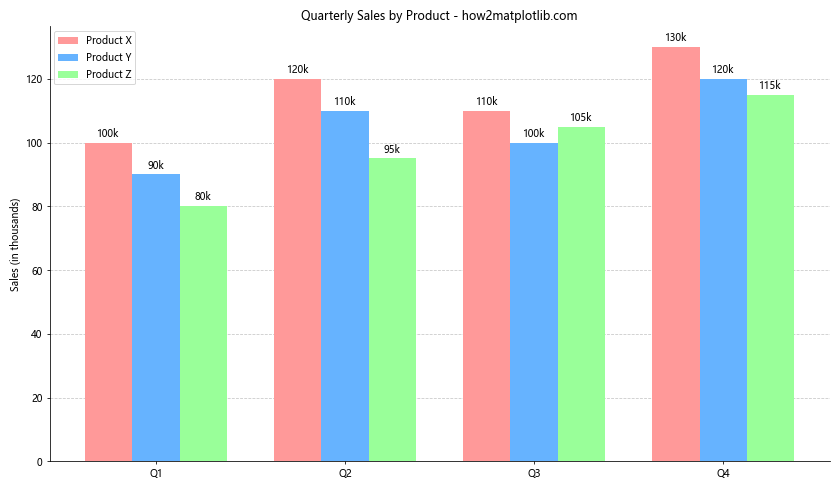
This example demonstrates a more customized grouped bar chart with custom colors, value labels, and grid lines.
Creating Stacked Bar Charts
Stacked bar charts are another effective way of plotting multiple bar charts using Matplotlib in Python, especially when you want to show the composition of each category.
Basic Stacked Bar Chart
Let’s create a basic stacked bar chart:
import matplotlib.pyplot as plt
import numpy as np

categories = ['Category A', 'Category B', 'Category C', 'Category D']
values1 = [10, 15, 12, 18]
values2 = [5, 8, 6, 9]
values3 = [3, 4, 5, 7]

fig, ax = plt.subplots(figsize=(10, 6))
ax.bar(categories, values1, label='Group 1')
ax.bar(categories, values2, bottom=values1, label='Group 2')
ax.bar(categories, values3, bottom=np.array(values1) + np.array(values2), label='Group 3')

ax.set_ylabel('Values')
ax.set_title('Stacked Bar Chart - how2matplotlib.com')
ax.legend()

plt.tight_layout()
plt.show()
Output:
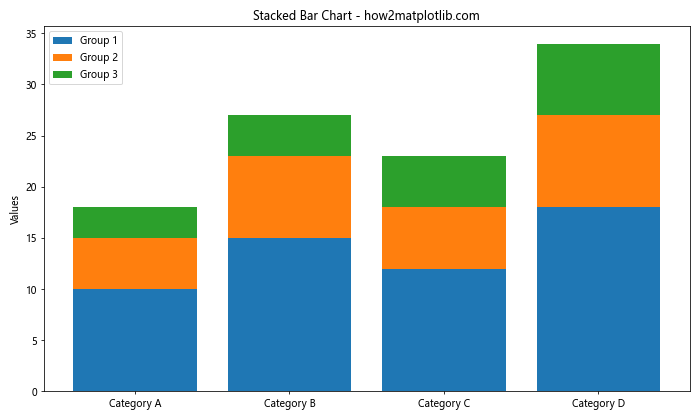
This example creates a stacked bar chart with three groups across four categories.
Handling Negative Values in Multiple Bar Charts
When plotting multiple bar charts using Matplotlib in Python, you may encounter situations where you need to handle negative values. Let’s explore how to effectively visualize negative values in multiple bar charts.
Bar Chart with Positive and Negative Values
Here’s an example of how to create a bar chart with both positive and negative values:
import matplotlib.pyplot as plt
import numpy as np

categories = ['A', 'B', 'C', 'D', 'E']
values1 = [10, -5, 7, -3, 8]
values2 = [-8, 6, -4, 5, -2]

x = np.arange(len(categories))
width = 0.35

fig, ax = plt.subplots(figsize=(12, 7))
rects1 = ax.bar(x - width/2, values1, width, label='Group 1')
rects2 = ax.bar(x + width/2, values2, width, label='Group 2')

ax.set_ylabel('Values')
ax.set_title('Bar Chart with Positive and Negative Values - how2matplotlib.com')
ax.set_xticks(x)
ax.set_xticklabels(categories)
ax.legend()

ax.spines['top'].set_visible(False)
ax.spines['right'].set_visible(False)
ax.axhline(y=0, color='k', linestyle='-', linewidth=0.5)

def add_value_labels(ax, rects):
    for rect in rects:
        height = rect.get_height()
        ax.annotate(f'{height}',
                    xy=(rect.get_x() + rect.get_width() / 2, height),
                    xytext=(0, 3 if height >= 0 else -3),
                    textcoords="offset points",
                    ha='center', va='bottom' if height >= 0 else 'top')

add_value_labels(ax, rects1)
add_value_labels(ax, rects2)

plt.tight_layout()
plt.show()
Output:
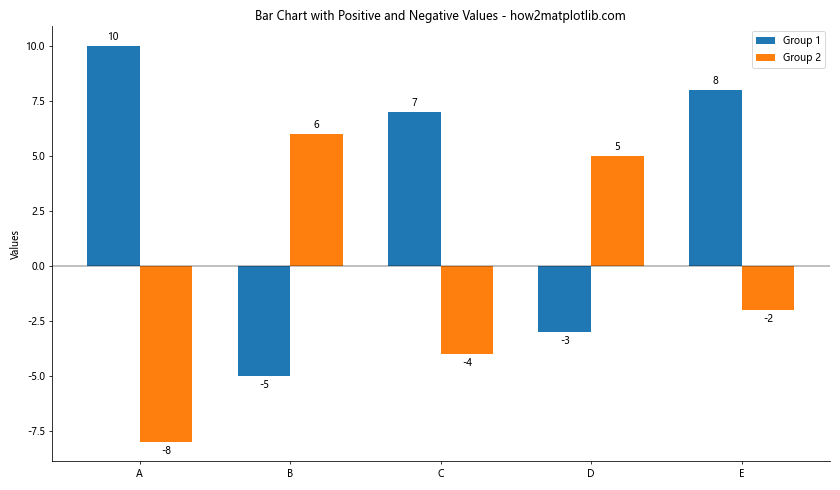
This example demonstrates how to create a bar chart with both positive and negative values, including a horizontal line at y=0 and value labels for each bar.
Creating Horizontal Bar Charts
Horizontal bar charts can be an effective alternative when plotting multiple bar charts using Matplotlib in Python, especially when dealing with long category names or many categories.
Basic Horizontal Bar Chart
Let’s create a basic horizontal bar chart:
import matplotlib.pyplot as plt
import numpy as np

categories = ['Category A', 'Category B', 'Category C', 'Category D', 'Category E']
values1 = [10, 15, 12, 18, 14]
values2 = [8, 12, 10, 15, 11]

y = np.arange(len(categories))
height = 0.35

fig, ax = plt.subplots(figsize=(10, 8))
rects1 = ax.barh(y - height/2, values1, height, label='Group 1')
rects2 = ax.barh(y + height/2, values2, height, label='Group 2')

ax.set_xlabel('Values')
ax.set_title('Horizontal Bar Chart - how2matplotlib.com')
ax.set_yticks(y)
ax.set_yticklabels(categories)
ax.legend()

ax.invert_yaxis()  # Labels read top-to-bottom
ax.set_axisbelow(True)
ax.grid(axis='x', linestyle='--', alpha=0.7)

plt.tight_layout()
plt.show()
Output:
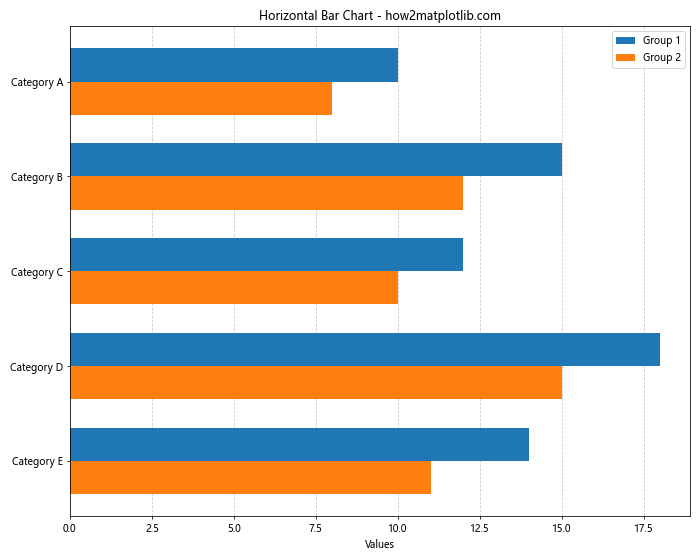
This example creates a horizontal bar chart with two groups across five categories.
Combining Multiple Bar Charts with Other Plot Types
When plotting multiple bar charts using Matplotlib in Python, you can enhance your visualizations by combining them with other plot types. This approach can provide additional insights and context to your data.
Combining Bar Charts with Line Plots
Here’s an example of how to combine a bar chart with a line plot:
import matplotlib.pyplot as plt
import numpy as np

categories = ['Jan', 'Feb', 'Mar', 'Apr', 'May']
sales = [100, 120, 110, 130, 150]
expenses = [80, 90, 85, 95, 100]
profit = [20, 30, 25, 35, 50]

x = np.arange(len(categories))
width = 0.35

fig, ax1 = plt.subplots(figsize=(12, 7))

ax1.bar(x - width/2, sales, width, label='Sales', color='#66b3ff')
ax1.bar(x + width/2, expenses, width, label='Expenses', color='#ff9999')
ax1.set_xlabel('Months')
ax1.set_ylabel('Amount')
ax1.set_title('Sales, Expenses, and Profit - how2matplotlib.com')
ax1.set_xticks(x)
ax1.set_xticklabels(categories)
ax1.legend(loc='upper left')

ax2 = ax1.twinx()
ax2.plot(x, profit, color='green', marker='o', linestyle='-', linewidth=2, markersize=8, label='Profit')
ax2.set_ylabel('Profit')
ax2.legend(loc='upper right')

plt.tight_layout()
plt.show()
Output:
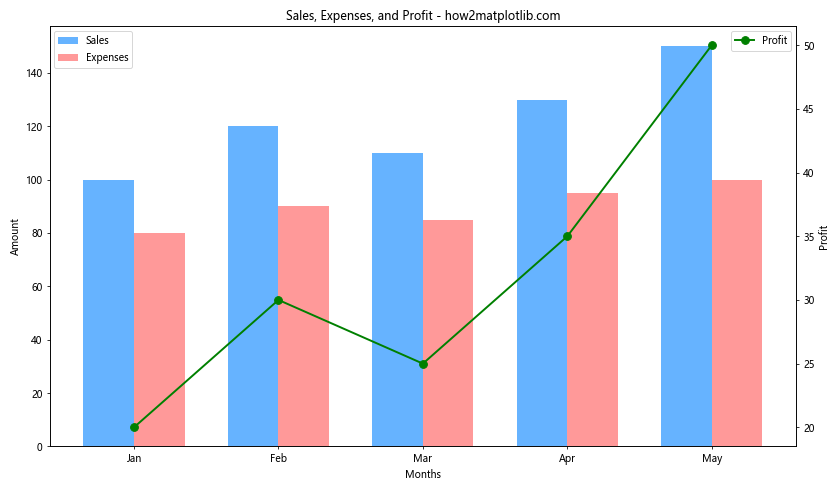
This example combines a bar chart showing sales and expenses with a line plot showing profit over time.
Animating Multiple Bar Charts
Animating multiple bar charts using Matplotlib in Python can create engaging and dynamic visualizations. Let’s explore how to create animated bar charts.
Creating a Simple Animated Bar Chart
Here’s an example of how to create a simple animated bar chart:
import matplotlib.pyplot as plt
import matplotlib.animation as animation
import numpy as np

categories = ['A', 'B', 'C', 'D', 'E']
data = np.random.rand(5, 10)  # 5 categories, 10 time steps

fig, ax = plt.subplots(figsize=(10, 6))

def animate(i):
    ax.clear()
    ax.bar(categories, data[:, i])
    ax.set_ylim(0, 1)
    ax.set_title(f'Animated Bar Chart - Frame {i+1} - how2matplotlib.com')

ani = animation.FuncAnimation(fig, animate, frames=10, interval=500, repeat=True)

plt.tight_layout()
plt.show()
Output:
This example creates a simple animated bar chart that updates the values for each category over time.
Best Practices for Plotting Multiple Bar Charts
When plotting multiple bar charts using Matplotlib in Python, it’s important to follow best practices to ensure your visualizations are clear, informative, and visually appealing. Here are some key best practices to keep in mind:
- Choose appropriate colors: Use colors that are distinct and easy to differentiate. Consider using color-blind friendly palettes.
Add clear labels and titles: Always include descriptive labels for axes, titles, and legends to provide context for your data.
Use consistent scales: When comparing multiple groups, ensure that the scales are consistent across all bars to avoid misrepresentation.
Avoid cluttering: Don’t overcrowd your charts with too many categories or groups. Consider using subplots or alternative chart types if you have too much data.
Include data labels when appropriate: Adding value labels to bars can make it easier for readers to understand exact values.
Use gridlines judiciously: Gridlines can help with readability, but use them sparingly to avoid visual clutter.
Consider orientation: Use vertical bars for fewer categories and horizontal bars for many categories or long category names.
Highlight important data: Use color or other visual cues to draw attention to the most important data points.
Provide context: Include relevant information such as data sources, time periods, or any assumptions made in the visualization.
Test for readability: Ensure your chart is easily readable at different sizes and on different devices.
Conclusion
Plotting multiple bar charts using Matplotlib in Python is a powerful way to visualize and compare data across different categoriesand groups. Throughout this comprehensive guide, we’ve explored various techniques and best practices for creating effective and visually appealing multiple bar charts.