How to Create Stunning Back-to-Back Bar Charts with Matplotlib
Plotting back-to-back bar charts Matplotlib is an essential skill for data visualization enthusiasts. This article will delve deep into the world of back-to-back bar charts using Matplotlib, providing you with a comprehensive understanding of this powerful visualization technique. We’ll explore various aspects of plotting back-to-back bar charts, from basic concepts to advanced customization options, all while using Matplotlib as our primary tool.
Understanding Back-to-Back Bar Charts
Before we dive into plotting back-to-back bar charts Matplotlib, let’s first understand what these charts are and why they’re useful. Back-to-back bar charts, also known as population pyramids or butterfly charts, are a type of visualization that displays two sets of data side by side, typically with one set facing left and the other facing right. This type of chart is particularly useful for comparing two related datasets, such as age distributions of males and females in a population, or sales figures for two different products across various categories.
When plotting back-to-back bar charts Matplotlib offers a range of options to create visually appealing and informative visualizations. These charts are especially effective when you want to highlight differences or similarities between two groups or categories.
Getting Started with Matplotlib
To begin plotting back-to-back bar charts Matplotlib needs to be installed in your Python environment. If you haven’t already installed Matplotlib, you can do so using pip:
pip install matplotlib
Once installed, you can import Matplotlib in your Python script:
import matplotlib.pyplot as plt
import numpy as np

# Your code for plotting back-to-back bar charts Matplotlib goes here
plt.figure(figsize=(10, 6))
plt.title('How to use Matplotlib - how2matplotlib.com')
plt.show()
Output:
This basic setup will be the foundation for all our examples of plotting back-to-back bar charts Matplotlib in this article.
Creating a Simple Back-to-Back Bar Chart
Let’s start with a simple example of plotting back-to-back bar charts Matplotlib. We’ll create a chart comparing the age distribution of males and females in a hypothetical population.
import matplotlib.pyplot as plt
import numpy as np

# Data for plotting back-to-back bar charts Matplotlib
age_groups = ['0-10', '11-20', '21-30', '31-40', '41-50', '51-60', '61+']
males = [10, 15, 25, 30, 22, 18, 12]
females = [12, 18, 28, 25, 20, 15, 10]

# Create the figure and axis objects
fig, ax = plt.subplots(figsize=(10, 6))

# Plot males on the left side
ax.barh(age_groups, [-m for m in males], align='center', color='skyblue', label='Males')

# Plot females on the right side
ax.barh(age_groups, females, align='center', color='pink', label='Females')

# Customize the plot
ax.set_xlabel('Population')
ax.set_ylabel('Age Group')
ax.set_title('Age Distribution - Males vs Females (how2matplotlib.com)')
ax.legend()

# Add labels to the bars
for i, v in enumerate(males):
    ax.text(-v - 1, i, str(v), ha='right', va='center')
for i, v in enumerate(females):
    ax.text(v + 1, i, str(v), ha='left', va='center')

# Remove top and right spines
ax.spines['top'].set_visible(False)
ax.spines['right'].set_visible(False)

# Show the plot
plt.tight_layout()
plt.show()
Output:
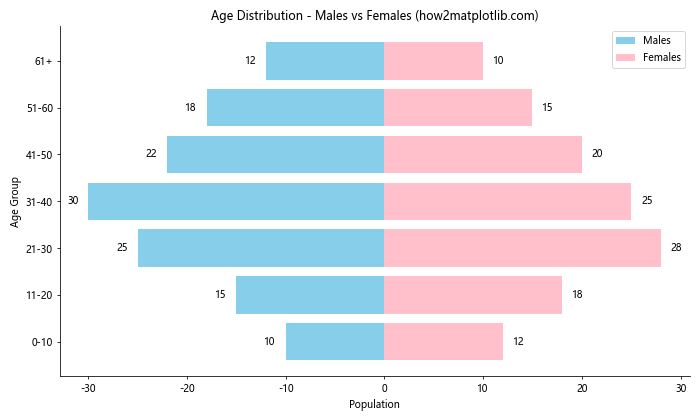
In this example of plotting back-to-back bar charts Matplotlib, we’ve created a simple population pyramid. The male population is represented by blue bars extending to the left, while the female population is represented by pink bars extending to the right. We’ve used the barh() function to create horizontal bars, and we’ve negated the male values to make them extend to the left.
Customizing Colors and Styles
When plotting back-to-back bar charts Matplotlib provides numerous options for customizing colors and styles. Let’s explore some of these options:
import matplotlib.pyplot as plt
import numpy as np

# Data for plotting back-to-back bar charts Matplotlib
categories = ['Category A', 'Category B', 'Category C', 'Category D', 'Category E']
product1 = [20, 35, 30, 35, 27]
product2 = [25, 32, 34, 20, 25]

# Create the figure and axis objects
fig, ax = plt.subplots(figsize=(12, 7))

# Plot product1 on the left side with custom color and hatch
ax.barh(categories, [-p for p in product1], align='center', color='#3498db', hatch='///', label='Product 1')

# Plot product2 on the right side with custom color and hatch
ax.barh(categories, product2, align='center', color='#e74c3c', hatch='...', label='Product 2')

# Customize the plot
ax.set_xlabel('Sales')
ax.set_ylabel('Categories')
ax.set_title('Sales Comparison - Product 1 vs Product 2 (how2matplotlib.com)', fontsize=16)
ax.legend(loc='lower right')

# Add labels to the bars
for i, v in enumerate(product1):
    ax.text(-v - 1, i, f'${v}k', ha='right', va='center', fontweight='bold')
for i, v in enumerate(product2):
    ax.text(v + 1, i, f'${v}k', ha='left', va='center', fontweight='bold')

# Customize the axis
ax.set_xlim(-max(product1) - 5, max(product2) + 5)
ax.axvline(0, color='black', linewidth=0.5)

# Remove top and right spines
ax.spines['top'].set_visible(False)
ax.spines['right'].set_visible(False)

# Add a grid
ax.grid(axis='x', linestyle='--', alpha=0.7)

# Show the plot
plt.tight_layout()
plt.show()
Output:
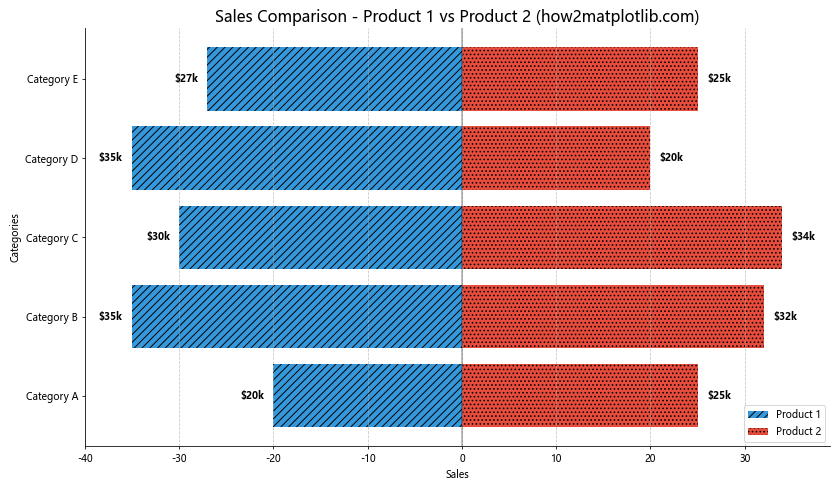
In this example of plotting back-to-back bar charts Matplotlib, we’ve added custom colors using hex codes, hatching patterns to the bars, and improved the overall styling of the chart. We’ve also added dollar signs to the labels to make the sales figures more clear.
Adding Error Bars
When plotting back-to-back bar charts Matplotlib allows you to add error bars to represent uncertainty or variability in your data. Here’s an example:
import matplotlib.pyplot as plt
import numpy as np

# Data for plotting back-to-back bar charts Matplotlib
categories = ['A', 'B', 'C', 'D', 'E']
group1 = [15, 30, 45, 22, 38]
group2 = [18, 25, 40, 20, 35]
error1 = [2, 3, 4, 2, 3]
error2 = [1, 2, 3, 2, 2]

# Create the figure and axis objects
fig, ax = plt.subplots(figsize=(10, 6))

# Plot group1 on the left side with error bars
ax.barh(categories, [-g for g in group1], align='center', color='#3498db',
        xerr=error1, error_kw={'ecolor': '0.2', 'capsize': 5}, label='Group 1')

# Plot group2 on the right side with error bars
ax.barh(categories, group2, align='center', color='#e74c3c',
        xerr=error2, error_kw={'ecolor': '0.2', 'capsize': 5}, label='Group 2')

# Customize the plot
ax.set_xlabel('Value')
ax.set_ylabel('Categories')
ax.set_title('Comparison with Error Bars (how2matplotlib.com)', fontsize=16)
ax.legend(loc='lower right')

# Add labels to the bars
for i, (v1, v2) in enumerate(zip(group1, group2)):
    ax.text(-v1 - 2, i, f'{v1}±{error1[i]}', ha='right', va='center')
    ax.text(v2 + 2, i, f'{v2}±{error2[i]}', ha='left', va='center')

# Customize the axis
ax.set_xlim(-max(group1) - 10, max(group2) + 10)
ax.axvline(0, color='black', linewidth=0.5)

# Remove top and right spines
ax.spines['top'].set_visible(False)
ax.spines['right'].set_visible(False)

# Show the plot
plt.tight_layout()
plt.show()
Output:
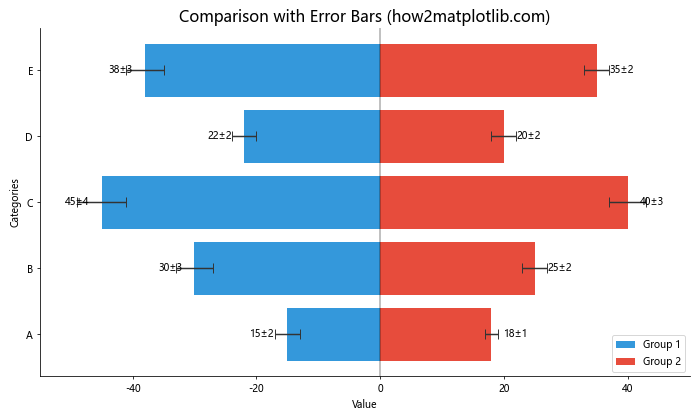
This example demonstrates how to add error bars when plotting back-to-back bar charts Matplotlib. Error bars are useful for showing the range of possible values or the uncertainty in measurements.
Creating Stacked Back-to-Back Bar Charts
Plotting back-to-back bar charts Matplotlib can be extended to include stacked bars, allowing for even more complex comparisons. Here’s an example:
import matplotlib.pyplot as plt
import numpy as np

# Data for plotting back-to-back bar charts Matplotlib
categories = ['Category 1', 'Category 2', 'Category 3', 'Category 4']
left_data = {
    'Subgroup A': [10, 20, 15, 25],
    'Subgroup B': [15, 10, 20, 15],
    'Subgroup C': [5, 15, 10, 20]
}
right_data = {
    'Subgroup X': [12, 18, 22, 15],
    'Subgroup Y': [18, 15, 18, 20],
    'Subgroup Z': [10, 12, 8, 15]
}

# Create the figure and axis objects
fig, ax = plt.subplots(figsize=(12, 7))

# Plot left stacked bars
left_bottom = np.zeros(len(categories))
for subgroup, values in left_data.items():
    ax.barh(categories, [-v for v in values], left=-left_bottom, align='center',
            label=f'Left {subgroup}')
    left_bottom += values

# Plot right stacked bars
right_bottom = np.zeros(len(categories))
for subgroup, values in right_data.items():
    ax.barh(categories, values, left=right_bottom, align='center',
            label=f'Right {subgroup}')
    right_bottom += values

# Customize the plot
ax.set_xlabel('Value')
ax.set_ylabel('Categories')
ax.set_title('Stacked Back-to-Back Bar Chart (how2matplotlib.com)', fontsize=16)
ax.legend(loc='center left', bbox_to_anchor=(1, 0.5))

# Add a vertical line at x=0
ax.axvline(0, color='black', linewidth=0.5)

# Remove top and right spines
ax.spines['top'].set_visible(False)
ax.spines['right'].set_visible(False)

# Show the plot
plt.tight_layout()
plt.show()
Output:
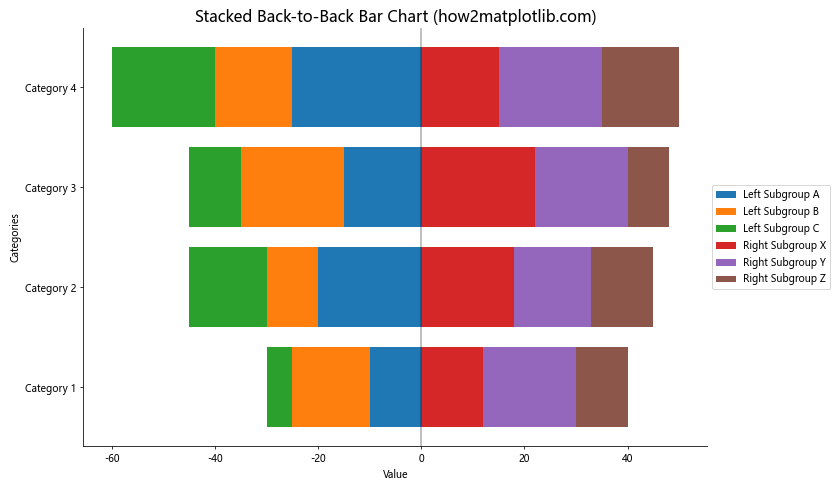
This example showcases a more complex scenario of plotting back-to-back bar charts Matplotlib, where each side of the chart contains stacked bars representing different subgroups.
Adding Data Labels to Stacked Bars
To make our stacked back-to-back bar charts more informative, we can add data labels to each segment. Here’s how to do that when plotting back-to-back bar charts Matplotlib:
import matplotlib.pyplot as plt
import numpy as np

# Data for plotting back-to-back bar charts Matplotlib
categories = ['Cat A', 'Cat B', 'Cat C', 'Cat D']
left_data = {
    'Group 1': [10, 20, 15, 25],
    'Group 2': [15, 10, 20, 15],
    'Group 3': [5, 15, 10, 20]
}
right_data = {
    'Group X': [12, 18, 22, 15],
    'Group Y': [18, 15, 18, 20],
    'Group Z': [10, 12, 8, 15]
}

# Create the figure and axis objects
fig, ax = plt.subplots(figsize=(14, 8))

# Function to add labels to bars
def add_labels(bars, labels, offset):
    for bar, label in zip(bars, labels):
        width = bar.get_width()
        ax.text(bar.get_x() + width/2 + offset, bar.get_y() + bar.get_height()/2,
                str(label), ha='center', va='center')

# Plot left stacked bars
left_bottom = np.zeros(len(categories))
for group, values in left_data.items():
    bars = ax.barh(categories, [-v for v in values], left=-left_bottom, align='center',
                   label=f'Left {group}')
    add_labels(bars, values, -0.1)
    left_bottom += values

# Plot right stacked bars
right_bottom = np.zeros(len(categories))
for group, values in right_data.items():
    bars = ax.barh(categories, values, left=right_bottom, align='center',
                   label=f'Right {group}')
    add_labels(bars, values, 0.1)
    right_bottom += values

# Customize the plot
ax.set_xlabel('Value')
ax.set_ylabel('Categories')
ax.set_title('Labeled Stacked Back-to-Back Bar Chart (how2matplotlib.com)', fontsize=16)
ax.legend(loc='center left', bbox_to_anchor=(1, 0.5))

# Add a vertical line at x=0
ax.axvline(0, color='black', linewidth=0.5)

# Remove top and right spines
ax.spines['top'].set_visible(False)
ax.spines['right'].set_visible(False)

# Show the plot
plt.tight_layout()
plt.show()
Output:
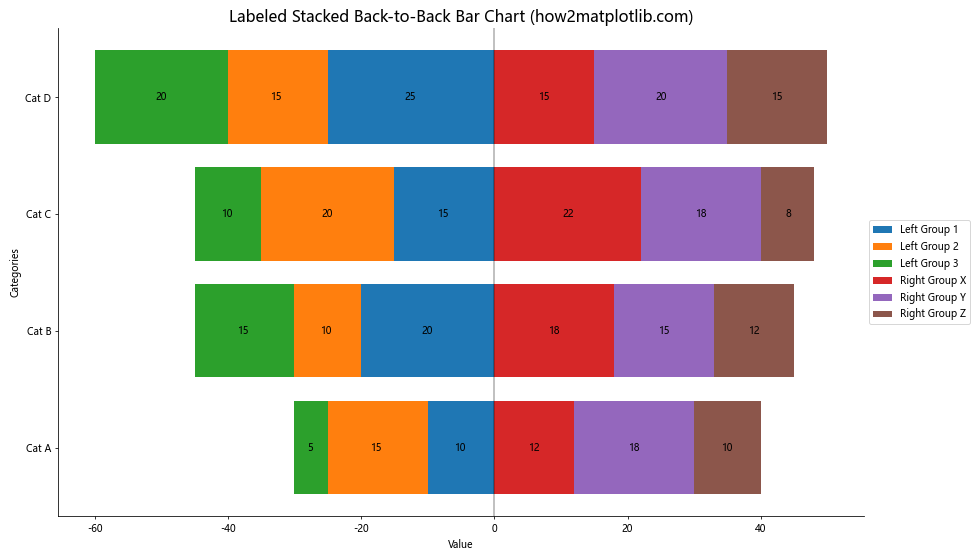
This example enhances our previous stacked bar chart by adding labels to each segment, making it easier to read the exact values when plotting back-to-back bar charts Matplotlib.
Creating Grouped Back-to-Back Bar Charts
Another variation when plotting back-to-back bar charts Matplotlib is to create grouped bars instead of stacked bars. This can be useful when you want to compare multiple groups side by side. Here’s an example:
import matplotlib.pyplot as plt
import numpy as np

# Data for plotting back-to-back bar charts Matplotlib
categories = ['Category A', 'Category B', 'Category C', 'Category D']
left_data = {
    'Group 1': [10, 20, 15, 25],
    'Group 2': [15, 10, 20, 15],
    'Group 3': [5, 15, 10, 20]
}
right_data = {
    'Group X': [12, 18, 22, 15],
    'Group Y': [18, 15, 18, 20],
    'Group Z': [10, 12, 8, 15]
}

# Create the figure and axis objects
fig, ax = plt.subplots(figsize=(14, 8))

# Set the width of each bar and the padding between groups
bar_width = 0.15
padding = 0.1

# Calculate positions for each group of bars
num_left_groups = len(left_data)
num_right_groups = len(right_data)
indices = np.arange(len(categories))
left_positions = indices - (bar_width * num_left_groups + padding) / 2
right_positions = indices + (bar_width * num_right_groups + padding) / 2

# Plot# Plot left grouped bars
for i, (group, values) in enumerate(left_data.items()):
    ax.barh(left_positions + i * bar_width, [-v for v in values], bar_width,
            align='center', label=f'Left {group}')

# Plot right grouped bars
for i, (group, values) in enumerate(right_data.items()):
    ax.barh(right_positions + i * bar_width, values, bar_width,
            align='center', label=f'Right {group}')

# Customize the plot
ax.set_yticks(indices)
ax.set_yticklabels(categories)
ax.set_xlabel('Value')
ax.set_ylabel('Categories')
ax.set_title('Grouped Back-to-Back Bar Chart (how2matplotlib.com)', fontsize=16)
ax.legend(loc='center left', bbox_to_anchor=(1, 0.5))

# Add a vertical line at x=0
ax.axvline(0, color='black', linewidth=0.5)

# Remove top and right spines
ax.spines['top'].set_visible(False)
ax.spines['right'].set_visible(False)

# Show the plot
plt.tight_layout()
plt.show()
Output:
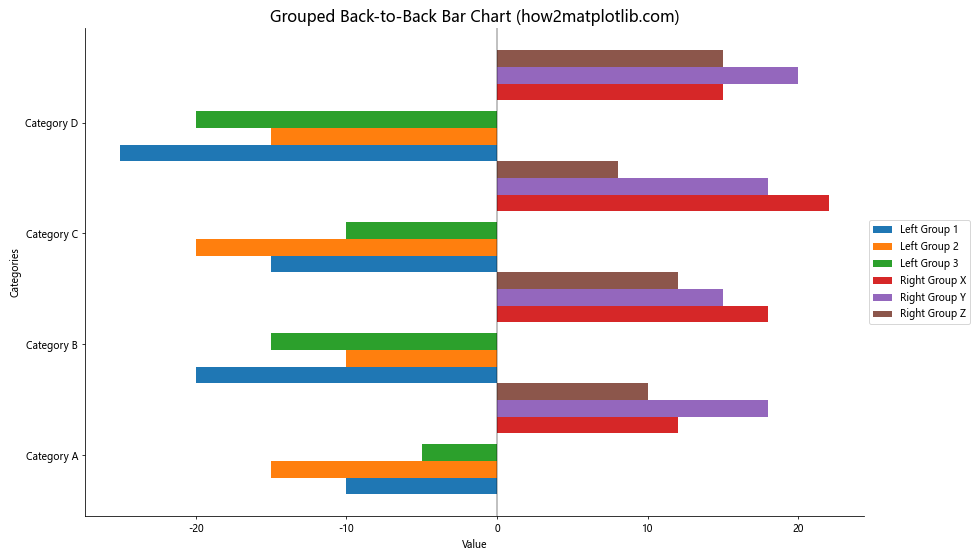
This example demonstrates how to create grouped back-to-back bar charts when plotting back-to-back bar charts Matplotlib. Each category now has multiple bars on each side, allowing for more detailed comparisons between groups.
Adding a Color Gradient to Back-to-Back Bar Charts
To make your visualization even more appealing when plotting back-to-back bar charts Matplotlib, you can add a color gradient to the bars. This can help emphasize differences or trends in your data. Here’s an example:
import matplotlib.pyplot as plt
import numpy as np
from matplotlib.colors import LinearSegmentedColormap

# Data for plotting back-to-back bar charts Matplotlib
categories = ['A', 'B', 'C', 'D', 'E', 'F', 'G', 'H', 'I', 'J']
left_values = [10, 20, 15, 25, 30, 35, 27, 22, 18, 12]
right_values = [12, 18, 22, 28, 25, 30, 24, 20, 15, 10]

# Create the figure and axis objects
fig, ax = plt.subplots(figsize=(12, 8))

# Create custom color maps
left_cmap = LinearSegmentedColormap.from_list("", ["#3498db", "#8e44ad"])
right_cmap = LinearSegmentedColormap.from_list("", ["#e74c3c", "#f39c12"])

# Plot left bars with color gradient
left_colors = left_cmap(np.linspace(0, 1, len(categories)))
ax.barh(categories, [-v for v in left_values], align='center', color=left_colors, label='Left Group')

# Plot right bars with color gradient
right_colors = right_cmap(np.linspace(0, 1, len(categories)))
ax.barh(categories, right_values, align='center', color=right_colors, label='Right Group')

# Customize the plot
ax.set_xlabel('Value')
ax.set_ylabel('Categories')
ax.set_title('Back-to-Back Bar Chart with Color Gradient (how2matplotlib.com)', fontsize=16)
ax.legend(loc='lower right')

# Add labels to the bars
for i, (v1, v2) in enumerate(zip(left_values, right_values)):
    ax.text(-v1 - 1, i, str(v1), ha='right', va='center', fontweight='bold')
    ax.text(v2 + 1, i, str(v2), ha='left', va='center', fontweight='bold')

# Customize the axis
ax.set_xlim(-max(left_values) - 5, max(right_values) + 5)
ax.axvline(0, color='black', linewidth=0.5)

# Remove top and right spines
ax.spines['top'].set_visible(False)
ax.spines['right'].set_visible(False)

# Show the plot
plt.tight_layout()
plt.show()
Output:
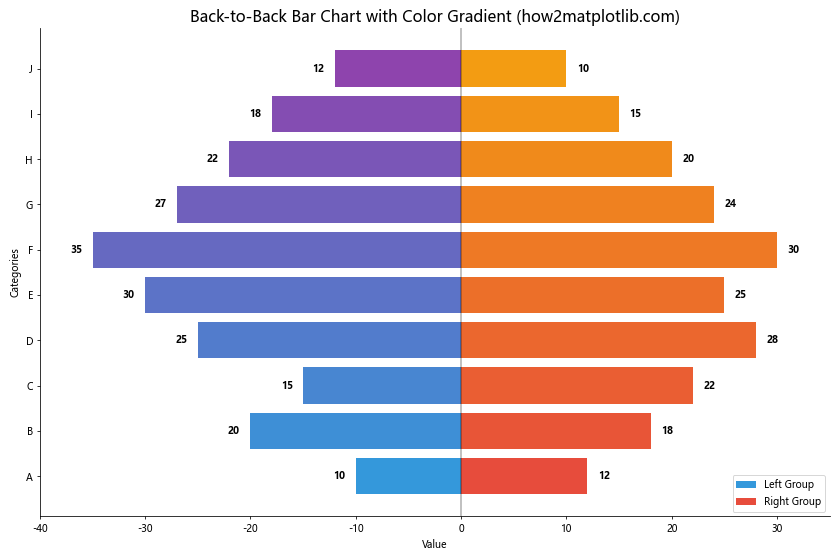
This example shows how to use color gradients when plotting back-to-back bar charts Matplotlib, creating a visually striking chart that helps highlight trends or patterns in your data.
Creating Animated Back-to-Back Bar Charts
For a more dynamic presentation when plotting back-to-back bar charts Matplotlib, you can create animated charts. This is particularly useful for showing changes over time or for presenting multiple datasets in a sequence. Here’s an example of how to create a simple animated back-to-back bar chart:
import matplotlib.pyplot as plt
import matplotlib.animation as animation
import numpy as np

# Data for plotting back-to-back bar charts Matplotlib
categories = ['A', 'B', 'C', 'D', 'E']
left_data = [
    [10, 15, 12, 8, 20],
    [12, 18, 15, 10, 22],
    [15, 20, 18, 12, 25],
    [18, 22, 20, 15, 28],
    [20, 25, 22, 18, 30]
]
right_data = [
    [8, 12, 15, 10, 18],
    [10, 15, 18, 12, 20],
    [12, 18, 20, 15, 22],
    [15, 20, 22, 18, 25],
    [18, 22, 25, 20, 28]
]

# Create the figure and axis objects
fig, ax = plt.subplots(figsize=(12, 8))

def animate(frame):
    ax.clear()

    # Plot left bars
    ax.barh(categories, [-v for v in left_data[frame]], align='center', color='#3498db', label='Left Group')

    # Plot right bars
    ax.barh(categories, right_data[frame], align='center', color='#e74c3c', label='Right Group')

    # Customize the plot
    ax.set_xlabel('Value')
    ax.set_ylabel('Categories')
    ax.set_title(f'Animated Back-to-Back Bar Chart - Frame {frame+1} (how2matplotlib.com)', fontsize=16)
    ax.legend(loc='lower right')

    # Add labels to the bars
    for i, (v1, v2) in enumerate(zip(left_data[frame], right_data[frame])):
        ax.text(-v1 - 1, i, str(v1), ha='right', va='center', fontweight='bold')
        ax.text(v2 + 1, i, str(v2), ha='left', va='center', fontweight='bold')

    # Customize the axis
    ax.set_xlim(-max(max(left_data)) - 5, max(max(right_data)) + 5)
    ax.axvline(0, color='black', linewidth=0.5)

    # Remove top and right spines
    ax.spines['top'].set_visible(False)
    ax.spines['right'].set_visible(False)

# Create the animation
anim = animation.FuncAnimation(fig, animate, frames=len(left_data), interval=1000, repeat=True)

plt.tight_layout()
plt.show()
Output:
This example demonstrates how to create an animated back-to-back bar chart when plotting back-to-back bar charts Matplotlib. The animation cycles through different datasets, showing how the values change over time or across different scenarios.
Customizing Tick Labels and Gridlines
When plotting back-to-back bar charts Matplotlib, you can enhance the readability of your chart by customizing tick labels and adding gridlines. Here’s an example that demonstrates these customizations:
import matplotlib.pyplot as plt
import numpy as np

# Data for plotting back-to-back bar charts Matplotlib
categories = ['Category A', 'Category B', 'Category C', 'Category D', 'Category E']
left_values = [15, 25, 20, 30, 18]
right_values = [18, 22, 25, 28, 20]

# Create the figure and axis objects
fig, ax = plt.subplots(figsize=(12, 8))

# Plot left bars
ax.barh(categories, [-v for v in left_values], align='center', color='#3498db', label='Left Group')

# Plot right bars
ax.barh(categories, right_values, align='center', color='#e74c3c', label='Right Group')

# Customize the plot
ax.set_xlabel('Value', fontsize=12)
ax.set_ylabel('Categories', fontsize=12)
ax.set_title('Back-to-Back Bar Chart with Custom Ticks and Grid (how2matplotlib.com)', fontsize=16)
ax.legend(loc='lower right', fontsize=10)

# Add labels to the bars
for i, (v1, v2) in enumerate(zip(left_values, right_values)):
    ax.text(-v1 - 1, i, str(v1), ha='right', va='center', fontweight='bold')
    ax.text(v2 + 1, i, str(v2), ha='left', va='center', fontweight='bold')

# Customize the axis
ax.set_xlim(-max(left_values) - 5, max(right_values) + 5)
ax.axvline(0, color='black', linewidth=0.5)

# Customize tick labels
ax.tick_params(axis='both', which='major', labelsize=10)
ax.set_xticks(np.arange(-30, 35, 10))
ax.set_xticklabels([str(abs(x)) for x in ax.get_xticks()])

# Add gridlines
ax.grid(axis='x', linestyle='--', alpha=0.7)

# Remove top and right spines
ax.spines['top'].set_visible(False)
ax.spines['right'].set_visible(False)

# Show the plot
plt.tight_layout()
plt.show()
Output:
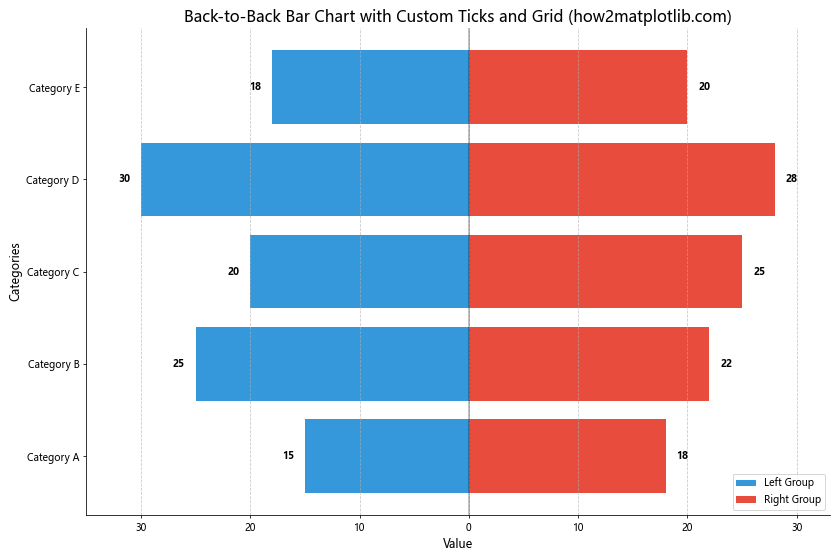
This example shows how to customize tick labels and add gridlines when plotting back-to-back bar charts Matplotlib. The x-axis now shows absolute values, making it easier to compare the lengths of bars on both sides.
Creating a Horizontal Back-to-Back Bar Chart with Percentage Values
When plotting back-to-back bar charts Matplotlib, you might want to display percentage values instead of absolute numbers. Here’s an example of how to create a horizontal back-to-back bar chart with percentage values:
import matplotlib.pyplot as plt
import numpy as np

# Data for plotting back-to-back bar charts Matplotlib
categories = ['Category A', 'Category B', 'Category C', 'Category D', 'Category E']
left_percentages = [30, 25, 20, 15, 10]
right_percentages = [28, 22, 18, 17, 15]

# Create the figure and axis objects
fig, ax = plt.subplots(figsize=(12, 8))

# Plot left bars
ax.barh(categories, [-p for p in left_percentages], align='center', color='#3498db', label='Left Group')

# Plot right bars
ax.barh(categories, right_percentages, align='center', color='#e74c3c', label='Right Group')

# Customize the plot
ax.set_xlabel('Percentage', fontsize=12)
ax.set_ylabel('Categories', fontsize=12)
ax.set_title('Back-to-Back Bar Chart with Percentages (how2matplotlib.com)', fontsize=16)
ax.legend(loc='lower right', fontsize=10)

# Add percentage labels to the bars
for i, (p1, p2) in enumerate(zip(left_percentages, right_percentages)):
    ax.text(-p1 - 1, i, f'{p1}%', ha='right', va='center', fontweight='bold')
    ax.text(p2 + 1, i, f'{p2}%', ha='left', va='center', fontweight='bold')

# Customize the axis
ax.set_xlim(-max(left_percentages) - 5, max(right_percentages) + 5)
ax.axvline(0, color='black', linewidth=0.5)

# Customize tick labels
ax.tick_params(axis='both', which='major', labelsize=10)
ax.set_xticks(np.arange(-30, 35, 10))
ax.set_xticklabels([f'{abs(x)}%' for x in ax.get_xticks()])

# Add gridlines
ax.grid(axis='x', linestyle='--', alpha=0.7)

# Remove top and right spines
ax.spines['top'].set_visible(False)
ax.spines['right'].set_visible(False)

# Show the plot
plt.tight_layout()
plt.show()
Output:
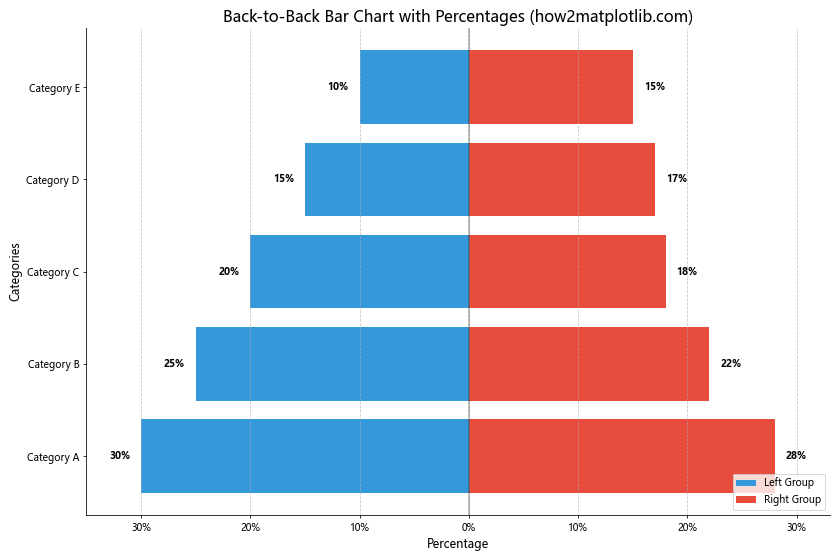
This example demonstrates how to create a back-to-back bar chart with percentage values when plotting back-to-back bar charts Matplotlib. The x-axis and bar labels now show percentages, making it easy to compare relative proportions between the two groups.
Creating a Vertical Back-to-Back Bar Chart
While horizontal back-to-back bar charts are more common, you can also create vertical back-to-back bar charts when plotting back-to-back bar charts Matplotlib. Here’s an example:
import matplotlib.pyplot as plt
import numpy as np

# Data for plotting back-to-back bar charts Matplotlib
categories = ['A', 'B', 'C', 'D', 'E']
top_values = [15, 25, 20, 30, 18]
bottom_values = [18, 22, 25, 28, 20]

# Create the figure and axis objects
fig, ax = plt.subplots(figsize=(10, 12))

# Set the width of each bar
bar_width = 0.35

# Set the positions of the bars on the x-axis
r1 = np.arange(len(categories))
r2 = [x + bar_width for x in r1]

# Plot top bars
ax.bar(r1, top_values, color='#3498db', width=bar_width, label='Top Group')

# Plot bottom bars (negative values to make them go down)
ax.bar(r2, [-v for v in bottom_values], color='#e74c3c', width=bar_width, label='Bottom Group')

# Customize the plot
ax.set_ylabel('Value', fontsize=12)
ax.set_title('Vertical Back-to-Back Bar Chart (how2matplotlib.com)', fontsize=16)
ax.set_xticks([r + bar_width/2 for r in range(len(categories))])
ax.set_xticklabels(categories)
ax.legend()

# Add value labels to the bars
for i, v in enumerate(top_values):
    ax.text(i, v + 0.5, str(v), ha='center', va='bottom')
for i, v in enumerate(bottom_values):
    ax.text(i + bar_width, -v - 0.5, str(v), ha='center', va='top')

# Customize the axis
ax.set_ylim(-max(bottom_values) - 5, max(top_values) + 5)
ax.axhline(0, color='black', linewidth=0.5)

# Remove top and right spines
ax.spines['top'].set_visible(False)
ax.spines['right'].set_visible(False)

# Show the plot
plt.tight_layout()
plt.show()
Output:
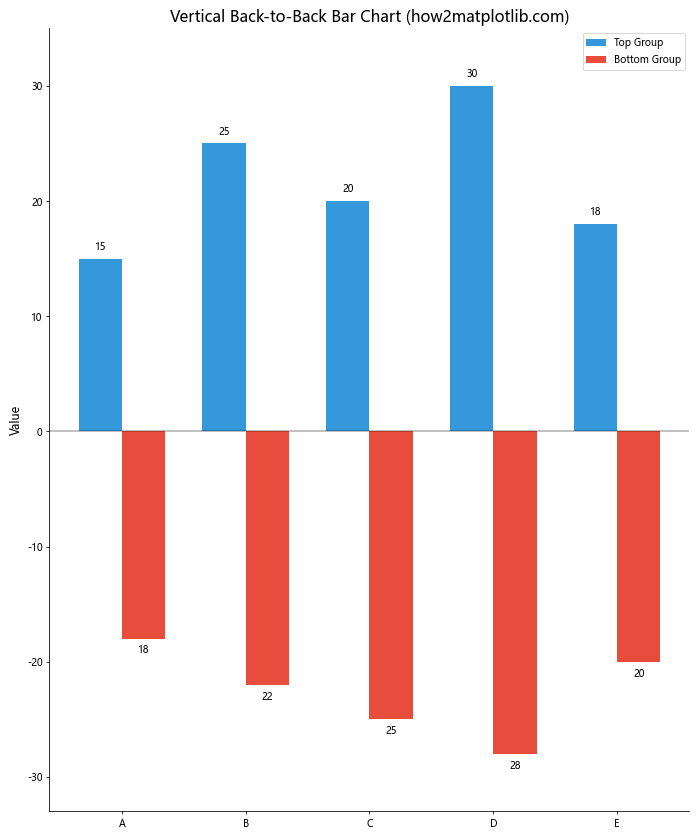
This example shows how to create a vertical back-to-back bar chart when plotting back-to-back bar charts Matplotlib. The bars are now arranged vertically, with one group extending upwards and the other extending downwards.
Conclusion
Plotting back-to-back bar charts Matplotlib offers a powerful way to visualize and compare two sets of data side by side. Throughout this comprehensive guide, we’ve explored various techniques and customizations for creating these charts, from basic examples to more advanced and visually appealing variations.
We’ve covered a wide range of topics related to plotting back-to-back bar charts Matplotlib, including:
- Creating simple back-to-back bar charts
- Customizing colors and styles
- Adding error bars
- Creating stacked and grouped back-to-back bar charts
- Adding data labels and color gradients
- Creating animated back-to-back bar charts
- Customizing tick labels and gridlines
- Working with percentage values
- Creating vertical back-to-back bar charts
By mastering these techniques, you’ll be well-equipped to create informative and visually striking back-to-back bar charts using Matplotlib. Remember that the key to effective data visualization is not just in the technical implementation, but also in choosing the right type of chart for your data and ensuring that it communicates your message clearly.
When plotting back-to-back bar charts Matplotlib, always consider your audience and the story you want to tell with your data. Experiment with different styles, colors, and layouts to find the most effective way to present your information.