Comprehensive Guide to Matplotlib.axis.Axis.get_visible() Function in Python
Matplotlib.axis.Axis.get_visible() function in Python is an essential method for managing the visibility of axes in Matplotlib plots. This function allows developers to determine whether a specific axis is currently visible or hidden. Understanding and utilizing the Matplotlib.axis.Axis.get_visible() function is crucial for creating dynamic and interactive visualizations. In this comprehensive guide, we’ll explore the various aspects of this function, its usage, and provide numerous examples to illustrate its application in different scenarios.
Introduction to Matplotlib.axis.Axis.get_visible() Function
The Matplotlib.axis.Axis.get_visible() function is a method of the Axis class in Matplotlib. It is used to retrieve the visibility status of an axis. This function returns a boolean value: True if the axis is visible, and False if it is hidden. By using this function, developers can easily check the current visibility state of an axis and make decisions based on that information.
Let’s start with a simple example to demonstrate the basic usage of the Matplotlib.axis.Axis.get_visible() function:
import matplotlib.pyplot as plt

# Create a figure and axis
fig, ax = plt.subplots()

# Plot some data
ax.plot([1, 2, 3, 4], [1, 4, 2, 3], label='Data from how2matplotlib.com')

# Check the visibility of the x-axis
x_axis_visible = ax.xaxis.get_visible()

print(f"X-axis visibility: {x_axis_visible}")

plt.show()
Output:
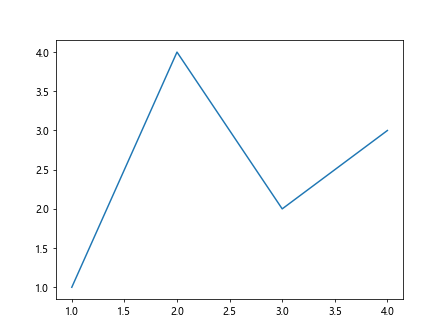
In this example, we create a simple plot and use the get_visible() function to check the visibility of the x-axis. By default, both x and y axes are visible, so the function will return True.
Understanding the Importance of Matplotlib.axis.Axis.get_visible() Function
The Matplotlib.axis.Axis.get_visible() function plays a crucial role in creating dynamic and interactive visualizations. It allows developers to:
- Check the current visibility state of an axis
- Make decisions based on the visibility status
- Create conditional logic for axis manipulation
- Implement toggle functionality for axis visibility
By leveraging this function, you can create more flexible and user-friendly plots that adapt to different requirements and user interactions.
Syntax and Parameters of Matplotlib.axis.Axis.get_visible() Function
The syntax for using the Matplotlib.axis.Axis.get_visible() function is straightforward:
axis.get_visible()
Where axis is an instance of the Matplotlib.axis.Axis class. This function doesn’t take any parameters, making it simple to use.
Let’s look at an example that demonstrates how to access both x and y axes and check their visibility:
import matplotlib.pyplot as plt

# Create a figure and axis
fig, ax = plt.subplots()

# Plot some data
ax.plot([1, 2, 3, 4], [1, 4, 2, 3], label='Data from how2matplotlib.com')

# Check the visibility of both x and y axes
x_axis_visible = ax.xaxis.get_visible()
y_axis_visible = ax.yaxis.get_visible()

print(f"X-axis visibility: {x_axis_visible}")
print(f"Y-axis visibility: {y_axis_visible}")

plt.show()
Output:
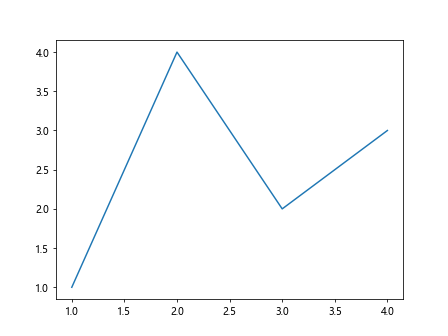
In this example, we use the get_visible() function on both the x-axis (ax.xaxis) and y-axis (ax.yaxis) to check their visibility status.
Using Matplotlib.axis.Axis.get_visible() Function with Different Plot Types
The Matplotlib.axis.Axis.get_visible() function can be used with various plot types in Matplotlib. Let’s explore how to use this function with different plot types and configurations.
Line Plots
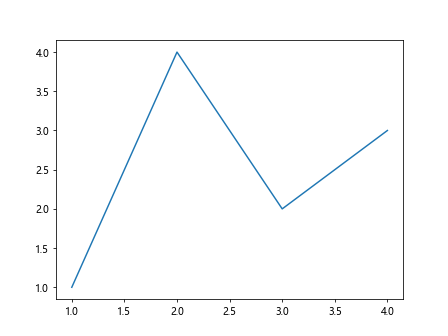
Here’s an example of using the get_visible() function with a line plot:
import matplotlib.pyplot as plt

# Create a figure and axis
fig, ax = plt.subplots()

# Plot some data
ax.plot([1, 2, 3, 4], [1, 4, 2, 3], label='Line from how2matplotlib.com')

# Check the visibility of the x-axis
x_axis_visible = ax.xaxis.get_visible()

print(f"X-axis visibility in line plot: {x_axis_visible}")

plt.show()
Output:
Scatter Plots
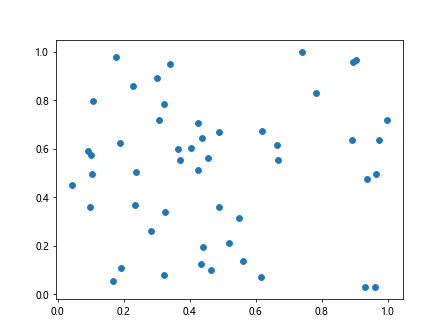
Now, let’s see how to use the get_visible() function with a scatter plot:
import matplotlib.pyplot as plt
import numpy as np

# Create a figure and axis
fig, ax = plt.subplots()

# Generate random data
x = np.random.rand(50)
y = np.random.rand(50)

# Create a scatter plot
ax.scatter(x, y, label='Scatter from how2matplotlib.com')

# Check the visibility of the y-axis
y_axis_visible = ax.yaxis.get_visible()

print(f"Y-axis visibility in scatter plot: {y_axis_visible}")

plt.show()
Output:
Bar Plots
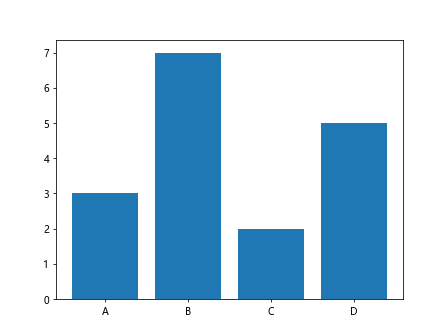
Here’s an example of using the get_visible() function with a bar plot:
import matplotlib.pyplot as plt

# Create a figure and axis
fig, ax = plt.subplots()

# Create a bar plot
categories = ['A', 'B', 'C', 'D']
values = [3, 7, 2, 5]
ax.bar(categories, values, label='Bar plot from how2matplotlib.com')

# Check the visibility of both axes
x_axis_visible = ax.xaxis.get_visible()
y_axis_visible = ax.yaxis.get_visible()

print(f"X-axis visibility in bar plot: {x_axis_visible}")
print(f"Y-axis visibility in bar plot: {y_axis_visible}")

plt.show()
Output:
Combining Matplotlib.axis.Axis.get_visible() Function with Other Axis Methods
The Matplotlib.axis.Axis.get_visible() function can be used in conjunction with other axis methods to create more complex visualizations and interactions. Let’s explore some examples of combining this function with other axis-related methods.
Toggling Axis Visibility
In this example, we’ll use the get_visible() function along with the set_visible() method to toggle the visibility of an axis:
import matplotlib.pyplot as plt

# Create a figure and axis
fig, ax = plt.subplots()

# Plot some data
ax.plot([1, 2, 3, 4], [1, 4, 2, 3], label='Data from how2matplotlib.com')

# Function to toggle axis visibility
def toggle_axis_visibility(axis):
    current_visibility = axis.get_visible()
    axis.set_visible(not current_visibility)
    plt.draw()

# Toggle x-axis visibility
toggle_axis_visibility(ax.xaxis)

# Check and print the new visibility status
x_axis_visible = ax.xaxis.get_visible()
print(f"X-axis visibility after toggle: {x_axis_visible}")

plt.show()
Output:
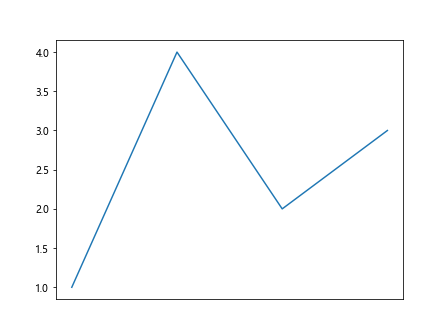
In this example, we define a function called toggle_axis_visibility that uses the get_visible() function to check the current visibility status and then uses set_visible() to toggle it.
Conditional Axis Labeling
Here’s an example that uses the get_visible() function to conditionally apply axis labels:
import matplotlib.pyplot as plt

# Create a figure and axis
fig, ax = plt.subplots()

# Plot some data
ax.plot([1, 2, 3, 4], [1, 4, 2, 3], label='Data from how2matplotlib.com')

# Check x-axis visibility
x_axis_visible = ax.xaxis.get_visible()

# Apply labels only if the axis is visible
if x_axis_visible:
    ax.set_xlabel('X-axis label')
    ax.set_ylabel('Y-axis label')

plt.show()
Output:
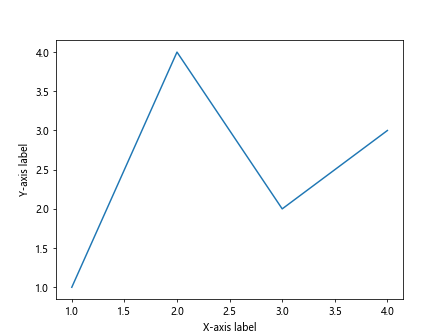
In this example, we use the get_visible() function to check if the x-axis is visible before applying axis labels. This approach can be useful when you want to avoid adding labels to hidden axes.
Advanced Usage of Matplotlib.axis.Axis.get_visible() Function
Let’s explore some advanced usage scenarios for the Matplotlib.axis.Axis.get_visible() function, including working with subplots and custom axis configurations.
Working with Subplots
When working with multiple subplots, you can use the get_visible() function to check and manage the visibility of axes across different subplots:
import matplotlib.pyplot as plt

# Create a figure with multiple subplots
fig, (ax1, ax2) = plt.subplots(2, 1, figsize=(8, 8))

# Plot data on both subplots
ax1.plot([1, 2, 3, 4], [1, 4, 2, 3], label='Data 1 from how2matplotlib.com')
ax2.plot([1, 2, 3, 4], [3, 1, 4, 2], label='Data 2 from how2matplotlib.com')

# Check visibility of x-axes in both subplots
x_axis_visible_1 = ax1.xaxis.get_visible()
x_axis_visible_2 = ax2.xaxis.get_visible()

print(f"X-axis visibility in subplot 1: {x_axis_visible_1}")
print(f"X-axis visibility in subplot 2: {x_axis_visible_2}")

plt.show()
Output:
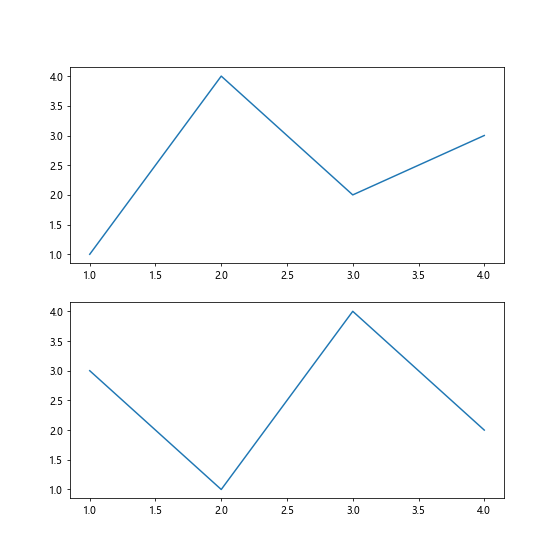
This example demonstrates how to use the get_visible() function with multiple subplots to check the visibility of axes in different plot areas.
Custom Axis Configurations
You can use the get_visible() function in combination with custom axis configurations to create more complex visualizations:
import matplotlib.pyplot as plt

# Create a figure and axis
fig, ax = plt.subplots()

# Plot some data
ax.plot([1, 2, 3, 4], [1, 4, 2, 3], label='Data from how2matplotlib.com')

# Create a secondary y-axis
ax2 = ax.twinx()
ax2.plot([1, 2, 3, 4], [2, 3, 1, 4], color='red', label='Secondary data')

# Check visibility of both y-axes
y_axis_visible_1 = ax.yaxis.get_visible()
y_axis_visible_2 = ax2.yaxis.get_visible()

print(f"Primary y-axis visibility: {y_axis_visible_1}")
print(f"Secondary y-axis visibility: {y_axis_visible_2}")

plt.show()
Output:
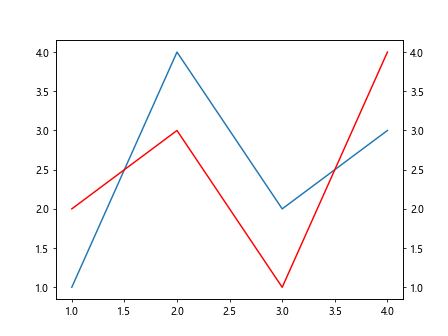
In this example, we create a plot with a secondary y-axis and use the get_visible() function to check the visibility of both y-axes.
Error Handling and Best Practices
When using the Matplotlib.axis.Axis.get_visible() function, it’s important to consider error handling and follow best practices to ensure your code is robust and maintainable.
Error Handling
Although the get_visible() function is relatively simple and doesn’t take any parameters, it’s still a good practice to implement error handling:
import matplotlib.pyplot as plt

# Create a figure and axis
fig, ax = plt.subplots()

# Plot some data
ax.plot([1, 2, 3, 4], [1, 4, 2, 3], label='Data from how2matplotlib.com')

try:
    x_axis_visible = ax.xaxis.get_visible()
    print(f"X-axis visibility: {x_axis_visible}")
except AttributeError:
    print("Error: Unable to access axis visibility")

plt.show()
Output:
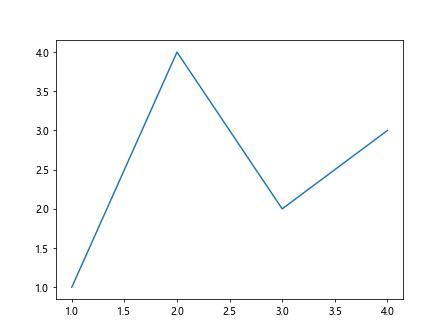
This example demonstrates how to use a try-except block to handle potential errors when calling the get_visible() function.
Best Practices
Here are some best practices to follow when using the Matplotlib.axis.Axis.get_visible() function:
- Always check if the axis object exists before calling get_visible()
- Use meaningful variable names when storing the visibility status
- Combine get_visible() with set_visible() for more dynamic visualizations
- Document your code to explain the purpose of visibility checks
Here’s an example that incorporates these best practices:
import matplotlib.pyplot as plt

def create_plot_with_visibility_check(data_x, data_y):
    """
    Create a plot and check axis visibility.

    Args:
    data_x (list): X-axis data
    data_y (list): Y-axis data

    Returns:
    tuple: Visibility status of x and y axes
    """
    fig, ax = plt.subplots()

    # Plot data
    ax.plot(data_x, data_y, label='Data from how2matplotlib.com')

    # Check axis visibility
    x_axis_visible = ax.xaxis.get_visible() if hasattr(ax, 'xaxis') else None
    y_axis_visible = ax.yaxis.get_visible() if hasattr(ax, 'yaxis') else None

    return x_axis_visible, y_axis_visible

# Example usage
x_data = [1, 2, 3, 4]
y_data = [1, 4, 2, 3]

x_visible, y_visible = create_plot_with_visibility_check(x_data, y_data)

print(f"X-axis visibility: {x_visible}")
print(f"Y-axis visibility: {y_visible}")

plt.show()
Output:
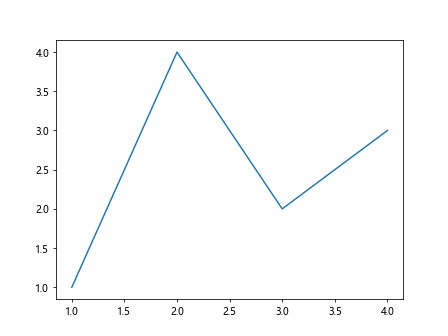
This example demonstrates how to create a reusable function that incorporates best practices for using the get_visible() function.
Comparing Matplotlib.axis.Axis.get_visible() Function with Other Visibility Methods
While the Matplotlib.axis.Axis.get_visible() function is specifically designed for checking axis visibility, there are other methods in Matplotlib for managing visibility of plot elements. Let’s compare this function with some related methods:
get_visible() vs. get_visible() for Artists
The get_visible() method is also available for Matplotlib artists (e.g., lines, patches). Here’s an example comparing the two:
import matplotlib.pyplot as plt

# Create a figure and axis
fig, ax = plt.subplots()

# Plot some data
line, = ax.plot([1, 2, 3, 4], [1, 4, 2, 3], label='Data from how2matplotlib.com')

# Check visibility of the axis and the line
axis_visible = ax.xaxis.get_visible()
line_visible = line.get_visible()

print(f"X-axis visibility: {axis_visible}")
print(f"Line visibility: {line_visible}")

plt.show()
Output:
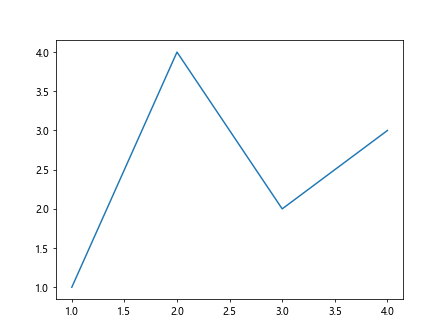
In this example, we use get_visible() for both the axis and the line object, demonstrating the similarity in usage but the difference in the objects they apply to.
Real-world Applications of Matplotlib.axis.Axis.get_visible() Function
The Matplotlib.axis.Axis.get_visible() function has various real-world applications in data visualization and analysis. Let’s explore some practical scenarios where this function can be useful.
Interactive Axis Toggling
One common application is creating interactive plots where users can toggle axis visibility:
import matplotlib.pyplot as plt
from matplotlib.widgets import Button

# Create a figure and axis
fig, ax = plt.subplots()

# Plot some data
ax.plot([1, 2, 3, 4], [1, 4, 2, 3], label='Data from how2matplotlib.com')

# Function to toggle x-axis visibility
def toggle_x_axis(event):
    current_visibility = ax.xaxis.get_visible()
    ax.xaxis.set_visible(not current_visibility)
    plt.draw()

# Create a button for toggling
ax_button = plt.axes([0.81, 0.05, 0.1, 0.075])
button = Button(ax_button, 'Toggle X')
button.on_clicked(toggle_x_axis)

plt.show()
Output:
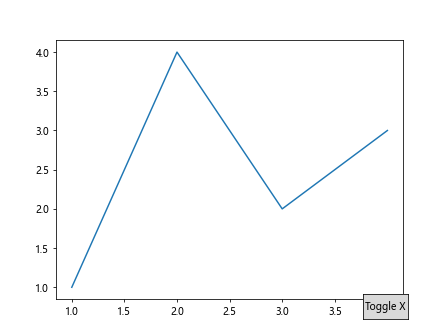
In this example, we create an interactive plot with a button that toggles the x-axis visibility. The get_visible() function is used to check the current visibility state before toggling.
Conditional Formatting Based on Axis Visibility
Another practical application is applying conditional formatting to plot elements based on axis visibility:
import matplotlib.pyplot as plt

# Create a figure and axis
fig, ax = plt.subplots()

# Plot some data
line, = ax.plot([1, 2, 3, 4], [1, 4, 2, 3], label='Data from how2matplotlib.com')

# Check x-axis visibility
x_axis_visible = ax.xaxis.get_visible()

# Apply conditional formatting
if x_axis_visible:
    line.set_color('blue')
    ax.set_title('Plot with Visible X-axis')
else:
    line.set_color('red')
    ax.set_title('Plot with Hidden X-axis')

plt.show()
Output:
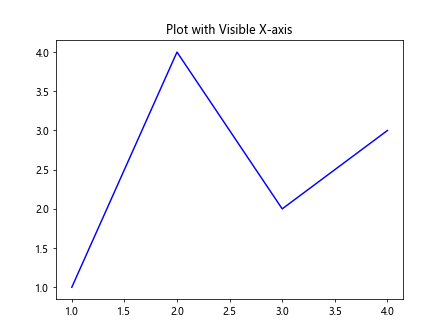
This example demonstrates how to use the get_visible() function to apply different formatting to the plot based on the visibility of the x-axis.
Troubleshooting Common Issues with Matplotlib.axis.Axis.get_visible() Function
When working with the Matplotlib.axis.Axis.get_visible() function, you may encounter some common issues. Let’s address these issues and provide solutions.
Issue 1: Incorrect Axis Reference
One common mistake is trying to access the get_visible() function on the wrong axis object:
import matplotlib.pyplot as plt

# Create a figure and axis
fig, ax = plt.subplots()

# Plot some data
ax.plot([1, 2, 3, 4], [1, 4, 2, 3], label='Data from how2matplotlib.com')

# Incorrect axis reference
try:
    visibility = ax.get_visible()  # This will raise an AttributeError
except AttributeError:
    print("Error: 'AxesSubplot' object has no attribute 'get_visible'")

# Correct usage
visibility = ax.xaxis.get_visible()
print(f"X-axis visibility: {visibility}")

plt.show()
Output:
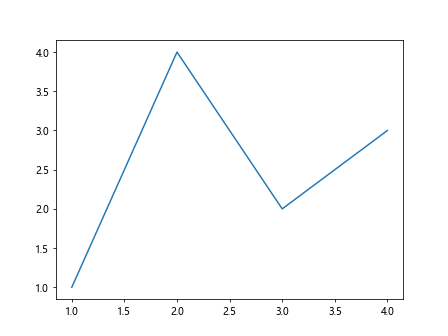
This example shows the correct way to access the get_visible() function for an axis.
Issue 2: Visibility Changes Not Reflected
Sometimes, changes in axis visibility may not be immediately reflected in the plot:
import matplotlib.pyplot as plt

# Create a figure and axis
fig, ax = plt.subplots()

# Plot some data
ax.plot([1, 2, 3, 4], [1, 4, 2, 3], label='Data from how2matplotlib.com')

# Hide the x-axis
ax.xaxis.set_visible(False)

# Check visibility immediately after hiding
print(f"X-axis visibility after hiding: {ax.xaxis.get_visible()}")

# Force a redraw
plt.draw()

# Check visibility after redraw
print(f"X-axis visibility after redraw: {ax.xaxis.get_visible()}")

plt.show()
Output:
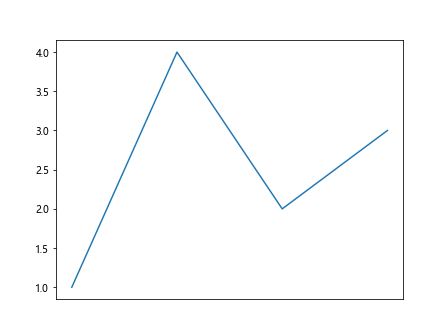
This example demonstrates how to ensure visibility changes are properly reflected by forcing a redraw of the plot.
Optimizing Performance with Matplotlib.axis.Axis.get_visible() Function
While the get_visible() function itself is not computationally expensive, it’s important to consider performance when using it in larger applications or with complex plots. Here are some tips for optimizing performance:
Caching Visibility State
If you’re frequently checking the visibility of an axis, consider caching the state to reduce redundant function calls:
import matplotlib.pyplot as plt

# Create a figure and axis
fig, ax = plt.subplots()

# Plot some data
ax.plot([1, 2, 3, 4], [1, 4, 2, 3], label='Data from how2matplotlib.com')

# Cache the visibility state
x_axis_visible = ax.xaxis.get_visible()

# Use the cached state multiple times
for i in range(5):
    if x_axis_visible:
        print(f"Iteration {i+1}: X-axis is visible")
    else:
        print(f"Iteration {i+1}: X-axis is hidden")

plt.show()
Output:
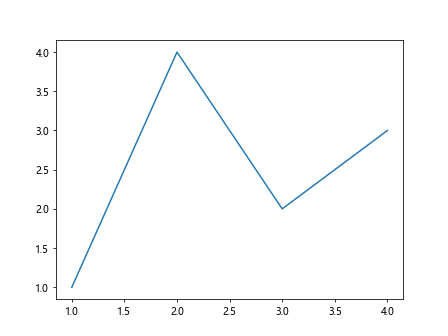
This example demonstrates how to cache the visibility state and use it multiple times without repeatedly calling get_visible().
Batch Processing
When working with multiple axes or subplots, consider batch processing visibility checks:
import matplotlib.pyplot as plt

# Create a figure with multiple subplots
fig, axes = plt.subplots(2, 2, figsize=(10, 10))

# Plot data on all subplots
for ax in axes.flat:
    ax.plot([1, 2, 3, 4], [1, 4, 2, 3], label='Data from how2matplotlib.com')

# Batch process visibility checks
visibility_states = [ax.xaxis.get_visible() for ax in axes.flat]

# Print visibility states
for i, visible in enumerate(visibility_states):
    print(f"Subplot {i+1} x-axis visibility: {visible}")

plt.show()
Output:
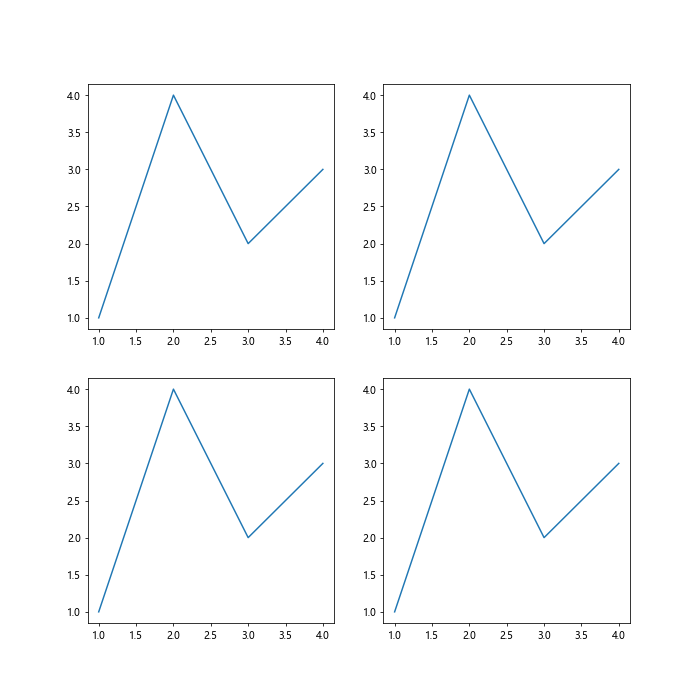
This example shows how to efficiently check the visibility of multiple axes in a single loop.
Integrating Matplotlib.axis.Axis.get_visible() Function with Other Libraries
The Matplotlib.axis.Axis.get_visible() function can be integrated with other Python libraries to create more powerful data visualization and analysis tools. Let’s explore some examples of how to combine this function with popular libraries.
Integration with NumPy
You can use NumPy to perform operations based on axis visibility:
import matplotlib.pyplot as plt
import numpy as np

# Create a figure and axis
fig, ax = plt.subplots()

# Generate data using NumPy
x = np.linspace(0, 10, 100)
y = np.sin(x)

# Plot the data
ax.plot(x, y, label='Sine wave from how2matplotlib.com')

# Check axis visibility
x_visible = ax.xaxis.get_visible()
y_visible = ax.yaxis.get_visible()

# Perform operations based on visibility
if x_visible and y_visible:
    # Calculate the area under the curve
    area = np.trapz(y, x)
    print(f"Area under the curve: {area:.2f}")
else:
    print("Cannot calculate area: One or both axes are hidden")

plt.show()
Output:
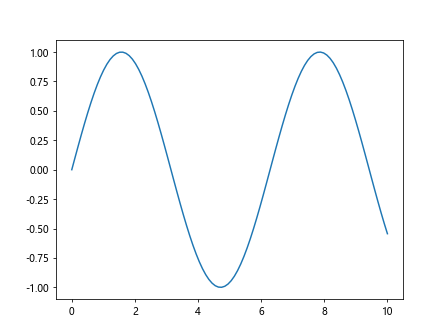
This example demonstrates how to use NumPy to calculate the area under a curve, but only if both axes are visible.
Integration with Pandas
You can combine the get_visible() function with Pandas for data manipulation and visualization:
import matplotlib.pyplot as plt
import pandas as pd

# Create a sample DataFrame
df = pd.DataFrame({
    'x': range(1, 6),
    'y': [1, 4, 2, 3, 5],
    'category': ['A', 'B', 'A', 'B', 'A']
})

# Create a figure and axis
fig, ax = plt.subplots()

# Plot data from the DataFrame
for category in df['category'].unique():
    data = df[df['category'] == category]
    ax.scatter(data['x'], data['y'], label=f'{category} from how2matplotlib.com')

# Check axis visibility
x_visible = ax.xaxis.get_visible()
y_visible = ax.yaxis.get_visible()

# Perform operations based on visibility
if x_visible and y_visible:
    # Calculate and display statistics
    stats = df.groupby('category').agg({'y': ['mean', 'std']})
    print("Category Statistics:")
    print(stats)
else:
    print("Cannot display statistics: One or both axes are hidden")

plt.legend()
plt.show()
Output:
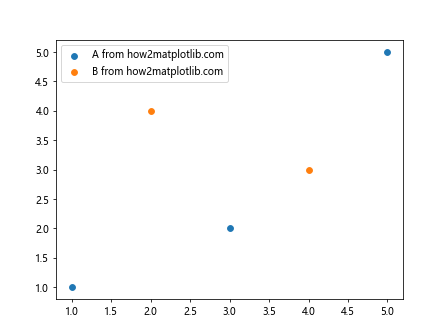
This example shows how to use Pandas to calculate and display statistics based on the visibility of the plot axes.
Future Developments and Potential Enhancements
While the Matplotlib.axis.Axis.get_visible() function is already a useful tool, there are potential enhancements and future developments that could make it even more powerful:
- Integration with interactive widgets: Future versions of Matplotlib could provide built-in widgets for toggling axis visibility using the get_visible() function.
Enhanced visibility states: Instead of just True/False, future implementations could include partial visibility states or opacity levels.
Visibility inheritance: Implementing a hierarchical visibility system where child elements inherit visibility from parent elements.
Performance optimizations: Further optimizing the function for use in large-scale visualizations with many axes.
Event-driven visibility changes: Implementing an event system that triggers callbacks when axis visibility changes.
Conclusion
The Matplotlib.axis.Axis.get_visible() function is a powerful tool for managing and querying axis visibility in Matplotlib plots. Throughout this comprehensive guide, we’ve explored its syntax, usage in various plot types, integration with other methods, and real-world applications. We’ve also addressed common issues, performance considerations, and potential future developments. By mastering the Matplotlib.axis.Axis.get_visible() function, you can create more dynamic, interactive, and informative visualizations. Whether you’re working on simple plots or complex data analysis projects, this function provides valuable flexibility in managing axis visibility.