Comprehensive Guide to Matplotlib.axis.Axis.get_picker() Function in Python
Matplotlib.axis.Axis.get_picker() function in Python is an essential method for retrieving picker information from axis objects in Matplotlib. This function plays a crucial role in interactive visualizations and event handling within Matplotlib plots. In this comprehensive guide, we’ll explore the Matplotlib.axis.Axis.get_picker() function in depth, covering its usage, parameters, return values, and practical applications. We’ll also provide numerous examples to illustrate how this function can be utilized effectively in various scenarios.
Understanding the Matplotlib.axis.Axis.get_picker() Function
The Matplotlib.axis.Axis.get_picker() function is a method of the Axis class in Matplotlib. It is used to retrieve the picker object associated with an axis. The picker object determines how the axis responds to pick events, which are typically triggered by mouse clicks or other user interactions.
To fully grasp the concept of the Matplotlib.axis.Axis.get_picker() function, it’s important to understand the broader context of picking in Matplotlib. Picking refers to the ability to select or interact with specific elements of a plot, such as data points, lines, or axes. The get_picker() function allows you to access the picker information for an axis, which can be useful for customizing interactivity and event handling in your visualizations.
Let’s start with a simple example to demonstrate how to use the Matplotlib.axis.Axis.get_picker() function:
import matplotlib.pyplot as plt

# Create a figure and axis
fig, ax = plt.subplots()

# Set a picker for the x-axis
ax.xaxis.set_picker(5)

# Get the picker for the x-axis
picker = ax.xaxis.get_picker()

print(f"X-axis picker: {picker}")

plt.title("How to use Matplotlib.axis.Axis.get_picker() - how2matplotlib.com")
plt.show()
Output:
In this example, we create a figure and axis using plt.subplots(). We then set a picker for the x-axis using the set_picker() method, specifying a tolerance of 5 pixels. Finally, we use the get_picker() function to retrieve the picker object and print it.
Syntax and Parameters of Matplotlib.axis.Axis.get_picker()
The Matplotlib.axis.Axis.get_picker() function has a simple syntax:
Axis.get_picker()
This function doesn’t take any parameters, making it straightforward to use. It simply returns the current picker object associated with the axis.
Let’s look at another example to illustrate how to use get_picker() in conjunction with other Matplotlib functions:
import matplotlib.pyplot as plt

fig, ax = plt.subplots()

# Set different pickers for x and y axes
ax.xaxis.set_picker(True)
ax.yaxis.set_picker(lambda axis, mouse_event: True)

# Get and print the pickers
x_picker = ax.xaxis.get_picker()
y_picker = ax.yaxis.get_picker()

print(f"X-axis picker: {x_picker}")
print(f"Y-axis picker: {y_picker}")

plt.title("Matplotlib.axis.Axis.get_picker() example - how2matplotlib.com")
plt.show()
Output:
In this example, we set different types of pickers for the x and y axes. For the x-axis, we use a boolean value (True), while for the y-axis, we use a lambda function. We then use get_picker() to retrieve and print both pickers.
Return Value of Matplotlib.axis.Axis.get_picker()
The Matplotlib.axis.Axis.get_picker() function returns the current picker object associated with the axis. The return value can be one of the following types:
- None: If no picker is set for the axis.
- Boolean: True if the axis is pickable, False otherwise.
- Float: A float value representing the picking tolerance in points.
- Callable: A function that determines if the axis is picked.
Let’s examine an example that demonstrates different return values:
import matplotlib.pyplot as plt

fig, (ax1, ax2, ax3, ax4) = plt.subplots(4, 1, figsize=(8, 12))

# No picker set
print(f"No picker: {ax1.xaxis.get_picker()}")

# Boolean picker
ax2.xaxis.set_picker(True)
print(f"Boolean picker: {ax2.xaxis.get_picker()}")

# Float picker (tolerance)
ax3.xaxis.set_picker(5.0)
print(f"Float picker: {ax3.xaxis.get_picker()}")

# Callable picker
def custom_picker(axis, mouse_event):
    return True if mouse_event.xdata < 0.5 else False

ax4.xaxis.set_picker(custom_picker)
print(f"Callable picker: {ax4.xaxis.get_picker()}")

plt.suptitle("Matplotlib.axis.Axis.get_picker() return values - how2matplotlib.com")
plt.tight_layout()
plt.show()
Output:
This example creates four subplots, each with a different type of picker set for the x-axis. We then use get_picker() to retrieve and print the picker for each axis, demonstrating the various return value types.
Practical Applications of Matplotlib.axis.Axis.get_picker()
The Matplotlib.axis.Axis.get_picker() function is particularly useful in scenarios where you need to check or modify the picking behavior of an axis dynamically. Some practical applications include:
- Interactive data exploration
- Custom event handling
- Conditional formatting based on axis properties
- Debugging and troubleshooting picker-related issues
Let's explore some of these applications with examples:
1. Interactive Data Exploration
In this example, we'll create a plot where clicking on an axis toggles its visibility:
import matplotlib.pyplot as plt

fig, ax = plt.subplots()

ax.plot([1, 2, 3, 4], [1, 4, 2, 3], label='Data')

def toggle_axis_visibility(event):
    if event.inaxes:
        axis = event.inaxes.xaxis if event.mouseevent.ydata is None else event.inaxes.yaxis
        current_picker = axis.get_picker()
        if current_picker:
            axis.set_visible(not axis.get_visible())
            plt.draw()

ax.xaxis.set_picker(5)
ax.yaxis.set_picker(5)

fig.canvas.mpl_connect('pick_event', toggle_axis_visibility)

plt.title("Interactive Axis Visibility - how2matplotlib.com")
plt.legend()
plt.show()
Output:
In this example, we set pickers for both x and y axes. We then define a function that toggles the visibility of the clicked axis. The get_picker() function is used to check if the axis is pickable before toggling its visibility.
2. Custom Event Handling
Here's an example that demonstrates how to use get_picker() in custom event handling:
import matplotlib.pyplot as plt

fig, ax = plt.subplots()

ax.plot([1, 2, 3, 4], [1, 4, 2, 3], label='Data')

def on_pick(event):
    if event.artist == ax.xaxis:
        picker = ax.xaxis.get_picker()
        print(f"X-axis picked! Picker: {picker}")
    elif event.artist == ax.yaxis:
        picker = ax.yaxis.get_picker()
        print(f"Y-axis picked! Picker: {picker}")

ax.xaxis.set_picker(5)
ax.yaxis.set_picker(lambda axis, mouse_event: True)

fig.canvas.mpl_connect('pick_event', on_pick)

plt.title("Custom Event Handling - how2matplotlib.com")
plt.legend()
plt.show()
Output:
In this example, we define a custom event handler that prints information about the picked axis, including its picker object retrieved using get_picker().
3. Conditional Formatting Based on Axis Properties
This example shows how to use get_picker() to apply conditional formatting to axis labels:
import matplotlib.pyplot as plt

fig, ax = plt.subplots()

ax.plot([1, 2, 3, 4], [1, 4, 2, 3], label='Data')

def format_axis_labels(axis):
    picker = axis.get_picker()
    if picker is True or (isinstance(picker, float) and picker > 0):
        for label in axis.get_ticklabels():
            label.set_color('red')
            label.set_fontweight('bold')

format_axis_labels(ax.xaxis)
format_axis_labels(ax.yaxis)

ax.xaxis.set_picker(True)
ax.yaxis.set_picker(5.0)

plt.title("Conditional Axis Formatting - how2matplotlib.com")
plt.legend()
plt.show()
Output:
In this example, we define a function that formats axis labels based on the picker property. The get_picker() function is used to check if the axis is pickable and apply formatting accordingly.
4. Debugging and Troubleshooting
Here's an example that demonstrates how to use get_picker() for debugging picker-related issues:
import matplotlib.pyplot as plt

fig, ax = plt.subplots()

ax.plot([1, 2, 3, 4], [1, 4, 2, 3], label='Data')

def debug_picker(event):
    if event.artist == ax.xaxis:
        picker = ax.xaxis.get_picker()
        print(f"X-axis picker: {picker}")
    elif event.artist == ax.yaxis:
        picker = ax.yaxis.get_picker()
        print(f"Y-axis picker: {picker}")
    else:
        print("Unknown artist picked")

ax.xaxis.set_picker(5)
ax.yaxis.set_picker(lambda axis, mouse_event: True)

fig.canvas.mpl_connect('pick_event', debug_picker)

plt.title("Debugging Pickers - how2matplotlib.com")
plt.legend()
plt.show()
Output:
In this debugging example, we print detailed information about the picker object whenever a pick event occurs, helping to identify any issues with picker settings.
Advanced Usage of Matplotlib.axis.Axis.get_picker()
While the basic usage of get_picker() is straightforward, there are some advanced techniques and considerations to keep in mind:
1. Dynamic Picker Changes
You can dynamically change the picker for an axis and use get_picker() to verify the changes:
import matplotlib.pyplot as plt

fig, ax = plt.subplots()

ax.plot([1, 2, 3, 4], [1, 4, 2, 3], label='Data')

def toggle_picker(event):
    if event.key == 't':
        current_picker = ax.xaxis.get_picker()
        new_picker = not current_picker if isinstance(current_picker, bool) else True
        ax.xaxis.set_picker(new_picker)
        print(f"New x-axis picker: {ax.xaxis.get_picker()}")

fig.canvas.mpl_connect('key_press_event', toggle_picker)

plt.title("Dynamic Picker Changes - how2matplotlib.com")
plt.legend()
plt.show()
Output:
In this example, pressing the 't' key toggles the picker for the x-axis between True and False. We use get_picker() to check the current picker state and print the new state after the change.
2. Combining Pickers with Other Axis Properties
You can use get_picker() in combination with other axis properties to create more complex interactions:
import matplotlib.pyplot as plt

fig, ax = plt.subplots()

ax.plot([1, 2, 3, 4], [1, 4, 2, 3], label='Data')

def on_pick(event):
    if event.artist == ax.xaxis:
        picker = ax.xaxis.get_picker()
        if picker and ax.xaxis.get_visible():
            ax.xaxis.set_visible(False)
        elif picker and not ax.xaxis.get_visible():
            ax.xaxis.set_visible(True)
        plt.draw()

ax.xaxis.set_picker(5)

fig.canvas.mpl_connect('pick_event', on_pick)

plt.title("Combining Pickers with Visibility - how2matplotlib.com")
plt.legend()
plt.show()
Output:
In this example, we combine the picker with the visibility property of the x-axis. Clicking on the x-axis toggles its visibility, but only if it has a valid picker set.
3. Custom Picker Functions
You can create custom picker functions and use get_picker() to retrieve and modify them:
import matplotlib.pyplot as plt

fig, ax = plt.subplots()

ax.plot([1, 2, 3, 4], [1, 4, 2, 3], label='Data')

def custom_picker(axis, mouse_event):
    return mouse_event.xdata > 2 if mouse_event.xdata is not None else False

ax.xaxis.set_picker(custom_picker)

def on_pick(event):
    if event.artist == ax.xaxis:
        picker = ax.xaxis.get_picker()
        if callable(picker):
            print("Custom picker function detected")
            # Modify the picker function
            ax.xaxis.set_picker(lambda axis, mouse_event: not picker(axis, mouse_event))
            print("Picker function inverted")

fig.canvas.mpl_connect('pick_event', on_pick)

plt.title("Custom Picker Functions - how2matplotlib.com")
plt.legend()
plt.show()
Output:
In this example, we define a custom picker function that only allows picking the x-axis when the x-coordinate is greater than 2. We then use get_picker() to check if a custom function is set and modify it on pick events.
Best Practices and Tips for Using Matplotlib.axis.Axis.get_picker()
When working with the Matplotlib.axis.Axis.get_picker() function, consider the following best practices and tips:
- Always check the return value of get_picker() before using it, as it can be None if no picker is set.
- Use type checking (isinstance()) when working with picker objects, as they can be of different types (bool, float, callable).
- Combine get_picker() with set_picker() for dynamic picker management.
- Use get_picker() in event handlers to verify picker settings before performing actions.
- Consider using get_picker() for debugging and logging picker-related information.
Here's an example that demonstrates some of these best practices:
import matplotlib.pyplot as plt

fig, ax = plt.subplots()

ax.plot([1, 2, 3, 4], [1, 4, 2, 3], label='Data')

def safe_pick_handler(event):
    if event.artist in (ax.xaxis, ax.yaxis):
        axis = event.artist
        picker = axis.get_picker()

        if picker is None:
            print(f"No picker set for {axis.axis_name}-axis")
        elif isinstance(picker, bool):
            print(f"{axis.axis_name}-axis has a boolean picker: {picker}")
        elif isinstance(picker, float):
            print(f"{axis.axis_name}-axis has a float picker with tolerance: {picker}")
        elif callable(picker):
            print(f"{axis.axis_name}-axis has a custom picker function")
        else:
            print(f"Unknown picker type for {axis.axis_name}-axis")

ax.xaxis.set_picker(5.0)
ax.yaxis.set_picker(lambda axis, mouse_event: True)

fig.canvas.mpl_connect('pick_event', safe_pick_handler)

plt.title("Best Practices for get_picker() - how2matplotlib.com")
plt.legend()
plt.show()
Output:
This example demonstrates safe handling of different picker types and proper use of get_picker() in event handling.
Common Pitfalls and How to Avoid Them
When working with the Matplotlib.axis.Axis.get_picker() function, there are some common pitfalls that developers may encounter. Here are a few of them and how to avoid them:
- Assuming a picker is always set:
One common mistake is assuming that an axis always has a picker set. This can lead to errors when trying to use the return value of get_picker().
import matplotlib.pyplot as plt

fig, ax = plt.subplots()

# Incorrect: This may raise an error if no picker is set
# picker = ax.xaxis.get_picker()
# print(f"Picker tolerance: {picker}")

# Correct: Check if a picker is set before using it
picker = ax.xaxis.get_picker()
if picker is not None:
    print(f"Picker: {picker}")
else:
    print("No picker set")

plt.title("Avoiding Pitfalls with get_picker() - how2matplotlib.com")
plt.show()
Output:
- Not handling different picker types:
Another pitfall is not accounting for the different types of picker objects that get_picker() can return.
import matplotlib.pyplot as plt

fig, ax = plt.subplots()

def handle_pick(event):
    if event.artist == ax.xaxis:
        picker = ax.xaxis.get_picker()
        # Incorrect: This assumes picker is always a float
        # print(f"Picker tolerance: {picker}")

        # Correct: Handle different picker types
        if isinstance(picker, bool):
            print(f"Boolean picker: {picker}")
        elif isinstance(picker, float):
            print(f"Float picker tolerance: {picker}")
        elif callable(picker):
            print("Custom picker function")
        else:
            print(f"Unknown picker type: {type(picker)}")

ax.xaxis.set_picker(True)
fig.canvas.mpl_connect('pick_event', handle_pick)

plt.title("Handling Different Picker Types - how2matplotlib.com")
plt.show()
Output:
- Modifying the picker without updating related properties:
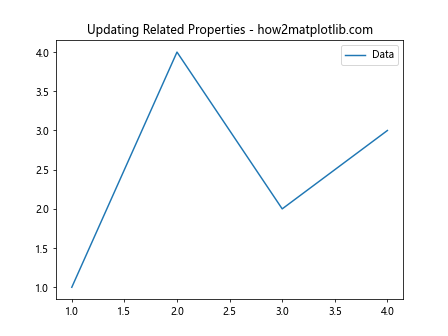
When changing the picker, it's important to update any related properties or event handlers that depend on the picker state.
import matplotlib.pyplot as plt

fig, ax = plt.subplots()

ax.plot([1, 2, 3, 4], [1, 4, 2, 3], label='Data')

def toggle_picker(event):
    if event.key == 't':
        current_picker = ax.xaxis.get_picker()
        if current_picker:
            ax.xaxis.set_picker(None)
            # Update related properties
            ax.xaxis.set_visible(True)
        else:
            ax.xaxis.set_picker(5)
        print(f"New picker: {ax.xaxis.get_picker()}")

fig.canvas.mpl_connect('key_press_event', toggle_picker)

plt.title("Updating Related Properties - how2matplotlib.com")
plt.legend()
plt.show()
Output:
Integrating get_picker() with Other Matplotlib Features
The Matplotlib.axis.Axis.get_picker() function can be integrated with other Matplotlib features to create more complex and interactive visualizations. Here are some examples:
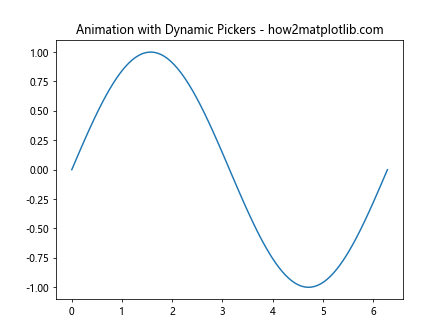
- Using get_picker() with animations:
import matplotlib.pyplot as plt
import matplotlib.animation as animation
import numpy as np

fig, ax = plt.subplots()

x = np.linspace(0, 2 * np.pi, 100)
line, = ax.plot(x, np.sin(x))

ax.xaxis.set_picker(5)
ax.yaxis.set_picker(5)

def animate(frame):
    line.set_ydata(np.sin(x + frame / 10))
    return line,

def on_pick(event):
    if event.artist in (ax.xaxis, ax.yaxis):
        picker = event.artist.get_picker()
        print(f"{event.artist.axis_name}-axis picker: {picker}")
        if isinstance(picker, float):
            event.artist.set_picker(picker * 1.5)
            print(f"Increased {event.artist.axis_name}-axis picker tolerance")

anim = animation.FuncAnimation(fig, animate, frames=100, interval=50, blit=True)
fig.canvas.mpl_connect('pick_event', on_pick)

plt.title("Animation with Dynamic Pickers - how2matplotlib.com")
plt.show()
Output:
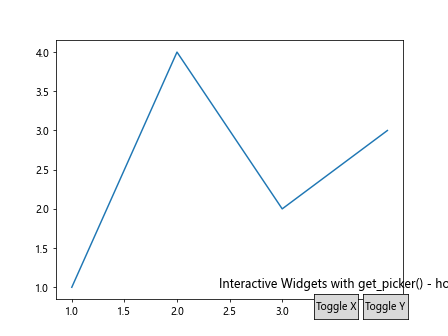
- Integrating with interactive widgets:
import matplotlib.pyplot as plt
from matplotlib.widgets import Button

fig, ax = plt.subplots()

ax.plot([1, 2, 3, 4], [1, 4, 2, 3])

ax.xaxis.set_picker(5)
ax.yaxis.set_picker(5)

def toggle_picker(axis):
    current_picker = axis.get_picker()
    if current_picker:
        axis.set_picker(None)
    else:
        axis.set_picker(5)
    print(f"New {axis.axis_name}-axis picker: {axis.get_picker()}")
    plt.draw()

ax_button_x = plt.axes([0.7, 0.05, 0.1, 0.075])
ax_button_y = plt.axes([0.81, 0.05, 0.1, 0.075])

button_x = Button(ax_button_x, 'Toggle X')
button_y = Button(ax_button_y, 'Toggle Y')

button_x.on_clicked(lambda event: toggle_picker(ax.xaxis))
button_y.on_clicked(lambda event: toggle_picker(ax.yaxis))

plt.title("Interactive Widgets with get_picker() - how2matplotlib.com")
plt.show()
Output:
Performance Considerations
While the Matplotlib.axis.Axis.get_picker() function itself is not computationally expensive, it's important to consider performance when using it in conjunction with other operations, especially in interactive visualizations or animations. Here are some tips to optimize performance:
- Minimize frequent calls to get_picker() in tight loops or animation functions.
- Use caching techniques to store picker information if it doesn't change frequently.
- When setting custom picker functions, ensure they are efficient and don't perform unnecessary calculations.
Here's an example that demonstrates some of these performance considerations:
import matplotlib.pyplot as plt
import matplotlib.animation as animation
import numpy as np

fig, ax = plt.subplots()

x = np.linspace(0, 2 * np.pi, 1000)
line, = ax.plot(x, np.sin(x))

ax.xaxis.set_picker(5)
ax.yaxis.set_picker(5)

# Cache picker information
x_picker = ax.xaxis.get_picker()
y_picker = ax.yaxis.get_picker()

def efficient_custom_picker(axis, mouse_event):
    return mouse_event.xdata > np.pi if mouse_event.xdata is not None else False

ax.xaxis.set_picker(efficient_custom_picker)

def animate(frame):
    line.set_ydata(np.sin(x + frame / 100))
    return line,

def on_pick(event):
    if event.artist == ax.xaxis:
        # Use cached picker info instead of calling get_picker()
        print(f"X-axis picked (cached picker: {x_picker})")
    elif event.artist == ax.yaxis:
        print(f"Y-axis picked (cached picker: {y_picker})")

anim = animation.FuncAnimation(fig, animate, frames=200, interval=50, blit=True)
fig.canvas.mpl_connect('pick_event', on_pick)

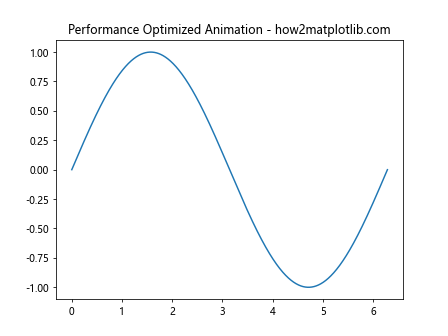
plt.title("Performance Optimized Animation - how2matplotlib.com")
plt.show()
Output:
Conclusion
The Matplotlib.axis.Axis.get_picker() function is a powerful tool for retrieving and managing picker information in Matplotlib visualizations. Throughout this comprehensive guide, we've explored its usage, syntax, return values, and practical applications. We've also covered advanced techniques, best practices, common pitfalls, and performance considerations.
By mastering the use of get_picker(), you can create more interactive and dynamic visualizations, implement custom event handling, and debug picker-related issues effectively. Remember to always check the return value of get_picker(), handle different picker types appropriately, and consider performance implications when using it in complex visualizations or animations.