How to Plot a Horizontal Line in Matplotlib
Plot a horizontal line in Matplotlib is a fundamental skill for data visualization in Python. This article will provide an in-depth exploration of various methods to plot a horizontal line using Matplotlib, one of the most popular plotting libraries in Python. We’ll cover different approaches, customization options, and practical examples to help you master the art of plotting horizontal lines in your data visualizations.
Understanding the Basics of Plotting a Horizontal Line in Matplotlib
Before we dive into the specifics of plotting a horizontal line in Matplotlib, it’s essential to understand the basic concepts. A horizontal line is a straight line that runs parallel to the x-axis. In data visualization, horizontal lines are often used to represent thresholds, averages, or reference points in a plot.
To plot a horizontal line in Matplotlib, we typically use the axhline() function or the plot() function with appropriate parameters. Let’s start with a simple example:
import matplotlib.pyplot as plt

plt.figure(figsize=(8, 6))
plt.axhline(y=5, color='r', linestyle='--')
plt.title('Simple Horizontal Line Plot - how2matplotlib.com')
plt.xlabel('X-axis')
plt.ylabel('Y-axis')
plt.show()
Output:
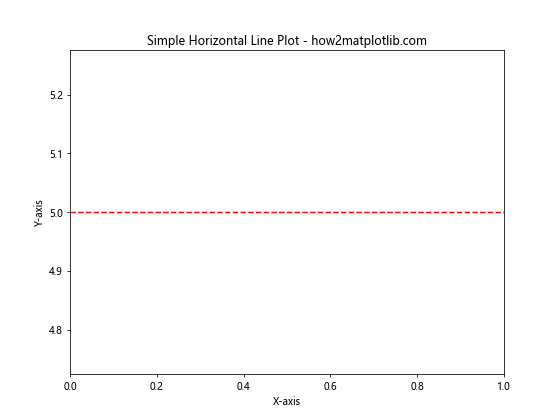
In this example, we use the axhline() function to plot a horizontal line at y=5. The color parameter sets the line color to red, and the linestyle parameter makes it a dashed line.
Using axhline() to Plot a Horizontal Line in Matplotlib
The axhline() function is specifically designed to plot horizontal lines in Matplotlib. It offers several advantages when it comes to plotting horizontal lines:
- Simplicity: It requires minimal parameters to create a horizontal line.
- Axis-spanning: By default, it spans the entire x-axis.
- Customization: It provides various options for customizing the line appearance.
Let’s explore some more examples of using axhline():
import matplotlib.pyplot as plt

fig, ax = plt.subplots(figsize=(10, 8))

# Plot multiple horizontal lines
ax.axhline(y=2, color='blue', linestyle='-', label='Line 1')
ax.axhline(y=4, color='green', linestyle='--', label='Line 2')
ax.axhline(y=6, color='red', linestyle=':', label='Line 3')

ax.set_title('Multiple Horizontal Lines - how2matplotlib.com')
ax.set_xlabel('X-axis')
ax.set_ylabel('Y-axis')
ax.legend()
plt.show()
Output:
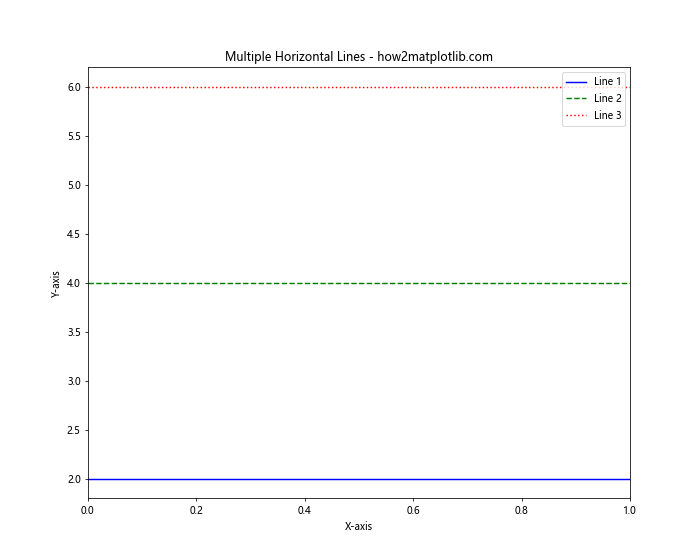
In this example, we plot multiple horizontal lines using axhline() with different y-values, colors, and line styles. We also add labels to each line and include a legend for better clarity.
Customizing Horizontal Lines in Matplotlib
When plotting a horizontal line in Matplotlib, you have various options to customize its appearance. Let’s explore some of these customization techniques:
Adjusting Line Width
You can control the thickness of the horizontal line using the linewidth parameter:
import matplotlib.pyplot as plt

fig, ax = plt.subplots(figsize=(8, 6))

ax.axhline(y=3, color='purple', linewidth=1, label='Thin')
ax.axhline(y=5, color='orange', linewidth=3, label='Medium')
ax.axhline(y=7, color='green', linewidth=5, label='Thick')

ax.set_title('Horizontal Lines with Different Widths - how2matplotlib.com')
ax.set_xlabel('X-axis')
ax.set_ylabel('Y-axis')
ax.legend()
plt.show()
Output:
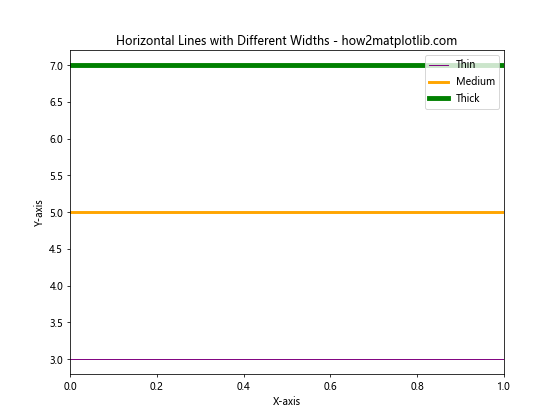
This example demonstrates how to plot horizontal lines with different widths using the linewidth parameter.
Adding Transparency
You can make the horizontal line semi-transparent using the alpha parameter:
import matplotlib.pyplot as plt

fig, ax = plt.subplots(figsize=(8, 6))

ax.axhline(y=2, color='blue', alpha=1.0, label='Opaque')
ax.axhline(y=4, color='blue', alpha=0.5, label='Semi-transparent')
ax.axhline(y=6, color='blue', alpha=0.2, label='Very transparent')

ax.set_title('Horizontal Lines with Different Transparency - how2matplotlib.com')
ax.set_xlabel('X-axis')
ax.set_ylabel('Y-axis')
ax.legend()
plt.show()
Output:
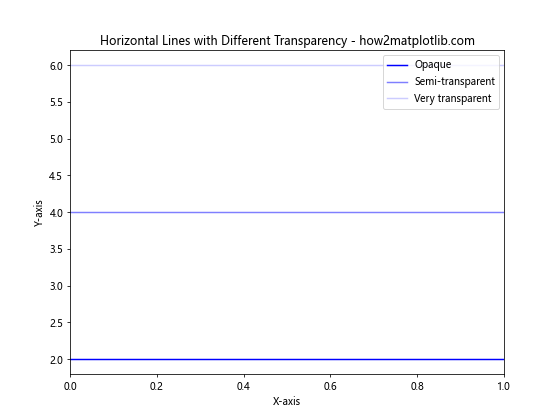
This example shows how to create horizontal lines with different levels of transparency using the alpha parameter.
Plotting Horizontal Lines with Specific X-axis Ranges
By default, axhline() spans the entire x-axis. However, you can limit the horizontal line to a specific x-axis range using the xmin and xmax parameters:
import matplotlib.pyplot as plt

fig, ax = plt.subplots(figsize=(10, 8))

ax.axhline(y=3, xmin=0.2, xmax=0.8, color='red', label='Limited Range')
ax.axhline(y=5, color='blue', label='Full Range')

ax.set_title('Horizontal Lines with Different X-axis Ranges - how2matplotlib.com')
ax.set_xlabel('X-axis')
ax.set_ylabel('Y-axis')
ax.legend()
plt.show()
Output:
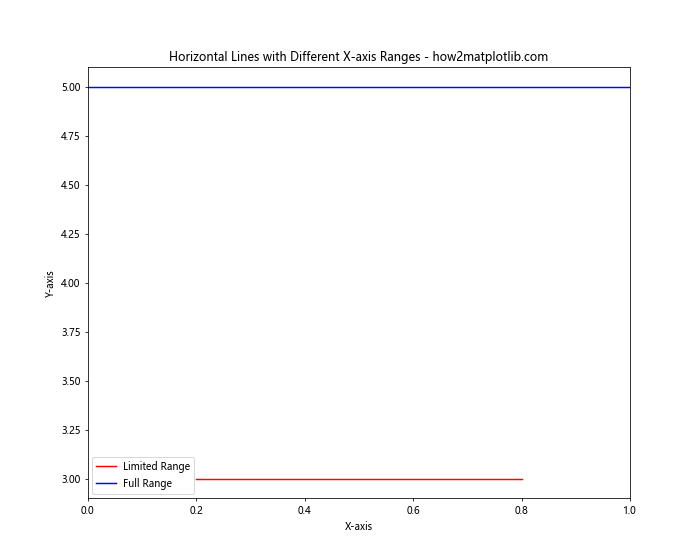
In this example, we plot two horizontal lines: one spanning the entire x-axis and another limited to a specific range using xmin and xmax parameters.
Using plot() to Create Horizontal Lines in Matplotlib
While axhline() is the most straightforward method to plot a horizontal line in Matplotlib, you can also use the more general plot() function. This approach offers more flexibility, especially when you need to plot multiple segments or create more complex line patterns.
Here’s an example of using plot() to create a horizontal line:
import matplotlib.pyplot as plt

fig, ax = plt.subplots(figsize=(8, 6))

x = [0, 10]  # X-axis range
y = [5, 5]   # Y-value for the horizontal line

ax.plot(x, y, color='green', linestyle='--', label='Horizontal Line')

ax.set_title('Horizontal Line using plot() - how2matplotlib.com')
ax.set_xlabel('X-axis')
ax.set_ylabel('Y-axis')
ax.legend()
plt.show()
Output:
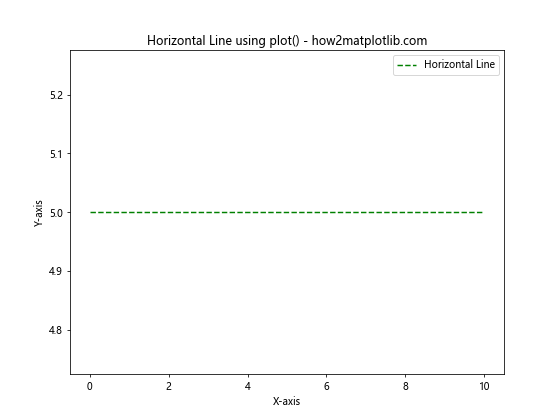
In this example, we create a horizontal line by specifying two points with the same y-value and using the plot() function.
Combining Horizontal Lines with Other Plot Elements
Horizontal lines are often used in combination with other plot elements to enhance data visualization. Let’s explore some examples:
Adding a Horizontal Line to a Scatter Plot
import matplotlib.pyplot as plt
import numpy as np

fig, ax = plt.subplots(figsize=(10, 8))

# Generate random data for scatter plot
x = np.random.rand(50)
y = np.random.rand(50)

# Create scatter plot
ax.scatter(x, y, color='blue', alpha=0.6, label='Data Points')

# Add horizontal line
ax.axhline(y=0.5, color='red', linestyle='--', label='Threshold')

ax.set_title('Scatter Plot with Horizontal Line - how2matplotlib.com')
ax.set_xlabel('X-axis')
ax.set_ylabel('Y-axis')
ax.legend()
plt.show()
Output:
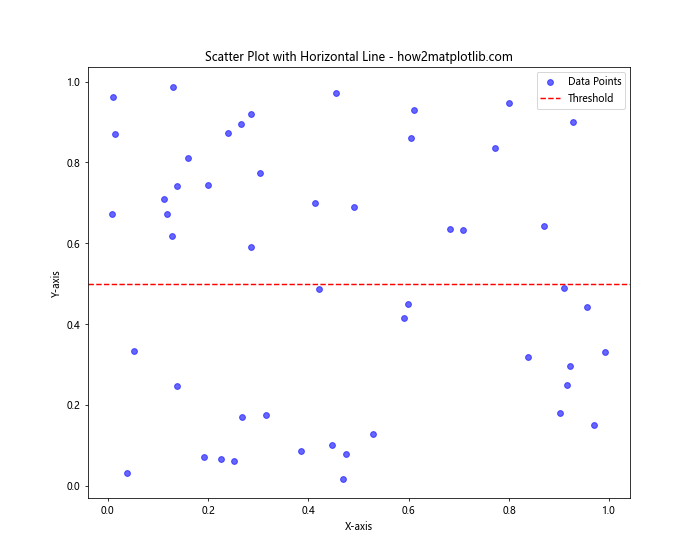
This example demonstrates how to add a horizontal line to a scatter plot, which can be useful for showing thresholds or reference values.
Combining Horizontal and Vertical Lines
import matplotlib.pyplot as plt

fig, ax = plt.subplots(figsize=(8, 8))

# Plot horizontal lines
ax.axhline(y=2, color='red', linestyle='--', label='Horizontal')
ax.axhline(y=6, color='red', linestyle='--')

# Plot vertical lines
ax.axvline(x=3, color='blue', linestyle=':', label='Vertical')
ax.axvline(x=7, color='blue', linestyle=':')

ax.set_title('Combining Horizontal and Vertical Lines - how2matplotlib.com')
ax.set_xlabel('X-axis')
ax.set_ylabel('Y-axis')
ax.legend()
plt.show()
Output:
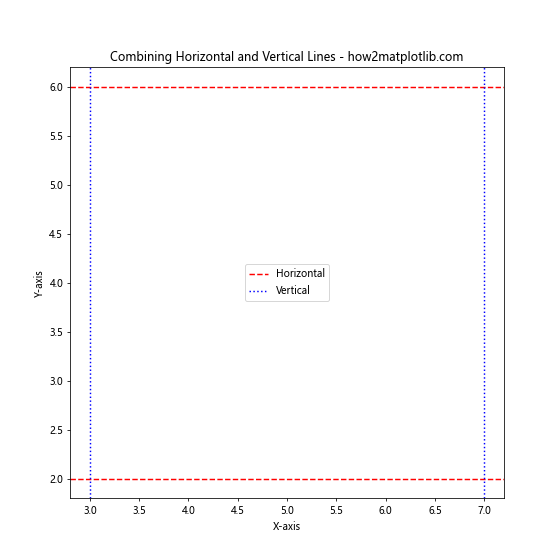
This example shows how to combine horizontal and vertical lines to create a grid-like structure in your plot.
Advanced Techniques for Plotting Horizontal Lines in Matplotlib
Now that we’ve covered the basics, let’s explore some advanced techniques for plotting horizontal lines in Matplotlib.
Creating Dashed Horizontal Lines with Custom Patterns
You can create custom dashed patterns for your horizontal lines using the dashes parameter:
import matplotlib.pyplot as plt

fig, ax = plt.subplots(figsize=(10, 8))

ax.axhline(y=2, color='red', dashes=[5, 2, 10, 2], label='Pattern 1')
ax.axhline(y=4, color='blue', dashes=[2, 2, 10, 2], label='Pattern 2')
ax.axhline(y=6, color='green', dashes=[15, 2, 5, 2], label='Pattern 3')

ax.set_title('Custom Dashed Horizontal Lines - how2matplotlib.com')
ax.set_xlabel('X-axis')
ax.set_ylabel('Y-axis')
ax.legend()
plt.show()
Output:
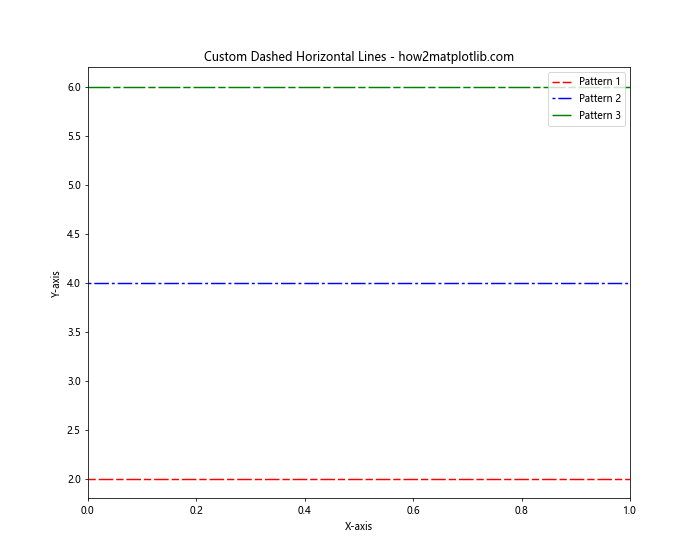
This example demonstrates how to create horizontal lines with custom dash patterns using the dashes parameter.
Adding Text Labels to Horizontal Lines
You can add text labels to your horizontal lines to provide additional context:
import matplotlib.pyplot as plt

fig, ax = plt.subplots(figsize=(10, 8))

y_values = [2, 4, 6]
labels = ['Low', 'Medium', 'High']
colors = ['green', 'orange', 'red']

for y, label, color in zip(y_values, labels, colors):
    ax.axhline(y=y, color=color, linestyle='--')
    ax.text(0.02, y, f'{label}: {y}', verticalalignment='center')

ax.set_title('Horizontal Lines with Text Labels - how2matplotlib.com')
ax.set_xlabel('X-axis')
ax.set_ylabel('Y-axis')
plt.show()
Output:
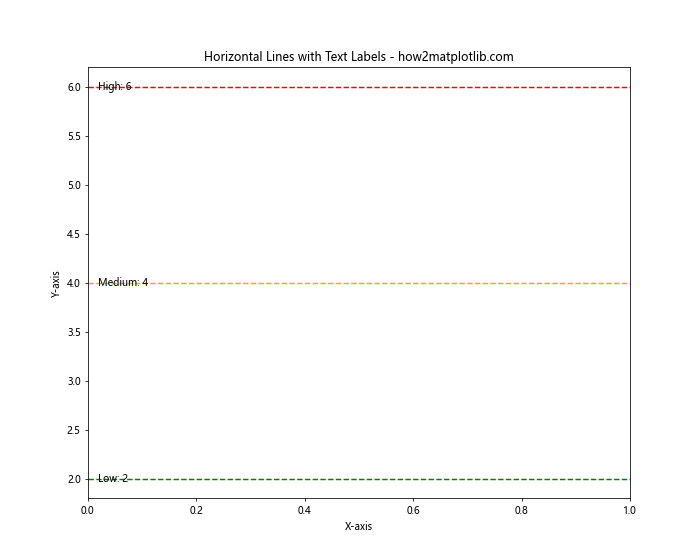
This example shows how to add text labels to horizontal lines, which can be useful for annotating thresholds or categories.
Plotting Horizontal Lines in Subplots
When working with multiple subplots, you might want to add horizontal lines to each subplot. Here’s an example of how to do this:
import matplotlib.pyplot as plt
import numpy as np

fig, (ax1, ax2) = plt.subplots(2, 1, figsize=(10, 12))

# Subplot 1
x1 = np.linspace(0, 10, 100)
y1 = np.sin(x1)
ax1.plot(x1, y1, label='Sin(x)')
ax1.axhline(y=0, color='red', linestyle='--', label='y=0')
ax1.set_title('Subplot 1: Sin(x) with Horizontal Line - how2matplotlib.com')
ax1.set_xlabel('X-axis')
ax1.set_ylabel('Y-axis')
ax1.legend()

# Subplot 2
x2 = np.linspace(0, 10, 100)
y2 = np.cos(x2)
ax2.plot(x2, y2, label='Cos(x)')
ax2.axhline(y=0, color='green', linestyle=':', label='y=0')
ax2.set_title('Subplot 2: Cos(x) with Horizontal Line - how2matplotlib.com')
ax2.set_xlabel('X-axis')
ax2.set_ylabel('Y-axis')
ax2.legend()

plt.tight_layout()
plt.show()
Output:
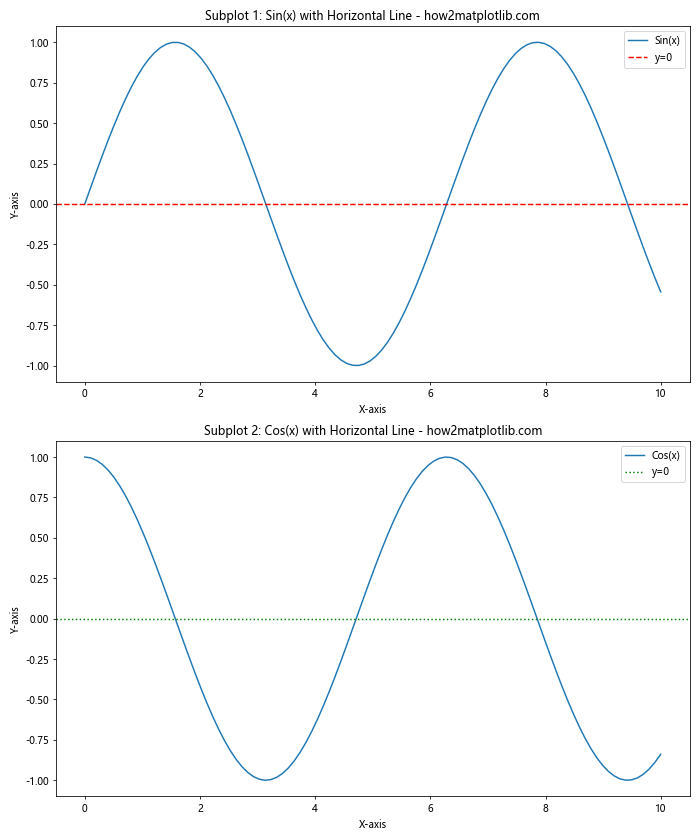
This example demonstrates how to add horizontal lines to multiple subplots, each with different styles and colors.
Using Horizontal Lines for Statistical Visualization
Horizontal lines can be particularly useful in statistical visualizations. Let’s explore a few examples:
Adding Mean and Standard Deviation Lines to a Box Plot
import matplotlib.pyplot as plt
import numpy as np

fig, ax = plt.subplots(figsize=(10, 8))

# Generate random data
data = np.random.randn(100)

# Create box plot
ax.boxplot(data)

# Add mean line
mean = np.mean(data)
ax.axhline(y=mean, color='red', linestyle='--', label=f'Mean: {mean:.2f}')

# Add standard deviation lines
std = np.std(data)
ax.axhline(y=mean+std, color='green', linestyle=':', label=f'+1 Std Dev: {mean+std:.2f}')
ax.axhline(y=mean-std, color='green', linestyle=':', label=f'-1 Std Dev: {mean-std:.2f}')

ax.set_title('Box Plot with Mean and Standard Deviation Lines - how2matplotlib.com')
ax.set_xlabel('Data')
ax.set_ylabel('Values')
ax.legend()
plt.show()
Output:
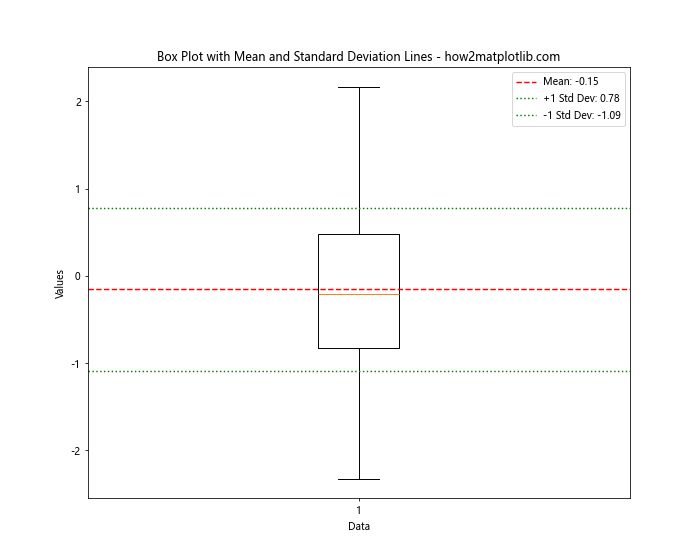
This example shows how to add horizontal lines representing the mean and standard deviation to a box plot.
Creating a Step Plot with Horizontal Lines
import matplotlib.pyplot as plt
import numpy as np

fig, ax = plt.subplots(figsize=(10, 8))

# Generate step data
x = np.arange(0, 10, 1)
y = np.random.randint(0, 10, 10)

# Create step plot
ax.step(x, y, where='post', label='Step Plot')

# Add horizontal lines for each step
for i in range(len(y)):
    ax.axhline(y=y[i], xmin=i/10, xmax=(i+1)/10, color='red', linestyle='--', alpha=0.5)

ax.set_title('Step Plot with Horizontal Lines - how2matplotlib.com')
ax.set_xlabel('X-axis')
ax.set_ylabel('Y-axis')
ax.legend()
plt.show()
Output:
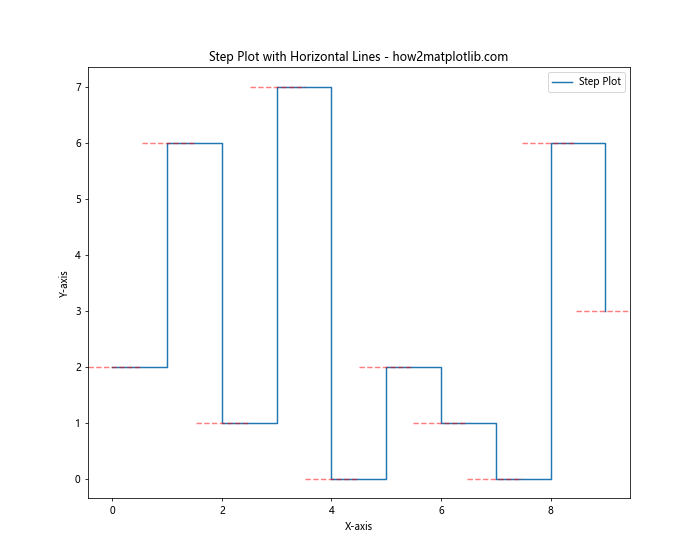
This example demonstrates how to create a step plot and add horizontal lines to emphasize each step.
Animating Horizontal Lines in Matplotlib
You can create animated plots with moving horizontal lines using Matplotlib’s animation features. Here’s a simple example:
import matplotlib.pyplot as plt
import matplotlib.animation as animation
import numpy as np

fig, ax = plt.subplots(figsize=(10, 8))

line, = ax.plot([], [], 'r-')
horizontal_line = ax.axhline(y=0, color='blue', linestyle='--')

ax.set_xlim(0, 2*np.pi)
ax.set_ylim(-1, 1)

def animate(frame):
    x = np.linspace(0, 2*np.pi, 100)
    y = np.sin(x + frame/10)
    line.set_data(x, y)
    horizontal_line.set_ydata(np.sin(frame/10))
    return line, horizontal_line

ani = animation.FuncAnimation(fig, animate, frames=100, blit=True)

ax.set_title('Animated Sine Wave with Moving Horizontal Line - how2matplotlib.com')
ax.set_xlabel('X-axis')
ax.set_ylabel('Y-axis')
plt.show()
Output:
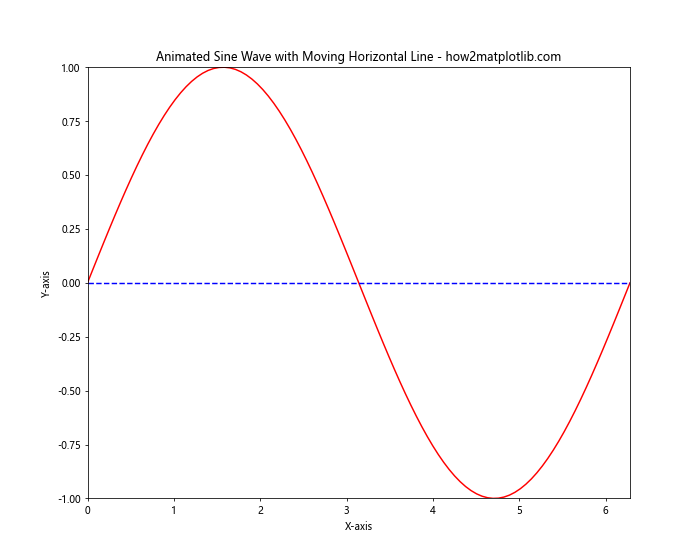
This example creates an animation of a sine wave with a moving horizontal line that follows the wave’s current y-value.
Best Practices for Plotting Horizontal Lines in Matplotlib
When plotting horizontal lines in Matplotlib, consider the following best practices:
- Choose appropriate colors: Use colors that contrast well with your plot’s background and other elements.
- Use meaningful line styles: Different line styles (solid, dashed, dotted) can convey different meanings or importance levels.
- Add labels3. Add labels and legends: Always provide clear labels for your horizontal lines to explain their significance.
- Consider line thickness: Adjust the line width to ensure visibility without overwhelming other plot elements.
- Use transparency when necessary: If your horizontal line overlaps with other plot elements, consider using transparency to maintain visibility of underlying data.
- Limit the number of lines: Too many horizontal lines can clutter your plot and make it difficult to interpret.
- Align with data units: Ensure that your horizontal lines are aligned with the appropriate data units on the y-axis.
- Use consistent styling: If you’re using multiple horizontal lines, maintain consistent styling for similar types of lines.
Troubleshooting Common Issues When Plotting Horizontal Lines in Matplotlib
When working with horizontal lines in Matplotlib, you may encounter some common issues. Here are some problems and their solutions:
Issue 1: Horizontal Line Not Visible
If your horizontal line is not visible, it might be outside the current axis limits. To fix this:
import matplotlib.pyplot as plt

fig, ax = plt.subplots(figsize=(8, 6))

# This line might not be visible
ax.axhline(y=100, color='red')

# Adjust y-axis limits to include the line
ax.set_ylim(0, 120)

ax.set_title('Adjusting Axis Limits for Horizontal Line - how2matplotlib.com')
ax.set_xlabel('X-axis')
ax.set_ylabel('Y-axis')
plt.show()
Output:
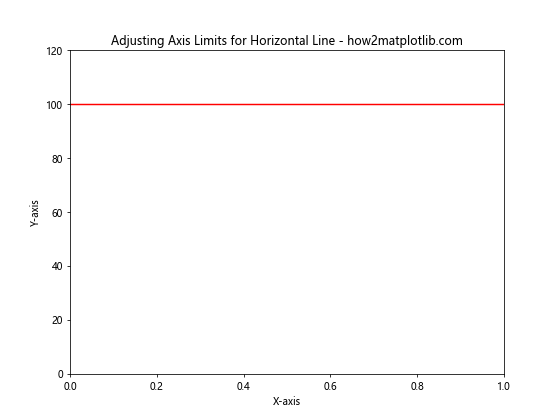
This example demonstrates how to adjust the y-axis limits to ensure your horizontal line is visible.
Issue 2: Horizontal Line Appears Distorted
If your horizontal line appears distorted or slanted, it might be due to unequal scaling of x and y axes. To fix this:
import matplotlib.pyplot as plt

fig, ax = plt.subplots(figsize=(8, 8))

ax.axhline(y=5, color='red')

# Set aspect ratio to 'equal'
ax.set_aspect('equal')

ax.set_title('Maintaining Aspect Ratio for Horizontal Line - how2matplotlib.com')
ax.set_xlabel('X-axis')
ax.set_ylabel('Y-axis')
plt.show()
Output:
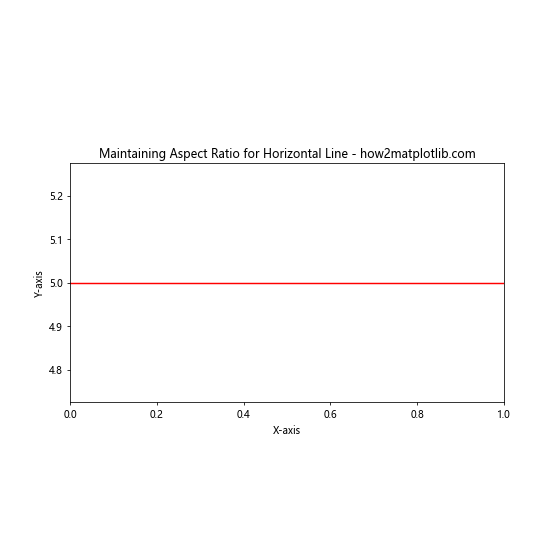
This example shows how to set the aspect ratio to ‘equal’ to ensure your horizontal line appears truly horizontal.
Advanced Applications of Horizontal Lines in Data Visualization
Horizontal lines can be used in various advanced data visualization techniques. Let’s explore some of these applications:
Creating a Waterfall Chart
Waterfall charts are often used in financial analysis to show how an initial value is affected by a series of positive or negative values. Horizontal lines play a crucial role in connecting the bars in a waterfall chart:
import matplotlib.pyplot as plt

fig, ax = plt.subplots(figsize=(12, 8))

categories = ['Start', 'Category A', 'Category B', 'Category C', 'Category D', 'End']
values = [10, 2, -3, 5, -1, 13]

# Calculate cumulative sum
cumulative = [values[0]]
for i in range(1, len(values)-1):
    cumulative.append(cumulative[-1] + values[i])
cumulative.append(values[-1])

# Plot bars
ax.bar(categories, values, bottom=cumulative[:-1], color=['blue'] + ['green' if v > 0 else 'red' for v in values[1:-1]] + ['blue'])

# Add horizontal lines
for i in range(len(categories)-1):
    ax.hlines(y=cumulative[i], xmin=i, xmax=i+1, color='black', linestyle='--')

ax.set_title('Waterfall Chart with Horizontal Lines - how2matplotlib.com')
ax.set_xlabel('Categories')
ax.set_ylabel('Values')
plt.show()
This example demonstrates how to create a waterfall chart using horizontal lines to connect the bars.
Creating a Gantt Chart
Gantt charts are useful for project management and scheduling. Horizontal lines are the key component in representing task durations:
import matplotlib.pyplot as plt
import numpy as np

fig, ax = plt.subplots(figsize=(12, 6))

tasks = ['Task A', 'Task B', 'Task C', 'Task D', 'Task E']
start_dates = [1, 3, 5, 7, 9]
durations = [2, 3, 4, 2, 3]

# Plot horizontal bars for each task
for i, task in enumerate(tasks):
    ax.barh(i, durations[i], left=start_dates[i], height=0.5, align='center', color='skyblue', alpha=0.8)

    # Add task labels
    ax.text(start_dates[i], i, task, va='center', ha='right', fontweight='bold', fontsize=10, color='navy', alpha=0.8)

ax.set_yticks(range(len(tasks)))
ax.set_yticklabels([])
ax.set_xlabel('Time')
ax.set_title('Gantt Chart using Horizontal Bars - how2matplotlib.com')

# Add gridlines
ax.grid(True, axis='x', linestyle='--', alpha=0.7)

plt.tight_layout()
plt.show()
Output:
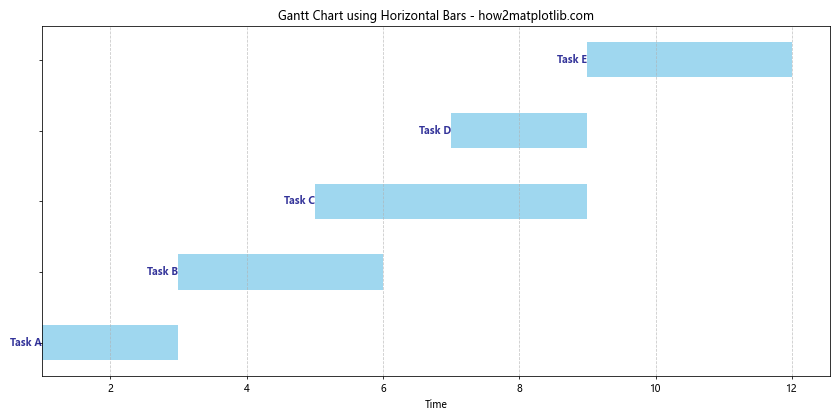
This example shows how to create a simple Gantt chart using horizontal bars to represent task durations.
Integrating Horizontal Lines with Other Matplotlib Features
Horizontal lines can be effectively combined with other Matplotlib features to create more informative visualizations. Let’s explore some of these combinations:
Using Horizontal Lines with Fill_Between
The fill_between function can be used in conjunction with horizontal lines to highlight specific regions of a plot:
import matplotlib.pyplot as plt
import numpy as np

fig, ax = plt.subplots(figsize=(10, 8))

x = np.linspace(0, 10, 100)
y = np.sin(x)

ax.plot(x, y, label='sin(x)')

# Add horizontal lines
ax.axhline(y=0.5, color='red', linestyle='--', label='Upper Threshold')
ax.axhline(y=-0.5, color='green', linestyle='--', label='Lower Threshold')

# Fill between horizontal lines and the curve
ax.fill_between(x, y, 0.5, where=(y <= 0.5), interpolate=True, color='red', alpha=0.3)
ax.fill_between(x, y, -0.5, where=(y >= -0.5), interpolate=True, color='green', alpha=0.3)

ax.set_title('Sine Wave with Horizontal Lines and Filled Regions - how2matplotlib.com')
ax.set_xlabel('X-axis')
ax.set_ylabel('Y-axis')
ax.legend()
plt.show()
Output:
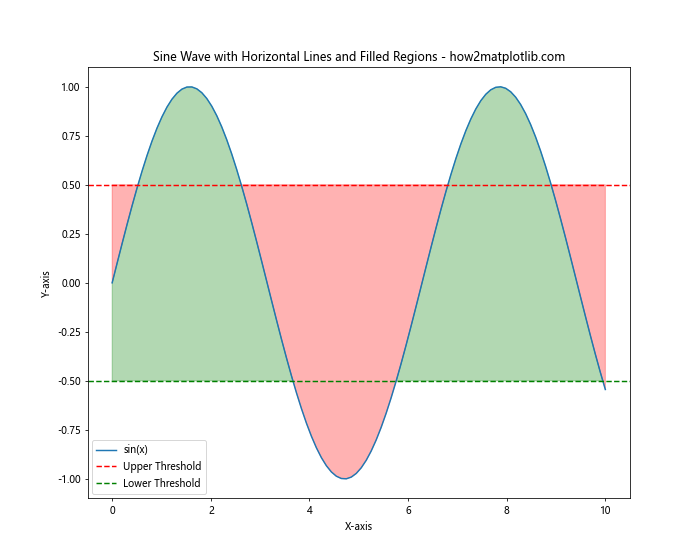
This example demonstrates how to use horizontal lines to define thresholds and fill the regions between these thresholds and a curve.
Combining Horizontal Lines with Annotations
Annotations can be used to provide additional context to horizontal lines:
import matplotlib.pyplot as plt
import numpy as np

fig, ax = plt.subplots(figsize=(10, 8))

x = np.linspace(0, 10, 100)
y = np.sin(x)

ax.plot(x, y, label='sin(x)')

# Add horizontal line
mean_value = np.mean(y)
ax.axhline(y=mean_value, color='red', linestyle='--', label=f'Mean: {mean_value:.2f}')

# Add annotation
ax.annotate('Local Maximum', xy=(np.pi/2, 1), xytext=(np.pi/2, 1.2),
            arrowprops=dict(facecolor='black', shrink=0.05),
            horizontalalignment='center')

ax.set_title('Sine Wave with Horizontal Line and Annotation - how2matplotlib.com')
ax.set_xlabel('X-axis')
ax.set_ylabel('Y-axis')
ax.legend()
plt.show()
Output:
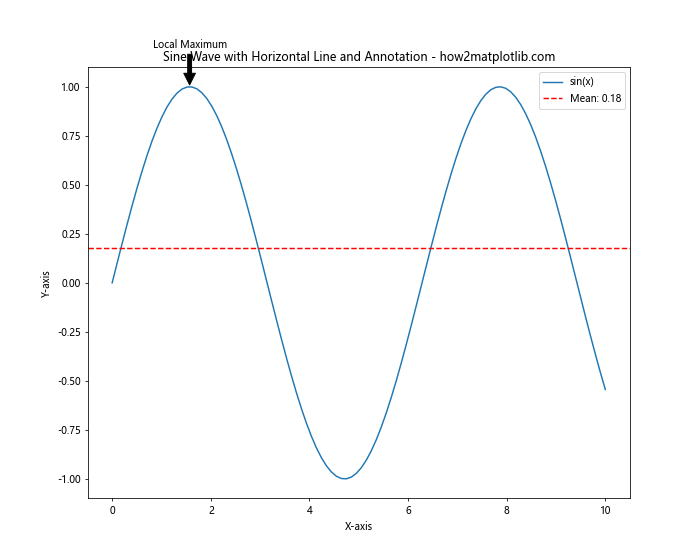
This example shows how to combine a horizontal line representing the mean value with an annotation pointing out a specific feature of the plot.
Conclusion
Plotting a horizontal line in Matplotlib is a versatile and powerful technique that can enhance your data visualizations in numerous ways. From simple reference lines to complex statistical representations, horizontal lines offer a wide range of applications in data analysis and presentation.
Throughout this comprehensive guide, we’ve explored various methods to plot horizontal lines, including:
- Using the
axhline()function for simple, axis-spanning lines - Employing the
plot()function for more flexible line creation - Customizing line properties such as color, style, width, and transparency
- Combining horizontal lines with other plot elements like scatter plots and box plots
- Utilizing horizontal lines in statistical visualizations and advanced chart types
- Animating horizontal lines for dynamic visualizations
- Troubleshooting common issues and following best practices