How to Place Plots Side by Side in Matplotlib
Place plots side by side in Matplotlib is a crucial skill for data visualization enthusiasts and professionals alike. This article will delve deep into the various methods and techniques to place plots side by side in Matplotlib, providing you with a comprehensive understanding of this essential feature. We’ll explore different approaches, from basic to advanced, and provide numerous examples to help you master the art of placing plots side by side in Matplotlib.
Understanding the Basics of Placing Plots Side by Side in Matplotlib
Before we dive into the specifics of how to place plots side by side in Matplotlib, it’s essential to understand why this technique is so valuable. Placing plots side by side allows for easy comparison of different datasets or visualizations, making it an indispensable tool for data analysis and presentation.
To place plots side by side in Matplotlib, we primarily use the subplot() function or its object-oriented equivalent, plt.subplots(). These functions allow us to create a grid of subplots within a single figure, which we can then populate with our desired plots.
Let’s start with a simple example to illustrate how to place plots side by side in Matplotlib:
import matplotlib.pyplot as plt
import numpy as np

# Generate some sample data
x = np.linspace(0, 10, 100)
y1 = np.sin(x)
y2 = np.cos(x)

# Create a figure with two subplots side by side
fig, (ax1, ax2) = plt.subplots(1, 2, figsize=(10, 4))

# Plot the first subplot
ax1.plot(x, y1)
ax1.set_title('Sine Wave - how2matplotlib.com')

# Plot the second subplot
ax2.plot(x, y2)
ax2.set_title('Cosine Wave - how2matplotlib.com')

# Adjust the layout and display the plot
plt.tight_layout()
plt.show()
Output:
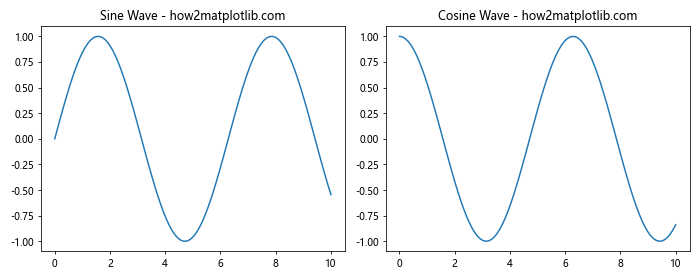
In this example, we use plt.subplots(1, 2) to create a figure with two subplots arranged horizontally. The figsize parameter sets the overall size of the figure. We then plot a sine wave on the first subplot and a cosine wave on the second subplot, effectively placing two plots side by side in Matplotlib.
Advanced Techniques for Placing Plots Side by Side in Matplotlib
While the basic method of using subplots() is sufficient for many cases, there are more advanced techniques to place plots side by side in Matplotlib that offer greater flexibility and control. Let’s explore some of these methods:
Using GridSpec to Place Plots Side by Side in Matplotlib
GridSpec is a powerful tool in Matplotlib that allows for more complex subplot arrangements. It’s particularly useful when you need to place plots side by side in Matplotlib with varying sizes or positions.
Here’s an example of how to use GridSpec to place plots side by side in Matplotlib:
import matplotlib.pyplot as plt
import matplotlib.gridspec as gridspec
import numpy as np

# Generate sample data
x = np.linspace(0, 10, 100)
y1 = np.sin(x)
y2 = np.cos(x)
y3 = np.tan(x)

# Create a figure and GridSpec
fig = plt.figure(figsize=(12, 4))
gs = gridspec.GridSpec(1, 3, width_ratios=[1, 1, 2])

# Create subplots using GridSpec
ax1 = plt.subplot(gs[0])
ax2 = plt.subplot(gs[1])
ax3 = plt.subplot(gs[2])

# Plot data on each subplot
ax1.plot(x, y1)
ax1.set_title('Sine - how2matplotlib.com')

ax2.plot(x, y2)
ax2.set_title('Cosine - how2matplotlib.com')

ax3.plot(x, y3)
ax3.set_title('Tangent - how2matplotlib.com')

# Adjust layout and display the plot
plt.tight_layout()
plt.show()
Output:
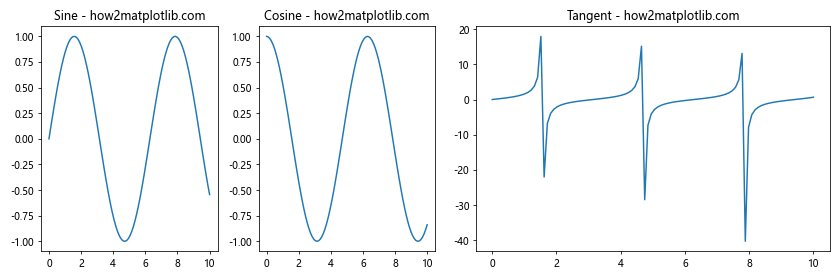
In this example, we use GridSpec to create three subplots side by side, with the third subplot being twice as wide as the others. This demonstrates the flexibility of GridSpec in placing plots side by side in Matplotlib with custom sizing.
Using add_subplot() to Place Plots Side by Side in Matplotlib
Another method to place plots side by side in Matplotlib is by using the add_subplot() function. This approach gives you more control over the placement of individual subplots.
Here’s an example of how to use add_subplot() to place plots side by side in Matplotlib:
import matplotlib.pyplot as plt
import numpy as np

# Generate sample data
x = np.linspace(0, 10, 100)
y1 = np.sin(x)
y2 = np.cos(x)

# Create a figure
fig = plt.figure(figsize=(10, 4))

# Add subplots
ax1 = fig.add_subplot(121)
ax2 = fig.add_subplot(122)

# Plot data on each subplot
ax1.plot(x, y1)
ax1.set_title('Sine Wave - how2matplotlib.com')

ax2.plot(x, y2)
ax2.set_title('Cosine Wave - how2matplotlib.com')

# Adjust layout and display the plot
plt.tight_layout()
plt.show()
Output:
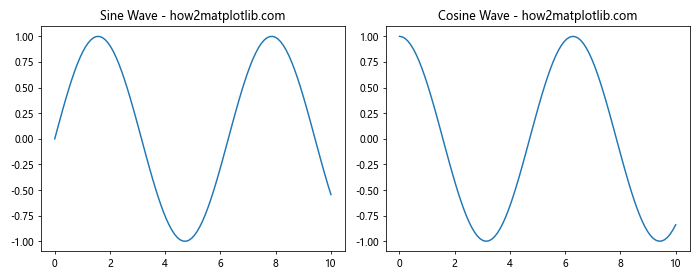
In this example, we use add_subplot() to create two subplots side by side. The arguments 121 and 122 specify the position of each subplot in a 1×2 grid.
Customizing Plots Placed Side by Side in Matplotlib
Now that we’ve covered the basics of how to place plots side by side in Matplotlib, let’s explore some ways to customize these plots for better visualization and presentation.
Adjusting Spacing Between Plots Placed Side by Side in Matplotlib
When you place plots side by side in Matplotlib, you might want to adjust the spacing between them for better visual appeal. This can be achieved using the subplots_adjust() function.
Here’s an example of how to adjust spacing between plots placed side by side in Matplotlib:
import matplotlib.pyplot as plt
import numpy as np

# Generate sample data
x = np.linspace(0, 10, 100)
y1 = np.sin(x)
y2 = np.cos(x)

# Create a figure with two subplots side by side
fig, (ax1, ax2) = plt.subplots(1, 2, figsize=(10, 4))

# Plot data on each subplot
ax1.plot(x, y1)
ax1.set_title('Sine Wave - how2matplotlib.com')

ax2.plot(x, y2)
ax2.set_title('Cosine Wave - how2matplotlib.com')

# Adjust the spacing between subplots
plt.subplots_adjust(wspace=0.5)

# Display the plot
plt.show()
Output:
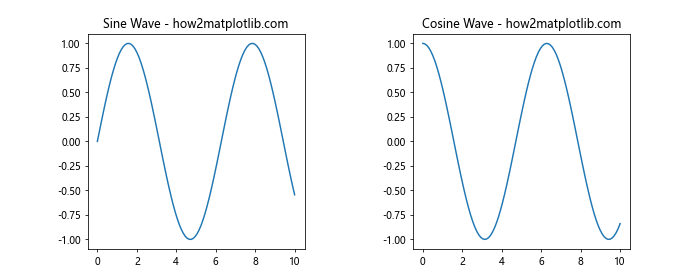
In this example, we use plt.subplots_adjust(wspace=0.5) to increase the horizontal space between the subplots. The wspace parameter controls the width of the spacing between subplots as a fraction of the average subplot width.
Adding a Common Colorbar to Plots Placed Side by Side in Matplotlib
When you place plots side by side in Matplotlib, you might want to add a common colorbar for all the subplots. This is particularly useful when working with heatmaps or other color-coded plots.
Here’s an example of how to add a common colorbar to plots placed side by side in Matplotlib:
import matplotlib.pyplot as plt
import numpy as np

# Generate sample data
data1 = np.random.rand(10, 10)
data2 = np.random.rand(10, 10)

# Create a figure with two subplots side by side
fig, (ax1, ax2) = plt.subplots(1, 2, figsize=(12, 5))

# Plot heatmaps on each subplot
im1 = ax1.imshow(data1, cmap='viridis')
ax1.set_title('Heatmap 1 - how2matplotlib.com')

im2 = ax2.imshow(data2, cmap='viridis')
ax2.set_title('Heatmap 2 - how2matplotlib.com')

# Add a common colorbar
cbar = fig.colorbar(im2, ax=[ax1, ax2], orientation='vertical', fraction=0.046, pad=0.04)
cbar.set_label('Value')

# Adjust layout and display the plot
plt.tight_layout()
plt.show()
Output:
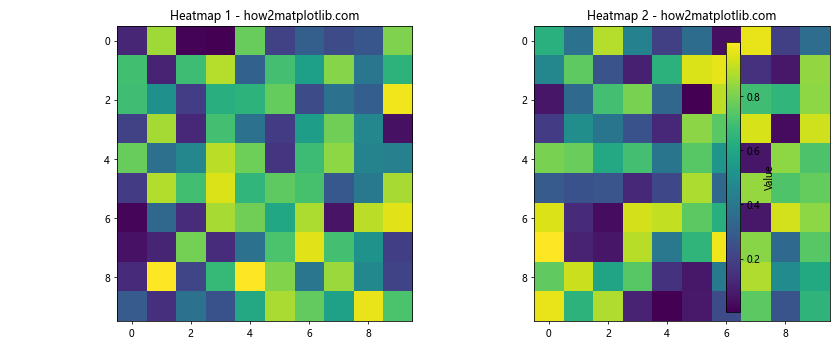
In this example, we create two heatmaps side by side and add a common colorbar using fig.colorbar(). The ax=[ax1, ax2] argument ensures that the colorbar applies to both subplots.
Advanced Layouts for Placing Plots Side by Side in Matplotlib
As you become more proficient in placing plots side by side in Matplotlib, you might want to explore more complex layouts. Let’s look at some advanced techniques for creating intricate arrangements of plots.
Creating a Grid of Plots Side by Side in Matplotlib
Sometimes, you might need to place multiple plots side by side in a grid layout. Matplotlib makes this easy with the subplots() function.
Here’s an example of how to create a grid of plots side by side in Matplotlib:
import matplotlib.pyplot as plt
import numpy as np

# Generate sample data
x = np.linspace(0, 10, 100)
y1 = np.sin(x)
y2 = np.cos(x)
y3 = np.tan(x)
y4 = np.exp(x)

# Create a figure with a 2x2 grid of subplots
fig, axs = plt.subplots(2, 2, figsize=(12, 10))

# Plot data on each subplot
axs[0, 0].plot(x, y1)
axs[0, 0].set_title('Sine - how2matplotlib.com')

axs[0, 1].plot(x, y2)
axs[0, 1].set_title('Cosine - how2matplotlib.com')

axs[1, 0].plot(x, y3)
axs[1, 0].set_title('Tangent - how2matplotlib.com')

axs[1, 1].plot(x, y4)
axs[1, 1].set_title('Exponential - how2matplotlib.com')

# Adjust layout and display the plot
plt.tight_layout()
plt.show()
Output:
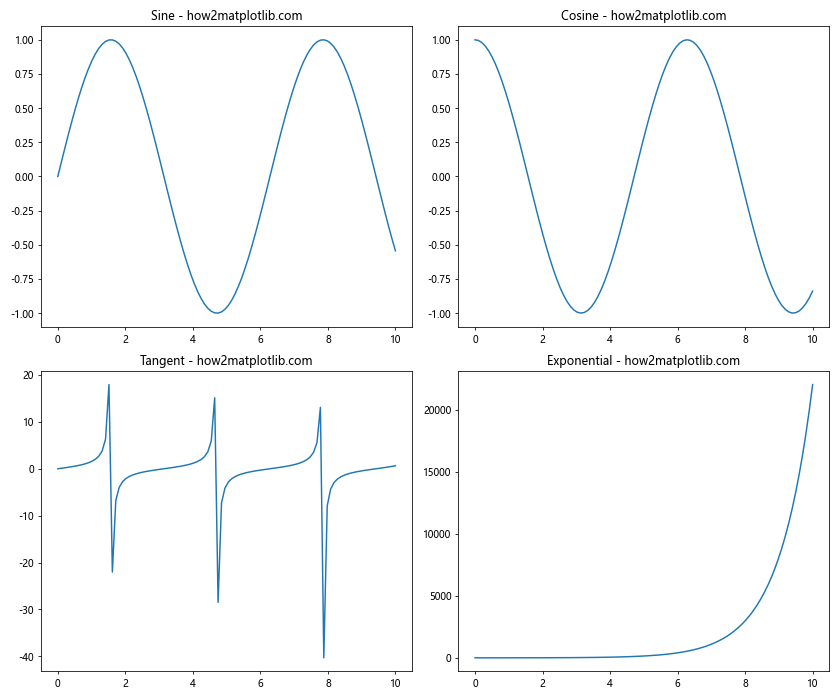
In this example, we create a 2×2 grid of subplots using plt.subplots(2, 2). We then plot different functions on each subplot, effectively placing four plots side by side in a grid layout.
Creating Nested Layouts of Plots Side by Side in Matplotlib
For even more complex arrangements, you can create nested layouts of plots side by side in Matplotlib. This involves creating subplots within subplots.
Here’s an example of how to create nested layouts of plots side by side in Matplotlib:
import matplotlib.pyplot as plt
import numpy as np

# Generate sample data
x = np.linspace(0, 10, 100)
y1 = np.sin(x)
y2 = np.cos(x)
y3 = np.tan(x)
y4 = np.exp(x)

# Create the main figure
fig = plt.figure(figsize=(12, 8))

# Create the first subplot (top left)
ax1 = fig.add_subplot(221)
ax1.plot(x, y1)
ax1.set_title('Sine - how2matplotlib.com')

# Create the second subplot (top right)
ax2 = fig.add_subplot(222)
ax2.plot(x, y2)
ax2.set_title('Cosine - how2matplotlib.com')

# Create a nested subplot layout (bottom)
gs = fig.add_gridspec(2, 2, height_ratios=[1, 1], width_ratios=[1, 1], bottom=0, left=0.1, right=0.9)
ax3 = fig.add_subplot(gs[1, 0])
ax3.plot(x, y3)
ax3.set_title('Tangent - how2matplotlib.com')

ax4 = fig.add_subplot(gs[1, 1])
ax4.plot(x, y4)
ax4.set_title('Exponential - how2matplotlib.com')

# Adjust layout and display the plot
plt.tight_layout()
plt.show()
Output:
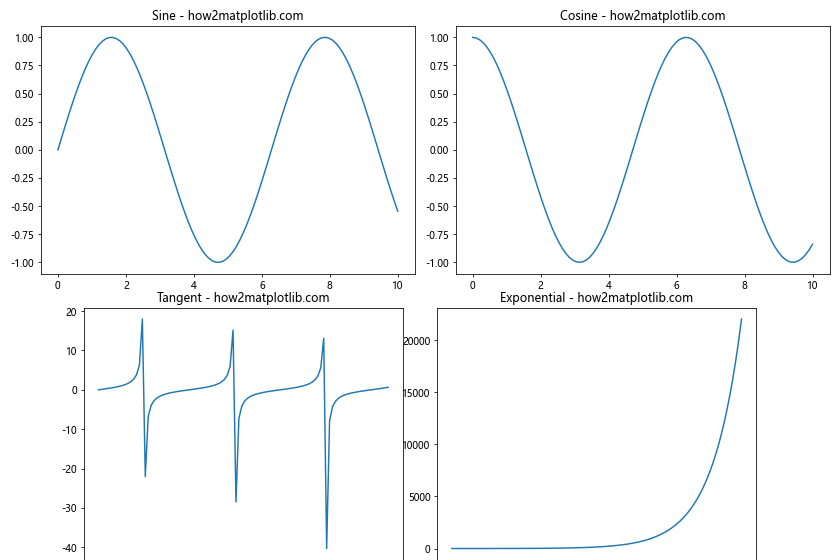
In this example, we create a main figure with two subplots at the top, and then use GridSpec to create a nested layout of two more subplots at the bottom. This demonstrates how you can create complex, nested arrangements when placing plots side by side in Matplotlib.
Best Practices for Placing Plots Side by Side in Matplotlib
As you become more proficient in placing plots side by side in Matplotlib, it’s important to follow some best practices to ensure your visualizations are clear, informative, and visually appealing.
Using Shared Axes When Placing Plots Side by Side in Matplotlib
When you place plots side by side in Matplotlib that share common axes, it’s often beneficial to use shared axes. This can make it easier for viewers to compare data across different subplots.
Here’s an example of how to use shared axes when placing plots side by side in Matplotlib:
import matplotlib.pyplot as plt
import numpy as np

# Generate sample data
x = np.linspace(0, 10, 100)
y1 = np.sin(x)
y2 = np.sin(2*x)

# Create a figure with two subplots side by side, sharing the y-axis
fig, (ax1, ax2) = plt.subplots(1, 2, figsize=(12, 5), sharey=True)

# Plot data on each subplot
ax1.plot(x, y1)
ax1.set_title('Sin(x) - how2matplotlib.com')
ax1.set_xlabel('X-axis')
ax1.set_ylabel('Y-axis')

ax2.plot(x, y2)
ax2.set_title('Sin(2x) - how2matplotlib.com')
ax2.set_xlabel('X-axis')

# Adjust# Adjust layout and display the plot
plt.tight_layout()
plt.show()
Output:
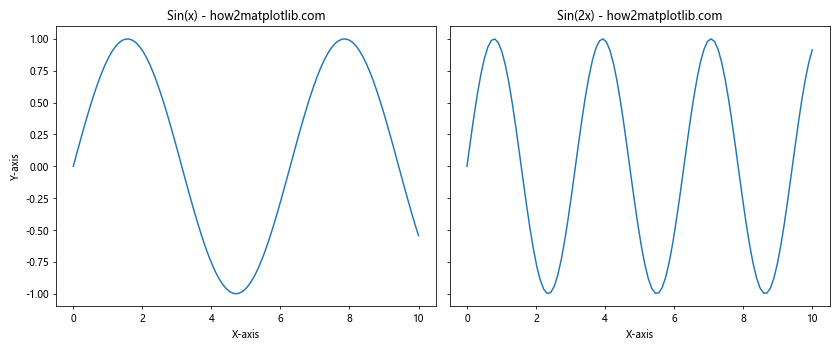
In this example, we use sharey=True when creating the subplots to share the y-axis between them. This means that the y-axis scale will be the same for both plots, making it easier to compare the amplitudes of the two sine waves.
Advanced Techniques for Placing Plots Side by Side in Matplotlib
As you become more proficient in placing plots side by side in Matplotlib, you may want to explore some advanced techniques to create even more sophisticated visualizations.
Using Inset Axes When Placing Plots Side by Side in Matplotlib
Inset axes allow you to place a smaller plot within a larger plot. This can be useful when you want to show a detailed view of a particular region alongside the main plot.
Here’s an example of how to use inset axes when placing plots side by side in Matplotlib:
import matplotlib.pyplot as plt
import numpy as np
from mpl_toolkits.axes_grid1.inset_locator import inset_axes

# Generate sample data
x = np.linspace(0, 10, 1000)
y = np.sin(x) * np.exp(-0.1 * x)

# Create a figure with two subplots side by side
fig, (ax1, ax2) = plt.subplots(1, 2, figsize=(12, 5))

# Plot data on the first subplot
ax1.plot(x, y)
ax1.set_title('Main Plot - how2matplotlib.com')
ax1.set_xlabel('X-axis')
ax1.set_ylabel('Y-axis')

# Create an inset axes
axins = inset_axes(ax1, width="40%", height="30%", loc=1)
axins.plot(x, y)
axins.set_xlim(2, 3)
axins.set_ylim(0.5, 0.8)
ax1.indicate_inset_zoom(axins)

# Plot data on the second subplot
ax2.plot(x, y)
ax2.set_title('Zoomed Region - how2matplotlib.com')
ax2.set_xlim(2, 3)
ax2.set_ylim(0.5, 0.8)

# Adjust layout and display the plot
plt.tight_layout()
plt.show()
Output:
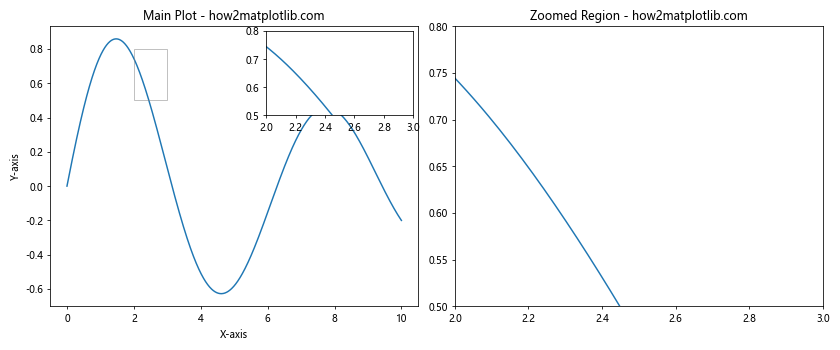
In this example, we create two subplots side by side. The first subplot shows the full data range with an inset axes showing a zoomed-in region. The second subplot shows only the zoomed-in region for a more detailed view.
Creating Subplots with Different Sizes When Placing Plots Side by Side in Matplotlib
Sometimes, you may want to create subplots of different sizes when placing plots side by side in Matplotlib. This can be achieved using GridSpec with specified width and height ratios.
Here’s an example of how to create subplots with different sizes when placing plots side by side in Matplotlib:
import matplotlib.pyplot as plt
import matplotlib.gridspec as gridspec
import numpy as np

# Generate sample data
x = np.linspace(0, 10, 100)
y1 = np.sin(x)
y2 = np.cos(x)
y3 = np.tan(x)

# Create a figure and GridSpec
fig = plt.figure(figsize=(12, 8))
gs = gridspec.GridSpec(2, 2, width_ratios=[2, 1], height_ratios=[1, 2])

# Create subplots using GridSpec
ax1 = fig.add_subplot(gs[0, 0])
ax2 = fig.add_subplot(gs[0, 1])
ax3 = fig.add_subplot(gs[1, :])

# Plot data on each subplot
ax1.plot(x, y1)
ax1.set_title('Sine - how2matplotlib.com')

ax2.plot(x, y2)
ax2.set_title('Cosine - how2matplotlib.com')

ax3.plot(x, y3)
ax3.set_title('Tangent - how2matplotlib.com')

# Adjust layout and display the plot
plt.tight_layout()
plt.show()
Output:
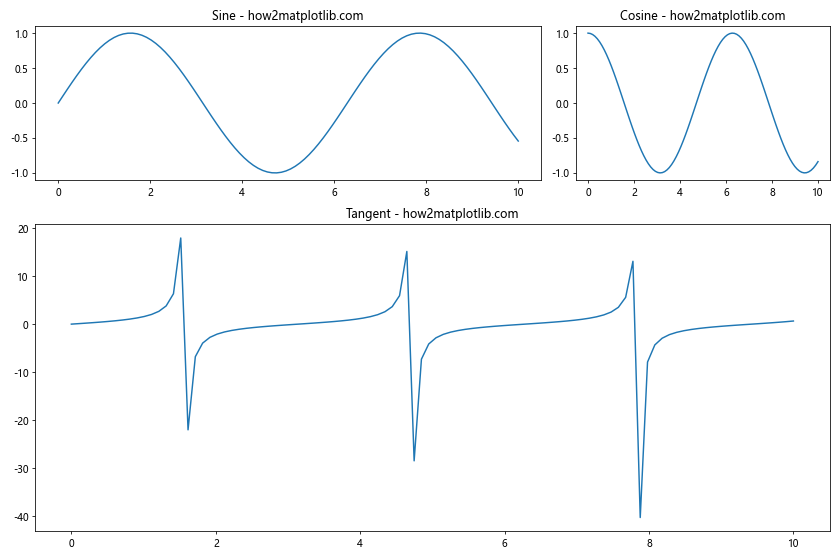
In this example, we use GridSpec to create three subplots of different sizes. The top row has two subplots with a 2:1 width ratio, and the bottom row has a single subplot that spans the full width of the figure.
Handling Large Numbers of Plots Side by Side in Matplotlib
When you need to place a large number of plots side by side in Matplotlib, managing them efficiently becomes crucial. Let’s explore some techniques for handling multiple plots.
Using for Loops to Create Multiple Plots Side by Side in Matplotlib
When you have many similar plots to create, using a for loop can significantly reduce the amount of code you need to write.
Here’s an example of how to use a for loop to create multiple plots side by side in Matplotlib:
import matplotlib.pyplot as plt
import numpy as np

# Generate sample data
x = np.linspace(0, 10, 100)
functions = [np.sin, np.cos, np.tan, np.exp]
titles = ['Sine', 'Cosine', 'Tangent', 'Exponential']

# Create a figure with subplots
fig, axs = plt.subplots(2, 2, figsize=(12, 10))

# Flatten the 2D array of axes for easier iteration
axs = axs.flatten()

# Plot data on each subplot
for i, (func, title) in enumerate(zip(functions, titles)):
    axs[i].plot(x, func(x))
    axs[i].set_title(f'{title} - how2matplotlib.com')
    axs[i].set_xlabel('X-axis')
    axs[i].set_ylabel('Y-axis')

# Adjust layout and display the plot
plt.tight_layout()
plt.show()
Output:
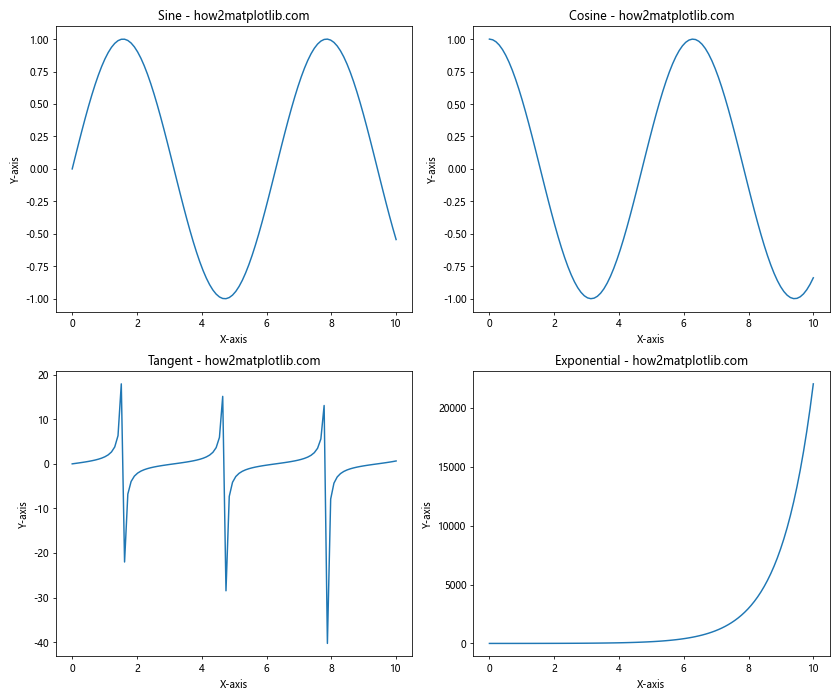
In this example, we use a for loop to iterate over a list of functions and titles, creating a subplot for each one. This approach is much more concise and easier to maintain than creating each subplot individually.
Conclusion
Placing plots side by side in Matplotlib is a powerful technique that allows for easy comparison of different datasets or visualizations. Throughout this article, we’ve explored various methods to achieve this, from basic techniques using subplots() to more advanced approaches using GridSpec and custom functions.
We’ve covered how to place plots side by side in Matplotlib using different layouts, how to customize the appearance of side-by-side plots, and how to handle large numbers of plots efficiently. We’ve also discussed best practices for creating clear and informative visualizations when placing plots side by side in Matplotlib.