Comprehensive Guide to Matplotlib.axis.Axis.get_path_effects() Function in Python
Matplotlib.axis.Axis.get_path_effects() function in Python is a powerful tool for retrieving the path effects applied to an axis in Matplotlib. This function is an essential part of the Matplotlib library, which is widely used for creating static, animated, and interactive visualizations in Python. In this comprehensive guide, we’ll explore the Matplotlib.axis.Axis.get_path_effects() function in detail, covering its usage, parameters, return values, and practical applications in various scenarios.
Understanding Matplotlib.axis.Axis.get_path_effects() Function
The Matplotlib.axis.Axis.get_path_effects() function is a method of the Axis class in Matplotlib. It allows users to retrieve the list of path effects currently applied to an axis. Path effects are visual enhancements that can be added to the axis lines, ticks, and labels to improve their appearance or visibility.
Let’s start with a simple example to demonstrate how to use the Matplotlib.axis.Axis.get_path_effects() function:
import matplotlib.pyplot as plt
import matplotlib.patheffects as path_effects

# Create a figure and axis
fig, ax = plt.subplots()

# Add a title to the plot
ax.set_title("How2matplotlib.com: Axis Path Effects Example")

# Apply path effects to the x-axis
ax.xaxis.set_path_effects([path_effects.withStroke(linewidth=3, foreground='red')])

# Get the path effects applied to the x-axis
x_axis_effects = ax.xaxis.get_path_effects()

print("Path effects applied to x-axis:", x_axis_effects)

plt.show()
Output:
In this example, we create a simple plot and apply a path effect to the x-axis using the set_path_effects() method. Then, we use the get_path_effects() function to retrieve the list of path effects applied to the x-axis.
Exploring the Parameters of Matplotlib.axis.Axis.get_path_effects()
The Matplotlib.axis.Axis.get_path_effects() function doesn’t take any parameters. It’s a simple getter method that returns the current path effects applied to the axis.
Here’s an example demonstrating this:
import matplotlib.pyplot as plt
import matplotlib.patheffects as path_effects

# Create a figure and axis
fig, ax = plt.subplots()

# Set title
ax.set_title("How2matplotlib.com: No Parameters Example")

# Apply path effects to both x and y axes
ax.xaxis.set_path_effects([path_effects.withStroke(linewidth=2, foreground='blue')])
ax.yaxis.set_path_effects([path_effects.withStroke(linewidth=2, foreground='green')])

# Get path effects for both axes
x_effects = ax.xaxis.get_path_effects()
y_effects = ax.yaxis.get_path_effects()

print("X-axis path effects:", x_effects)
print("Y-axis path effects:", y_effects)

plt.show()
Output:
In this example, we apply different path effects to both the x and y axes, and then use the get_path_effects() function to retrieve them without passing any parameters.
Return Value of Matplotlib.axis.Axis.get_path_effects()
The Matplotlib.axis.Axis.get_path_effects() function returns a list of AbstractPathEffect objects. These objects represent the path effects applied to the axis. If no path effects have been applied, the function returns an empty list.
Let’s look at an example that demonstrates the return value:
import matplotlib.pyplot as plt
import matplotlib.patheffects as path_effects

# Create a figure and axis
fig, ax = plt.subplots()

# Set title
ax.set_title("How2matplotlib.com: Return Value Example")

# Apply multiple path effects to the x-axis
ax.xaxis.set_path_effects([
    path_effects.withStroke(linewidth=3, foreground='red'),
    path_effects.Normal(),
    path_effects.Stroke(linewidth=5, foreground='blue')
])

# Get the path effects
effects = ax.xaxis.get_path_effects()

print("Number of path effects:", len(effects))
for i, effect in enumerate(effects):
    print(f"Effect {i + 1}: {type(effect).__name__}")

plt.show()
Output:
In this example, we apply multiple path effects to the x-axis and then use get_path_effects() to retrieve them. We print the number of effects and the type of each effect to demonstrate the return value.
Practical Applications of Matplotlib.axis.Axis.get_path_effects()
The Matplotlib.axis.Axis.get_path_effects() function is particularly useful when you need to inspect or modify existing path effects on an axis. Here are some practical applications:
1. Checking for Existing Path Effects
Before applying new path effects, you might want to check if any effects are already applied:
import matplotlib.pyplot as plt
import matplotlib.patheffects as path_effects

# Create a figure and axis
fig, ax = plt.subplots()

# Set title
ax.set_title("How2matplotlib.com: Checking Existing Effects")

# Check for existing path effects
existing_effects = ax.xaxis.get_path_effects()

if not existing_effects:
    print("No existing path effects. Applying new effect.")
    ax.xaxis.set_path_effects([path_effects.withStroke(linewidth=2, foreground='red')])
else:
    print("Existing path effects found:", existing_effects)

plt.show()
Output:
This example checks if there are any existing path effects before applying a new one.
2. Modifying Existing Path Effects
You can retrieve existing path effects, modify them, and then reapply them:
import matplotlib.pyplot as plt
import matplotlib.patheffects as path_effects

# Create a figure and axis
fig, ax = plt.subplots()

# Set title
ax.set_title("How2matplotlib.com: Modifying Existing Effects")

# Apply initial path effect
ax.xaxis.set_path_effects([path_effects.withStroke(linewidth=2, foreground='red')])

# Get existing effects
existing_effects = ax.xaxis.get_path_effects()

# Modify the existing effect
if existing_effects:
    existing_effects[0].set_linewidth(4)
    existing_effects[0].set_foreground('blue')

# Reapply the modified effects
ax.xaxis.set_path_effects(existing_effects)

plt.show()
In this example, we retrieve the existing path effect, modify its properties, and then reapply it to the axis.
3. Combining Path Effects
You can use get_path_effects() to retrieve existing effects and combine them with new ones:
import matplotlib.pyplot as plt
import matplotlib.patheffects as path_effects

# Create a figure and axis
fig, ax = plt.subplots()

# Set title
ax.set_title("How2matplotlib.com: Combining Path Effects")

# Apply initial path effect
ax.xaxis.set_path_effects([path_effects.withStroke(linewidth=2, foreground='red')])

# Get existing effects
existing_effects = ax.xaxis.get_path_effects()

# Combine with new effects
new_effects = existing_effects + [path_effects.withStroke(linewidth=4, foreground='blue')]

# Apply combined effects
ax.xaxis.set_path_effects(new_effects)

plt.show()
Output:
This example demonstrates how to combine existing path effects with new ones.
Advanced Usage of Matplotlib.axis.Axis.get_path_effects()
Let’s explore some advanced usage scenarios of the Matplotlib.axis.Axis.get_path_effects() function:
1. Applying Different Effects to Major and Minor Ticks
You can use get_path_effects() to apply different effects to major and minor ticks:
import matplotlib.pyplot as plt
import matplotlib.patheffects as path_effects

# Create a figure and axis
fig, ax = plt.subplots()

# Set title
ax.set_title("How2matplotlib.com: Major and Minor Tick Effects")

# Set major and minor ticks
ax.xaxis.set_major_locator(plt.MultipleLocator(1))
ax.xaxis.set_minor_locator(plt.MultipleLocator(0.2))

# Apply effects to major ticks
ax.xaxis.set_path_effects([path_effects.withStroke(linewidth=3, foreground='red')])

# Get effects for major ticks
major_effects = ax.xaxis.get_path_effects()

# Apply different effects to minor ticks
ax.xaxis.set_minor_formatter(plt.NullFormatter())  # Hide minor tick labels
ax.xaxis.set_tick_params(which='minor', length=4, color='blue')
ax.xaxis.set_path_effects(major_effects + [path_effects.withStroke(linewidth=1, foreground='blue')])

plt.show()
Output:
This example applies different path effects to major and minor ticks on the x-axis.
2. Creating Custom Path Effects
You can create custom path effects and use get_path_effects() to combine them with built-in effects:
import matplotlib.pyplot as plt
import matplotlib.patheffects as path_effects

class CustomPathEffect(path_effects.AbstractPathEffect):
    def __init__(self, offset=(0, 0), alpha=0.5):
        self._offset = offset
        self._alpha = alpha

    def draw_path(self, renderer, gc, tpath, affine, rgbFace):
        gc.set_alpha(self._alpha)
        affine = affine.translate(self._offset[0], self._offset[1])
        renderer.draw_path(gc, tpath, affine, rgbFace)

# Create a figure and axis
fig, ax = plt.subplots()

# Set title
ax.set_title("How2matplotlib.com: Custom Path Effect")

# Apply custom path effect
custom_effect = CustomPathEffect(offset=(2, 2), alpha=0.7)
ax.xaxis.set_path_effects([custom_effect])

# Get existing effects and combine with built-in effect
existing_effects = ax.xaxis.get_path_effects()
combined_effects = existing_effects + [path_effects.withStroke(linewidth=2, foreground='red')]

# Apply combined effects
ax.xaxis.set_path_effects(combined_effects)

plt.show()
Output:
This example creates a custom path effect and combines it with a built-in effect using get_path_effects().
Common Pitfalls and Best Practices
When working with the Matplotlib.axis.Axis.get_path_effects() function, there are some common pitfalls to avoid and best practices to follow:
Checking for Empty Effects
Always check if the returned list of effects is empty before trying to access or modify them:
import matplotlib.pyplot as plt
import matplotlib.patheffects as path_effects

# Create a figure and axis
fig, ax = plt.subplots()

# Set title
ax.set_title("How2matplotlib.com: Checking for Empty Effects")

# Get effects (which will be empty initially)
effects = ax.xaxis.get_path_effects()

if effects:
    print("Effects found:", effects)
    effects[0].set_foreground('blue')  # This won't raise an error
else:
    print("No effects found. Applying new effect.")
    ax.xaxis.set_path_effects([path_effects.withStroke(linewidth=2, foreground='red')])

plt.show()
Output:
This example checks if there are any effects before trying to modify them, avoiding potential errors.
Integrating Matplotlib.axis.Axis.get_path_effects() with Other Matplotlib Features
The Matplotlib.axis.Axis.get_path_effects() function can be integrated with other Matplotlib features to create more complex and informative visualizations. Let’s explore some examples:
1. Combining with Text Annotations
You can use get_path_effects() to apply consistent effects to both axes and text annotations:
import matplotlib.pyplot as plt
import matplotlib.patheffects as path_effects

# Create a figure and axis
fig, ax = plt.subplots()

# Set title
ax.set_title("How2matplotlib.com: Consistent Effects")

# Apply path effect to x-axis
ax.xaxis.set_path_effects([path_effects.withStroke(linewidth=2, foreground='red')])

# Get the path effects
effects = ax.xaxis.get_path_effects()

# Add text annotation with the same effects
ax.text(0.5, 0.5, "How2matplotlib.com", ha='center', va='center', path_effects=effects)

plt.show()
Output:
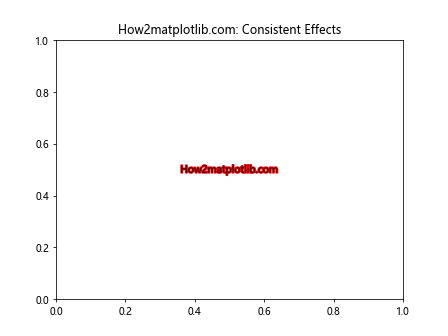
This example applies the same path effects to both the x-axis and a text annotation.
2. Dynamic Effect Changes Based on Data
You can use get_path_effects() to dynamically change effects based on data values:
import matplotlib.pyplot as plt
import matplotlib.path```python
import matplotlib.pyplot as plt
import matplotlib.patheffects as path_effects
import numpy as np

# Create a figure and axis
fig, ax = plt.subplots()

# Set title
ax.set_title("How2matplotlib.com: Dynamic Effects")

# Generate some data
x = np.linspace(0, 10, 100)
y = np.sin(x)

# Plot the data
line, = ax.plot(x, y)

# Apply initial path effect
line.set_path_effects([path_effects.withStroke(linewidth=2, foreground='red')])

# Function to update effects based on y values
def update_effects(line):
    y_data = line.get_ydata()
    effects = line.get_path_effects()

    if np.mean(y_data) > 0:
        effects[0].set_foreground('red')
    else:
        effects[0].set_foreground('blue')

    line.set_path_effects(effects)

# Call the update function
update_effects(line)

plt.show()
This example demonstrates how to dynamically change path effects based on the data values.
3. Combining with Custom Tick Formatters
You can use get_path_effects() in combination with custom tick formatters:
import matplotlib.pyplot as plt
import matplotlib.patheffects as path_effects
import matplotlib.ticker as ticker

# Create a figure and axis
fig, ax = plt.subplots()

# Set title
ax.set_title("How2matplotlib.com: Custom Tick Formatter")

# Apply path effect to x-axis
ax.xaxis.set_path_effects([path_effects.withStroke(linewidth=2, foreground='red')])

# Get the path effects
effects = ax.xaxis.get_path_effects()

# Custom tick formatter
def custom_formatter(x, pos):
    return f"Value: {x:.2f}"

# Apply custom formatter and path effects to tick labels
ax.xaxis.set_major_formatter(ticker.FuncFormatter(custom_formatter))
for label in ax.xaxis.get_ticklabels():
    label.set_path_effects(effects)

plt.show()
Output:
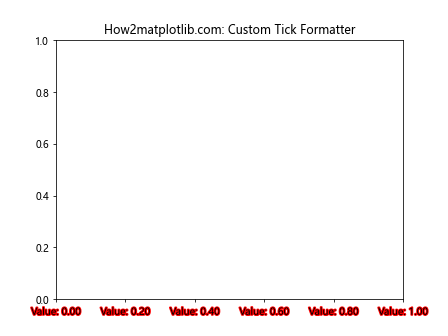
This example combines custom tick formatters with path effects retrieved using get_path_effects().
Conclusion
The Matplotlib.axis.Axis.get_path_effects() function is a powerful tool for retrieving and manipulating path effects applied to axes in Matplotlib. Throughout this comprehensive guide, we’ve explored its usage, parameters, return values, and practical applications in various scenarios.