Comprehensive Guide to Matplotlib.axis.Axis.get_rasterized() Function in Python

Comprehensive Guide to Matplotlib.axis.Axis.get_rasterized() Function in Python

Matplotlib.axis.Axis.get_rasterized() function in Python is an essential tool for managing the rasterization of axis elements in Matplotlib plots. This function allows developers to determine whether an axis is set to be rasterized or not, providing crucial information for optimizing plot rendering and file size. In this comprehensive guide, we’ll explore the Matplotlib.axis.Axis.get_rasterized() function in depth, covering its usage, benefits, and practical applications in various scenarios.

Understanding Matplotlib.axis.Axis.get_rasterized() Function

The Matplotlib.axis.Axis.get_rasterized() function is a method of the Axis class in Matplotlib. It returns a boolean value indicating whether the axis is set to be rasterized. Rasterization is the process of converting vector graphics into a bitmap image, which can be beneficial for reducing file size and improving rendering performance in certain situations.

Let’s start with a simple example to demonstrate how to use the Matplotlib.axis.Axis.get_rasterized() function:

import matplotlib.pyplot as plt

# Create a figure and axis
fig, ax = plt.subplots()

# Plot some data
ax.plot([1, 2, 3, 4], [1, 4, 2, 3], label='Data from how2matplotlib.com')

# Check if the x-axis is rasterized
is_rasterized = ax.xaxis.get_rasterized()

print(f"Is x-axis rasterized? {is_rasterized}")

plt.title("Matplotlib.axis.Axis.get_rasterized() Example")
plt.legend()
plt.show()

Output:
Comprehensive Guide to Matplotlib.axis.Axis.get_rasterized() Function in Python

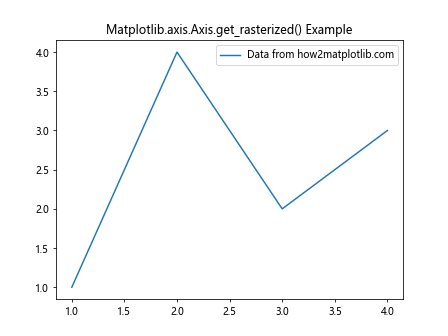
In this example, we create a simple plot and use the get_rasterized() function to check if the x-axis is rasterized. By default, axes are not rasterized, so the function will return False.

Benefits of Using Matplotlib.axis.Axis.get_rasterized() Function

The Matplotlib.axis.Axis.get_rasterized() function offers several benefits for developers working with Matplotlib:

  1. Performance optimization: By checking the rasterization status, you can make informed decisions about whether to rasterize certain elements to improve rendering performance.

  2. File size management: Rasterization can help reduce file size, especially for complex plots with many vector elements.

  3. Quality control: Knowing whether an axis is rasterized allows you to ensure the desired output quality, especially when working with high-resolution displays or print media.

  4. Debugging: The function can be useful for debugging issues related to plot appearance or export quality.

Let’s explore an example that demonstrates how to use the get_rasterized() function in combination with setting rasterization:

import matplotlib.pyplot as plt
import numpy as np

# Create a figure and axis
fig, ax = plt.subplots()

# Generate some data
x = np.linspace(0, 10, 1000)
y = np.sin(x)

# Plot the data with rasterization
ax.plot(x, y, rasterized=True, label='Rasterized data from how2matplotlib.com')

# Check if the y-axis is rasterized
is_rasterized = ax.yaxis.get_rasterized()

print(f"Is y-axis rasterized? {is_rasterized}")

plt.title("Rasterized Plot Example")
plt.legend()
plt.show()

Output:

Comprehensive Guide to Matplotlib.axis.Axis.get_rasterized() Function in Python

In this example, we plot a sine wave and set the rasterized parameter to True. However, it’s important to note that the get_rasterized() function still returns False for the y-axis because rasterization is applied to the plot content, not the axis itself.

Practical Applications of Matplotlib.axis.Axis.get_rasterized() Function

The Matplotlib.axis.Axis.get_rasterized() function can be particularly useful in various scenarios:

  1. Creating hybrid vector-raster plots
  2. Optimizing plots for web display
  3. Managing file size for large datasets
  4. Ensuring consistent appearance across different output formats

Let’s explore some practical examples to illustrate these applications.

Creating Hybrid Vector-Raster Plots

In some cases, you may want to create plots that combine both vector and raster elements. The get_rasterized() function can help you verify which elements are rasterized:

import matplotlib.pyplot as plt
import numpy as np

# Create a figure and axis
fig, ax = plt.subplots()

# Generate some data
x = np.linspace(0, 10, 1000)
y1 = np.sin(x)
y2 = np.cos(x)

# Plot rasterized and non-rasterized data
ax.plot(x, y1, rasterized=True, label='Rasterized sine from how2matplotlib.com')
ax.plot(x, y2, rasterized=False, label='Vector cosine from how2matplotlib.com')

# Check rasterization status
is_rasterized_x = ax.xaxis.get_rasterized()
is_rasterized_y = ax.yaxis.get_rasterized()

print(f"Is x-axis rasterized? {is_rasterized_x}")
print(f"Is y-axis rasterized? {is_rasterized_y}")

plt.title("Hybrid Vector-Raster Plot")
plt.legend()
plt.show()

Output:

Comprehensive Guide to Matplotlib.axis.Axis.get_rasterized() Function in Python

In this example, we create a plot with both rasterized and non-rasterized elements. The get_rasterized() function helps us confirm that the axes themselves are not rasterized, even though some plot elements are.

Optimizing Plots for Web Display

When creating plots for web display, rasterization can help reduce file size and improve loading times. Here’s an example of how to use get_rasterized() to check the rasterization status when optimizing for web:

import matplotlib.pyplot as plt
import numpy as np

# Create a figure and axis
fig, ax = plt.subplots(figsize=(8, 6), dpi=100)

# Generate some data
x = np.linspace(0, 10, 5000)
y = np.sin(x) * np.exp(-x/10)

# Plot the data with rasterization
ax.plot(x, y, rasterized=True, linewidth=2, label='Data from how2matplotlib.com')

# Check rasterization status
is_rasterized = ax.xaxis.get_rasterized()

print(f"Is x-axis rasterized? {is_rasterized}")

plt.title("Web-Optimized Plot")
plt.legend()

# Save the plot as a PNG file
plt.savefig('web_optimized_plot.png', dpi=72, bbox_inches='tight')
plt.show()

Output:

Comprehensive Guide to Matplotlib.axis.Axis.get_rasterized() Function in Python

In this example, we create a plot optimized for web display by using rasterization and appropriate DPI settings. The get_rasterized() function helps us confirm that the axis itself is not rasterized, even though the plot content is.

Managing File Size for Large Datasets

When working with large datasets, rasterization can significantly reduce file size. Here’s an example of how to use get_rasterized() in conjunction with file size management:

import matplotlib.pyplot as plt
import numpy as np

# Create a figure and axis
fig, (ax1, ax2) = plt.subplots(1, 2, figsize=(12, 6))

# Generate a large dataset
x = np.linspace(0, 10, 100000)
y = np.sin(x) + np.random.normal(0, 0.1, 100000)

# Plot without rasterization
ax1.plot(x, y, linewidth=0.5, label='Non-rasterized from how2matplotlib.com')
ax1.set_title("Non-Rasterized Plot")

# Plot with rasterization
ax2.plot(x, y, linewidth=0.5, rasterized=True, label='Rasterized from how2matplotlib.com')
ax2.set_title("Rasterized Plot")

# Check rasterization status
is_rasterized_1 = ax1.xaxis.get_rasterized()
is_rasterized_2 = ax2.xaxis.get_rasterized()

print(f"Is ax1 x-axis rasterized? {is_rasterized_1}")
print(f"Is ax2 x-axis rasterized? {is_rasterized_2}")

plt.tight_layout()

# Save both plots
plt.savefig('large_dataset_comparison.pdf')
plt.show()

Output:

Comprehensive Guide to Matplotlib.axis.Axis.get_rasterized() Function in Python

In this example, we create two plots of a large dataset, one with rasterization and one without. The get_rasterized() function helps us confirm the rasterization status of each axis.

Ensuring Consistent Appearance Across Output Formats

The Matplotlib.axis.Axis.get_rasterized() function can be useful when trying to ensure consistent appearance across different output formats. Here’s an example:

import matplotlib.pyplot as plt
import numpy as np

# Create a figure and axis
fig, ax = plt.subplots(figsize=(8, 6))

# Generate some data
x = np.linspace(0, 10, 1000)
y = np.sin(x) * np.exp(-x/5)

# Plot the data
ax.plot(x, y, label='Data from how2matplotlib.com')

# Add a text annotation
ax.text(5, 0.5, 'Important Note', fontsize=12, bbox=dict(facecolor='white', edgecolor='black', boxstyle='round'))

# Check rasterization status
is_rasterized = ax.xaxis.get_rasterized()

print(f"Is x-axis rasterized? {is_rasterized}")

plt.title("Consistent Appearance Example")
plt.legend()

# Save the plot in different formats
plt.savefig('plot_vector.pdf')
plt.savefig('plot_raster.png', dpi=300)
plt.show()

Output:

Comprehensive Guide to Matplotlib.axis.Axis.get_rasterized() Function in Python

In this example, we create a plot with both vector and raster elements and save it in different formats. The get_rasterized() function helps us confirm that the axis is not rasterized, ensuring consistent appearance across formats.

Advanced Usage of Matplotlib.axis.Axis.get_rasterized() Function

While the basic usage of the Matplotlib.axis.Axis.get_rasterized() function is straightforward, there are some advanced techniques and considerations to keep in mind:

Combining get_rasterized() with set_rasterized()

You can use the get_rasterized() function in combination with set_rasterized() to dynamically control rasterization:

import matplotlib.pyplot as plt
import numpy as np

# Create a figure and axis
fig, ax = plt.subplots()

# Generate some data
x = np.linspace(0, 10, 1000)
y = np.sin(x)

# Plot the data
line, = ax.plot(x, y, label='Data from how2matplotlib.com')

# Check initial rasterization status
print(f"Initial rasterization: {ax.xaxis.get_rasterized()}")

# Set rasterization
ax.xaxis.set_rasterized(True)

# Check updated rasterization status
print(f"Updated rasterization: {ax.xaxis.get_rasterized()}")

plt.title("Dynamic Rasterization Control")
plt.legend()
plt.show()

Output:

Comprehensive Guide to Matplotlib.axis.Axis.get_rasterized() Function in Python

In this example, we use get_rasterized() to check the initial status, then use set_rasterized() to change it, and finally use get_rasterized() again to confirm the change.

Handling Rasterization in Subplots

When working with subplots, it’s important to remember that each subplot has its own axes. Here’s an example of how to use get_rasterized() with subplots:

import matplotlib.pyplot as plt
import numpy as np

# Create a figure with subplots
fig, (ax1, ax2) = plt.subplots(1, 2, figsize=(12, 6))

# Generate some data
x = np.linspace(0, 10, 1000)
y1 = np.sin(x)
y2 = np.cos(x)

# Plot data on both subplots
ax1.plot(x, y1, label='Sine from how2matplotlib.com')
ax2.plot(x, y2, label='Cosine from how2matplotlib.com', rasterized=True)

# Check rasterization status for both subplots
print(f"Subplot 1 x-axis rasterized: {ax1.xaxis.get_rasterized()}")
print(f"Subplot 2 x-axis rasterized: {ax2.xaxis.get_rasterized()}")

ax1.set_title("Non-Rasterized Subplot")
ax2.set_title("Rasterized Subplot")

plt.tight_layout()
plt.show()

Output:

Comprehensive Guide to Matplotlib.axis.Axis.get_rasterized() Function in Python

In this example, we create two subplots and use get_rasterized() to check the rasterization status of each subplot’s x-axis.

Common Pitfalls and How to Avoid Them

When working with the Matplotlib.axis.Axis.get_rasterized() function, there are some common pitfalls to be aware of:

  1. Misunderstanding the scope of rasterization
  2. Ignoring the impact on interactivity
  3. Overlooking the effect on text and annotations
  4. Forgetting to check rasterization status before saving

Let’s explore these pitfalls and how to avoid them:

Misunderstanding the Scope of Rasterization

It’s important to remember that the get_rasterized() function applies to the axis itself, not necessarily to the plot content. Here’s an example to illustrate this:

import matplotlib.pyplot as plt
import numpy as np

# Create a figure and axis
fig, ax = plt.subplots()

# Generate some data
x = np.linspace(0, 10, 1000)
y = np.sin(x)

# Plot the data with rasterization
ax.plot(x, y, rasterized=True, label='Data from how2matplotlib.com')

# Check rasterization status
is_axis_rasterized = ax.xaxis.get_rasterized()
is_line_rasterized = ax.lines[0].get_rasterized()

print(f"Is axis rasterized? {is_axis_rasterized}")
print(f"Is line rasterized? {is_line_rasterized}")

plt.title("Rasterization Scope Example")
plt.legend()
plt.show()

Output:

Comprehensive Guide to Matplotlib.axis.Axis.get_rasterized() Function in Python

This example shows that while the line plot is rasterized, the axis itself is not.

Ignoring the Impact on Interactivity

Rasterization can affect the interactivity of your plots. Here’s an example that demonstrates this:

import matplotlib.pyplot as plt
import numpy as np

# Create a figure and axis
fig, (ax1, ax2) = plt.subplots(1, 2, figsize=(12, 6))

# Generate some data
x = np.linspace(0, 10, 1000)
y = np.sin(x)

# Plot without rasterization
line1, = ax1.plot(x, y, label='Interactive from how2matplotlib.com')
ax1.set_title("Non-Rasterized (Interactive)")

# Plot with rasterization
line2, = ax2.plot(x, y, rasterized=True, label='Non-interactive from how2matplotlib.com')
ax2.set_title("Rasterized (Non-Interactive)")

# Add interactivity
ax1.legend()
ax2.legend()

def on_hover(event):
    if event.inaxes == ax1:
        line1.set_linewidth(2)
    else:
        line1.set_linewidth(1)
    fig.canvas.draw_idle()

fig.canvas.mpl_connect('motion_notify_event', on_hover)

plt.tight_layout()
plt.show()

Output:

Comprehensive Guide to Matplotlib.axis.Axis.get_rasterized() Function in Python

In this example, the non-rasterized plot remains interactive, while the rasterized plot does not respond to hover events.

Overlooking the Effect on Text and Annotations

Rasterization can affect the quality of text and annotations in your plots. Here’s an example to illustrate this:

import matplotlib.pyplot as plt
import numpy as np

# Create a figure and axis
fig, (ax1, ax2) = plt.subplots(1, 2, figsize=(12, 6))

# Generate some data
x = np.linspace(0, 10, 1000)
y = np.sin(x)

# Plot without rasterization
ax1.plot(x, y, label='Data from how2matplotlib.com')
ax1.set_title("Non-Rasterized")
ax1.text(5, 0.5, 'High-quality text', fontsize=12)

# Plot with rasterization
ax2.plot(x, y, rasterized=True, label='Data from how2matplotlib.com')
ax2.set_title("Rasterized")
ax2.text(5, 0.5, 'Rasterized text', fontsize=12)

ax1.legend()
ax2.legend()

plt.tight_layout()
plt.savefig('text_quality_comparison.png', dpi=300)
plt.show()

Output:

Comprehensive Guide to Matplotlib.axis.Axis.get_rasterized() Function in Python

In this example, the text in the rasterized plot may appear less sharp when zoomed in or printed at high resolution.

Forgetting to Check Rasterization Status Before Saving

It’s important to verify the rasterization status before saving your plots, especially when working with different file formats. Here’s an example:

import matplotlib.pyplot as plt
import numpy as np

# Create a figure and axis
fig, ax = plt.subplots()

# Generate some data
x = np.linspace(0, 10, 1000)
y = np.sin(x)

# Plot the data
ax.plot(x, y, label='Data from how2matplotlib.com')

# Check rasterization status
is_rasterized = ax.xaxis.get_rasterized()

print(f"Is axis rasterized? {is_rasterized}")

plt.title("Rasterization Check Before Saving")
plt.legend()

# Save in different formats
plt.savefig('plot_vector.pdf')
plt.savefig('plot_raster.png', dpi=300)

if not is_rasterized:
    print("Warning: Plot is not rasterized. Vector formats may result in large file sizes.")

plt.show()

Output:

Comprehensive Guide to Matplotlib.axis.Axis.get_rasterized() Function in Python

This example demonstrates how to check the rasterization status before saving and provide warnings if necessary.

Conclusion

The Matplotlib.axis.Axis.get_rasterized() function is a powerful tool for managing and optimizing plots in Python. By understanding its usage, benefits, and potential pitfalls, you can create more efficient and effective visualizations. Remember to always verify the rasterization status, consider the implications for different output formats, and be aware of the scope of rasterization when working with complex plots.

Like(0)