Comprehensive Guide to Matplotlib.axis.Axis.get_sketch_params() Function in Python
Matplotlib.axis.Axis.get_sketch_params() function in Python is an essential tool for retrieving sketch parameters of an Axis object in Matplotlib. This function is part of the Matplotlib library, which is widely used for creating static, animated, and interactive visualizations in Python. In this comprehensive guide, we’ll explore the Matplotlib.axis.Axis.get_sketch_params() function in detail, covering its usage, parameters, return values, and practical applications.
Understanding Matplotlib.axis.Axis.get_sketch_params() Function
The Matplotlib.axis.Axis.get_sketch_params() function is used to retrieve the sketch parameters of an Axis object. These sketch parameters control the appearance of the axis when it is drawn with a sketch-like style. The function returns a tuple containing three values: scale, length, and randomness.
Let’s start with a simple example to demonstrate how to use the Matplotlib.axis.Axis.get_sketch_params() function:
import matplotlib.pyplot as plt

# Create a figure and axis
fig, ax = plt.subplots()

# Set sketch parameters for the x-axis
ax.xaxis.set_sketch_params(scale=1, length=100, randomness=0.1)

# Get sketch parameters for the x-axis
sketch_params = ax.xaxis.get_sketch_params()

print(f"Sketch parameters for x-axis: {sketch_params}")

plt.title("Matplotlib.axis.Axis.get_sketch_params() Example - how2matplotlib.com")
plt.show()
Output:
In this example, we first set the sketch parameters for the x-axis using the set_sketch_params() function. Then, we use the get_sketch_params() function to retrieve these parameters. The returned tuple contains the scale, length, and randomness values.
Parameters of Matplotlib.axis.Axis.get_sketch_params() Function
The Matplotlib.axis.Axis.get_sketch_params() function doesn’t take any parameters. It simply returns the current sketch parameters of the Axis object.
Return Value of Matplotlib.axis.Axis.get_sketch_params() Function
The Matplotlib.axis.Axis.get_sketch_params() function returns a tuple containing three values:
- scale: A float value representing the scale of the sketch effect.
- length: A float value representing the length of the sketch strokes.
- randomness: A float value representing the randomness of the sketch effect.
Let’s look at an example that demonstrates how to access these individual values:
import matplotlib.pyplot as plt

fig, ax = plt.subplots()

# Set sketch parameters for the y-axis
ax.yaxis.set_sketch_params(scale=0.5, length=50, randomness=0.2)

# Get sketch parameters for the y-axis
sketch_params = ax.yaxis.get_sketch_params()

scale, length, randomness = sketch_params

print(f"Scale: {scale}")
print(f"Length: {length}")
print(f"Randomness: {randomness}")

plt.title("Accessing Sketch Parameters - how2matplotlib.com")
plt.show()
Output:
In this example, we set the sketch parameters for the y-axis and then retrieve them using the get_sketch_params() function. We then unpack the returned tuple into individual variables for easy access.
Practical Applications of Matplotlib.axis.Axis.get_sketch_params() Function
The Matplotlib.axis.Axis.get_sketch_params() function is particularly useful when you need to retrieve the current sketch parameters of an axis for further manipulation or comparison. Here are some practical applications:
1. Copying Sketch Parameters Between Axes
You can use the get_sketch_params() function to copy sketch parameters from one axis to another:
import matplotlib.pyplot as plt

fig, (ax1, ax2) = plt.subplots(1, 2, figsize=(10, 5))

# Set sketch parameters for the x-axis of the first subplot
ax1.xaxis.set_sketch_params(scale=0.8, length=75, randomness=0.15)

# Get sketch parameters from the first subplot's x-axis
sketch_params = ax1.xaxis.get_sketch_params()

# Apply the same sketch parameters to the second subplot's x-axis
ax2.xaxis.set_sketch_params(*sketch_params)

ax1.set_title("Subplot 1")
ax2.set_title("Subplot 2")
fig.suptitle("Copying Sketch Parameters - how2matplotlib.com")
plt.show()
Output:
In this example, we set sketch parameters for the x-axis of the first subplot, retrieve them using get_sketch_params(), and then apply the same parameters to the x-axis of the second subplot.
2. Comparing Sketch Parameters
You can use the get_sketch_params() function to compare sketch parameters between different axes:
import matplotlib.pyplot as plt

fig, (ax1, ax2) = plt.subplots(1, 2, figsize=(10, 5))

ax1.xaxis.set_sketch_params(scale=0.7, length=80, randomness=0.1)
ax2.xaxis.set_sketch_params(scale=0.9, length=60, randomness=0.2)

params1 = ax1.xaxis.get_sketch_params()
params2 = ax2.xaxis.get_sketch_params()

print(f"Subplot 1 sketch params: {params1}")
print(f"Subplot 2 sketch params: {params2}")

if params1 == params2:
    print("Sketch parameters are the same")
else:
    print("Sketch parameters are different")

plt.suptitle("Comparing Sketch Parameters - how2matplotlib.com")
plt.show()
Output:
This example demonstrates how to compare sketch parameters between two different axes using the get_sketch_params() function.
3. Modifying Existing Sketch Parameters
You can use the get_sketch_params() function to retrieve current sketch parameters, modify them, and then apply the modified parameters:
import matplotlib.pyplot as plt

fig, ax = plt.subplots()

# Set initial sketch parameters
ax.xaxis.set_sketch_params(scale=0.5, length=50, randomness=0.1)

# Get current sketch parameters
current_params = ax.xaxis.get_sketch_params()

# Modify the scale parameter
modified_params = (current_params[0] * 1.5, current_params[1], current_params[2])

# Apply modified parameters
ax.xaxis.set_sketch_params(*modified_params)

print(f"Original params: {current_params}")
print(f"Modified params: {modified_params}")

plt.title("Modifying Sketch Parameters - how2matplotlib.com")
plt.show()
Output:
In this example, we retrieve the current sketch parameters, modify the scale parameter, and then apply the modified parameters back to the axis.
Best Practices for Using Matplotlib.axis.Axis.get_sketch_params() Function
When working with the Matplotlib.axis.Axis.get_sketch_params() function, consider the following best practices:
- Always check if sketch parameters are set before using them:
import matplotlib.pyplot as plt

fig, ax = plt.subplots()

sketch_params = ax.xaxis.get_sketch_params()

if sketch_params is not None:
    print(f"Sketch parameters: {sketch_params}")
else:
    print("No sketch parameters set")

plt.title("Checking for Sketch Parameters - how2matplotlib.com")
plt.show()
Output:
- Use meaningful variable names when unpacking sketch parameters:
import matplotlib.pyplot as plt

fig, ax = plt.subplots()

ax.xaxis.set_sketch_params(scale=0.7, length=60, randomness=0.1)

sketch_scale, sketch_length, sketch_randomness = ax.xaxis.get_sketch_params()

print(f"Scale: {sketch_scale}")
print(f"Length: {sketch_length}")
print(f"Randomness: {sketch_randomness}")

plt.title("Using Meaningful Variable Names - how2matplotlib.com")
plt.show()
Output:
- Consider the impact of sketch parameters on plot readability:
import matplotlib.pyplot as plt
import numpy as np

fig, (ax1, ax2) = plt.subplots(1, 2, figsize=(12, 5))

x = np.linspace(0, 10, 100)
y = np.sin(x)

ax1.plot(x, y)
ax1.set_title("Without Sketch")

ax2.plot(x, y)
ax2.xaxis.set_sketch_params(scale=1, length=100, randomness=0.5)
ax2.yaxis.set_sketch_params(scale=1, length=100, randomness=0.5)
ax2.set_title("With Sketch")

fig.suptitle("Impact of Sketch Parameters on Readability - how2matplotlib.com")
plt.show()
Output:
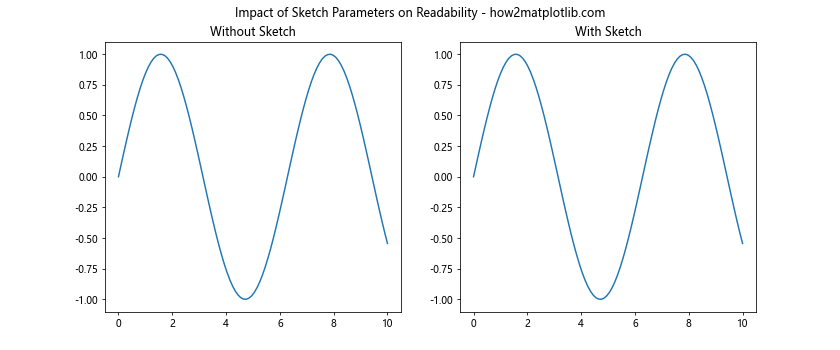
This example demonstrates the impact of sketch parameters on plot readability by comparing a regular plot with a sketched plot.
Common Pitfalls and How to Avoid Them
When working with the Matplotlib.axis.Axis.get_sketch_params() function, be aware of these common pitfalls:
- Assuming sketch parameters are always set:
import matplotlib.pyplot as plt

fig, ax = plt.subplots()

# This may raise an error if sketch parameters are not set
try:
    sketch_params = ax.xaxis.get_sketch_params()
    print(f"Sketch parameters: {sketch_params}")
except AttributeError:
    print("Sketch parameters are not set")

plt.title("Handling Unset Sketch Parameters - how2matplotlib.com")
plt.show()
Output:

- Forgetting to apply sketch parameters to both x and y axes:
import matplotlib.pyplot as plt

fig, (ax1, ax2) = plt.subplots(1, 2, figsize=(10, 5))

# Incorrect: Only applying to x-axis
ax1.xaxis.set_sketch_params(scale=0.8, length=70, randomness=0.2)

# Correct: Applying to both x and y axes
ax2.xaxis.set_sketch_params(scale=0.8, length=70, randomness=0.2)
ax2.yaxis.set_sketch_params(scale=0.8, length=70, randomness=0.2)

ax1.set_title("Incorrect (X-axis only)")
ax2.set_title("Correct (Both axes)")
fig.suptitle("Applying Sketch Parameters to Both Axes - how2matplotlib.com")
plt.show()
Output:
- Using incompatible sketch parameter values:
import matplotlib.pyplot as plt

fig, ax = plt.subplots()

# This may produce unexpected results or warnings
ax.xaxis.set_sketch_params(scale=-1, length=-50, randomness=2)

sketch_params = ax.xaxis.get_sketch_params()
print(f"Sketch parameters: {sketch_params}")

plt.title("Using Incompatible Sketch Parameter Values - how2matplotlib.com")
plt.show()
Output:
Integrating Matplotlib.axis.Axis.get_sketch_params() with Other Matplotlib Features
The Matplotlib.axis.Axis.get_sketch_params() function can be integrated with other Matplotlib features to create more complex and informative visualizations. Here are some examples:
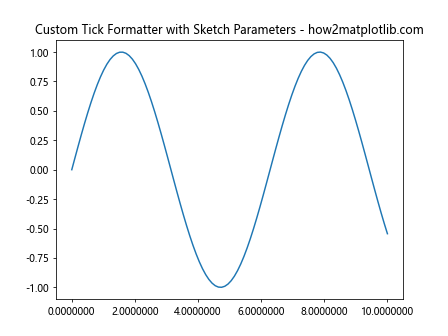
- Combining sketch parameters with custom tick formatters:
import matplotlib.pyplot as plt
import numpy as np

fig, ax = plt.subplots()

x = np.linspace(0, 10, 100)
y = np.sin(x)

ax.plot(x, y)

# Set and get sketch parameters
ax.xaxis.set_sketch_params(scale=0.7, length=60, randomness=0.1)
sketch_params = ax.xaxis.get_sketch_params()

# Create a custom tick formatter based on sketch parameters
def tick_formatter(x, pos):
    return f"{x:.{int(sketch_params[0] * 10)}f}"

ax.xaxis.set_major_formatter(plt.FuncFormatter(tick_formatter))

plt.title("Custom Tick Formatter with Sketch Parameters - how2matplotlib.com")
plt.show()
Output:
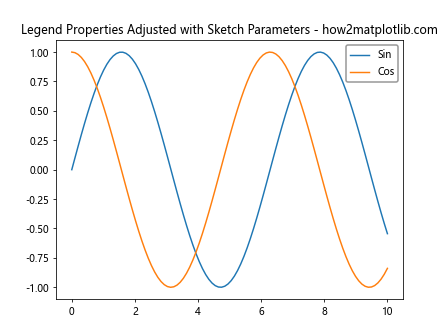
- Using sketch parameters to adjust legend properties:
import matplotlib.pyplot as plt
import numpy as np

fig, ax = plt.subplots()

x = np.linspace(0, 10, 100)
y1 = np.sin(x)
y2 = np.cos(x)

ax.plot(x, y1, label="Sin")
ax.plot(x, y2, label="Cos")

# Set and get sketch parameters
ax.xaxis.set_sketch_params(scale=0.8, length=70, randomness=0.2)
sketch_params = ax.xaxis.get_sketch_params()

# Adjust legend properties based on sketch parameters
legend = ax.legend()
legend.get_frame().set_linewidth(sketch_params[0] * 2)
legend.get_frame().set_edgecolor('gray')

plt.title("Legend Properties Adjusted with Sketch Parameters - how2matplotlib.com")
plt.show()
Output:
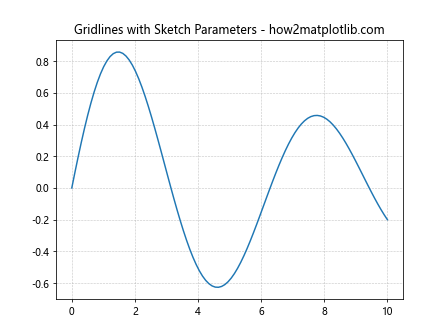
- Applying sketch parameters to gridlines:
import matplotlib.pyplot as plt
import numpy as np

fig, ax = plt.subplots()

x = np.linspace(0, 10, 100)
y = np.sin(x) * np.exp(-x/10)

ax.plot(x, y)

# Set and get sketch parameters
ax.xaxis.set_sketch_params(scale=0.6, length=50, randomness=0.1)
sketch_params = ax.xaxis.get_sketch_params()

# Apply sketch parameters to gridlines
ax.grid(True, linestyle='--', linewidth=sketch_params[0], alpha=0.7)

plt.title("Gridlines with Sketch Parameters - how2matplotlib.com")
plt.show()
Output:
Advanced Techniques with Matplotlib.axis.Axis.get_sketch_params()
Let’s explore some advanced techniques that leverage the Matplotlib.axis.Axis.get_sketch_params() function:
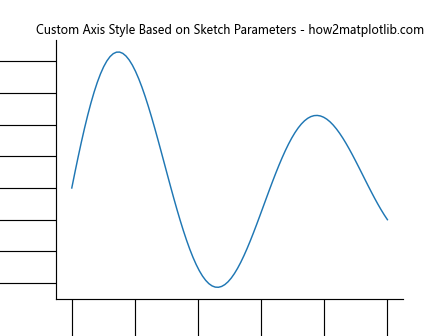
- Creating a custom axis style based on sketch parameters:
import matplotlib.pyplot as plt
import numpy as np

def custom_axis_style(ax, scale_factor=1.0):
    sketch_params = ax.xaxis.get_sketch_params()
    if sketch_params is None:
        sketch_params = (0.5, 50, 0.1)  # Default values

    ax.spines['top'].set_visible(False)
    ax.spines['right'].set_visible(False)
    ax.spines['bottom'].set_linewidth(sketch_params[0] * scale_factor)
    ax.spines['left'].set_linewidth(sketch_params[0] * scale_factor)
    ax.tick_params(width=sketch_params[0] * scale_factor, length=sketch_params[1] * scale_factor)

fig, ax = plt.subplots()

x = np.linspace(0, 10, 100)
y = np.sin(x) * np.exp(-x/10)

ax.plot(x, y)
ax.xaxis.set_sketch_params(scale=0.8, length=60, randomness=0.2)

custom_axis_style(ax, scale_factor=1.5)

plt.title("Custom Axis Style Based on Sketch Parameters - how2matplotlib.com")
plt.show()
Output:
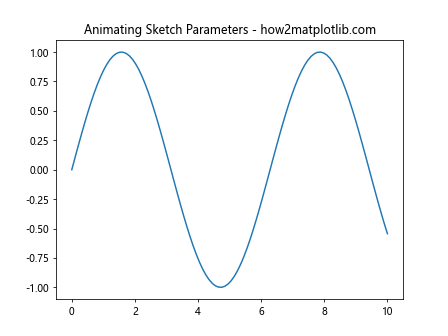
- Animating sketch parameters:
import matplotlib.pyplot as plt
import numpy as np
from matplotlib.animation import FuncAnimation

fig, ax = plt.subplots()

x = np.linspace(0, 10, 100)
y = np.sin(x)
line, = ax.plot(x, y)

ax.xaxis.set_sketch_params(scale=0.5, length=50, randomness=0.1)

def update(frame):
    current_params = ax.xaxis.get_sketch_params()
    new_scale = 0.5 + 0.5 * np.sin(frame / 10)
    ax.xaxis.set_sketch_params(scale=new_scale, length=current_params[1], randomness=current_params[2])
    return line,

ani = FuncAnimation(fig, update, frames=100, interval=50, blit=True)

plt.title("Animating Sketch Parameters - how2matplotlib.com")
plt.show()
Output:
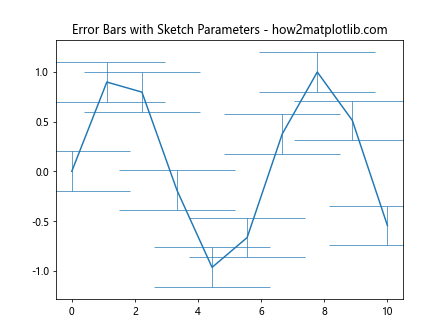
- Using sketch parameters for error bars:
import matplotlib.pyplot as plt
import numpy as np

fig, ax = plt.subplots()

x = np.linspace(0, 10, 10)
y = np.sin(x)
yerr = 0.2 * np.ones_like(y)

ax.xaxis.set_sketch_params(scale=0.7, length=60, randomness=0.2)
sketch_params = ax.xaxis.get_sketch_params()

ax.errorbar(x, y, yerr=yerr, capsize=sketch_params[1],
            elinewidth=sketch_params[0], capthick=sketch_params[0])

plt.title("Error Bars with Sketch Parameters - how2matplotlib.com")
plt.show()
Output:
Troubleshooting Common Issues with Matplotlib.axis.Axis.get_sketch_params()
When working with the Matplotlib.axis.Axis.get_sketch_params() function, you might encounter some issues. Here are some common problems and their solutions:
- Sketch parameters not affecting the plot:
import matplotlib.pyplot as plt
import numpy as np

fig, (ax1, ax2) = plt.subplots(1, 2, figsize=(12, 5))

x = np.linspace(0, 10, 100)
y = np.sin(x)

ax1.plot(x, y)
ax1.set_title("Without sketch")

ax2.plot(x, y)
ax2.xaxis.set_sketch_params(scale=1, length=100, randomness=0.5)
ax2.yaxis.set_sketch_params(scale=1, length=100, randomness=0.5)
ax2.set_title("With sketch")

# Enable sketching for the entire figure
plt.rcParams['path.sketch'] = (1, 100, 0.5)

fig.suptitle("Troubleshooting: Enabling Sketch Effect - how2matplotlib.com")
plt.show()
Output:
- Inconsistent sketch parameters across subplots:
import matplotlib.pyplot as plt
import numpy as np

fig, (ax1, ax2) = plt.subplots(1, 2, figsize=(12, 5))

x = np.linspace(0, 10, 100)
y = np.sin(x)

ax1.plot(x, y)
ax1.xaxis.set_sketch_params(scale=0.5, length=50, randomness=0.1)
ax1.set_title("Subplot 1")

ax2.plot(x, y)
ax2.xaxis.set_sketch_params(scale=1, length=100, randomness=0.5)
ax2.set_title("Subplot 2")

# Get and print sketch parameters for both subplots
params1 = ax1.xaxis.get_sketch_params()
params2 = ax2.xaxis.get_sketch_params()

print(f"Subplot 1 params: {params1}")
print(f"Subplot 2 params: {params2}")

fig.suptitle("Troubleshooting: Inconsistent Sketch Parameters - how2matplotlib.com")
plt.show()
Output:
- Sketch parameters not persisting after saving and loading a figure:
import matplotlib.pyplot as plt
import numpy as np
import pickle

# Create and save a figure with sketch parameters
fig, ax = plt.subplots()

x = np.linspace(0, 10, 100)
y = np.sin(x)

ax.plot(x, y)
ax.xaxis.set_sketch_params(scale=0.8, length=70, randomness=0.2)

original_params = ax.xaxis.get_sketch_params()
print(f"Original params: {original_params}")

# Save the figure
with open('figure.pkl', 'wb') as file:
    pickle.dump(fig, file)

plt.close(fig)

# Load the saved figure
with open('figure.pkl', 'rb') as file:
    loaded_fig = pickle.load(file)

loaded_ax = loaded_fig.axes[0]
loaded_params = loaded_ax.xaxis.get_sketch_params()
print(f"Loaded params: {loaded_params}")

loaded_fig.suptitle("Troubleshooting: Persisting Sketch Parameters - how2matplotlib.com")
plt.show()
Output:
Conclusion
The Matplotlib.axis.Axis.get_sketch_params() function is a powerful tool for retrieving and manipulating sketch parameters in Matplotlib. Throughout this comprehensive guide, we’ve explored its usage, parameters, return values, and practical applications. We’ve also covered advanced techniques, best practices, and common pitfalls to avoid.
By mastering the Matplotlib.axis.Axis.get_sketch_params() function, you can create more dynamic and visually appealing plots, customize axis appearances, and integrate sketch parameters with other Matplotlib features. Remember to always consider the impact of sketch parameters on plot readability and adjust them accordingly to achieve the desired visual effect.