How to Plot Multiple Columns of Pandas Dataframe on Bar Chart with Matplotlib
Plot Multiple Columns of Pandas Dataframe on Bar Chart with Matplotlib is a powerful technique for visualizing data from multiple columns in a single chart. This article will provide a detailed exploration of how to effectively plot multiple columns of a Pandas DataFrame on a bar chart using Matplotlib. We’ll cover various aspects of this visualization method, including different types of bar charts, customization options, and best practices for creating clear and informative visualizations.
Understanding the Basics of Plotting Multiple Columns
Before we dive into the specifics of plotting multiple columns of a Pandas DataFrame on a bar chart with Matplotlib, it’s essential to understand the fundamental concepts. When we plot multiple columns, we’re essentially comparing different categories or variables side by side. This type of visualization is particularly useful when you want to show relationships, patterns, or differences between multiple data series.
To get started, let’s look at a simple example of how to plot multiple columns of a Pandas DataFrame on a bar chart with Matplotlib:
import pandas as pd
import matplotlib.pyplot as plt

# Create a sample DataFrame
data = {
    'Category': ['A', 'B', 'C', 'D'],
    'Value1': [10, 20, 15, 25],
    'Value2': [15, 25, 20, 30]
}
df = pd.DataFrame(data)

# Plot multiple columns on a bar chart
ax = df.plot(x='Category', y=['Value1', 'Value2'], kind='bar')
plt.title('How to Plot Multiple Columns - how2matplotlib.com')
plt.xlabel('Categories')
plt.ylabel('Values')
plt.legend(title='Columns')
plt.show()
Output:
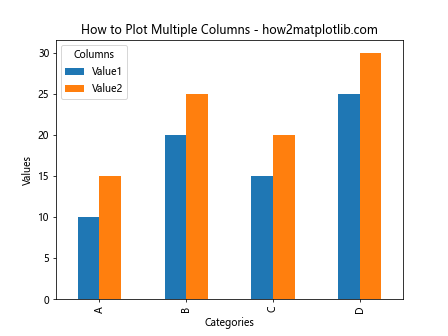
In this example, we create a simple DataFrame with three columns: ‘Category’, ‘Value1’, and ‘Value2’. We then use the plot method of the DataFrame to create a bar chart, specifying ‘Category’ as the x-axis and both ‘Value1’ and ‘Value2’ as the y-axis values. This results in a grouped bar chart where each category has two bars representing the values from the two columns.
Types of Bar Charts for Multiple Columns
When plotting multiple columns of a Pandas DataFrame on a bar chart with Matplotlib, you have several options for how to arrange the bars. Let’s explore some of the most common types:
Grouped Bar Charts
Grouped bar charts are the default when plotting multiple columns. Each category has a group of bars, one for each column being plotted. This is useful for direct comparisons within categories.
import pandas as pd
import matplotlib.pyplot as plt

data = {
    'Month': ['Jan', 'Feb', 'Mar', 'Apr'],
    'Sales': [100, 120, 140, 160],
    'Expenses': [80, 90, 100, 110]
}
df = pd.DataFrame(data)

ax = df.plot(x='Month', y=['Sales', 'Expenses'], kind='bar')
plt.title('Grouped Bar Chart - how2matplotlib.com')
plt.xlabel('Month')
plt.ylabel('Amount')
plt.legend(title='Financial Metrics')
plt.show()
Output:
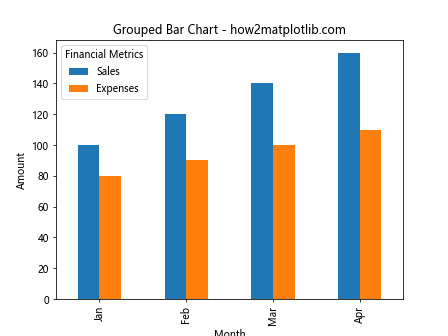
This code creates a grouped bar chart where each month has two bars, one for sales and one for expenses.
Stacked Bar Charts
Stacked bar charts stack the values from each column on top of each other. This is useful for showing the total across all columns as well as the contribution of each column to the total.
import pandas as pd
import matplotlib.pyplot as plt

data = {
    'Year': [2018, 2019, 2020, 2021],
    'Product A': [300, 320, 340, 360],
    'Product B': [200, 220, 240, 260],
    'Product C': [100, 120, 140, 160]
}
df = pd.DataFrame(data)

ax = df.plot(x='Year', y=['Product A', 'Product B', 'Product C'], kind='bar', stacked=True)
plt.title('Stacked Bar Chart - how2matplotlib.com')
plt.xlabel('Year')
plt.ylabel('Sales')
plt.legend(title='Products')
plt.show()
Output:
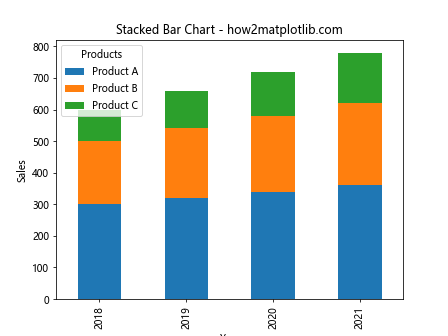
This example creates a stacked bar chart showing the sales of three products over four years.
Horizontal Bar Charts
Horizontal bar charts can be useful when you have long category names or many categories. They work well for both grouped and stacked configurations.
import pandas as pd
import matplotlib.pyplot as plt

data = {
    'Department': ['HR', 'Marketing', 'Sales', 'IT', 'Finance'],
    'Budget': [50000, 100000, 150000, 120000, 80000],
    'Actual Spend': [48000, 98000, 155000, 115000, 82000]
}
df = pd.DataFrame(data)

ax = df.plot(x='Department', y=['Budget', 'Actual Spend'], kind='barh')
plt.title('Horizontal Bar Chart - how2matplotlib.com')
plt.xlabel('Amount')
plt.ylabel('Department')
plt.legend(title='Financial Metrics')
plt.show()
Output:
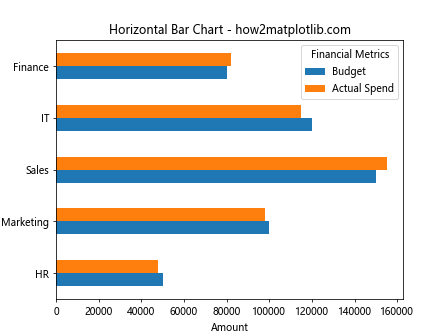
This code creates a horizontal grouped bar chart comparing budget and actual spend across different departments.
Customizing Bar Charts with Multiple Columns
When you plot multiple columns of a Pandas DataFrame on a bar chart with Matplotlib, there are numerous customization options available to enhance the visual appeal and clarity of your chart. Let’s explore some of these options:
Changing Bar Colors
You can customize the colors of the bars to make your chart more visually appealing or to conform to a specific color scheme.
import pandas as pd
import matplotlib.pyplot as plt

data = {
    'Quarter': ['Q1', 'Q2', 'Q3', 'Q4'],
    'Revenue': [100, 120, 140, 160],
    'Profit': [20, 25, 30, 35]
}
df = pd.DataFrame(data)

ax = df.plot(x='Quarter', y=['Revenue', 'Profit'], kind='bar', color=['#1f77b4', '#ff7f0e'])
plt.title('Custom Color Bar Chart - how2matplotlib.com')
plt.xlabel('Quarter')
plt.ylabel('Amount (in thousands)')
plt.legend(title='Financial Metrics')
plt.show()
Output:
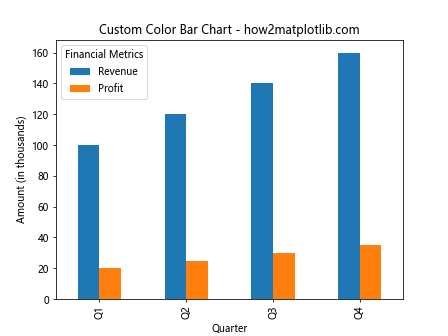
In this example, we specify custom colors for the bars using hex color codes.
Adjusting Bar Width
You can adjust the width of the bars to improve the appearance of your chart, especially when dealing with a large number of categories or columns.
import pandas as pd
import matplotlib.pyplot as plt

data = {
    'Month': ['Jan', 'Feb', 'Mar', 'Apr', 'May', 'Jun'],
    'Sales': [100, 120, 140, 160, 180, 200],
    'Expenses': [80, 90, 100, 110, 120, 130]
}
df = pd.DataFrame(data)

ax = df.plot(x='Month', y=['Sales', 'Expenses'], kind='bar', width=0.8)
plt.title('Adjusted Bar Width Chart - how2matplotlib.com')
plt.xlabel('Month')
plt.ylabel('Amount')
plt.legend(title='Financial Metrics')
plt.show()
Output:
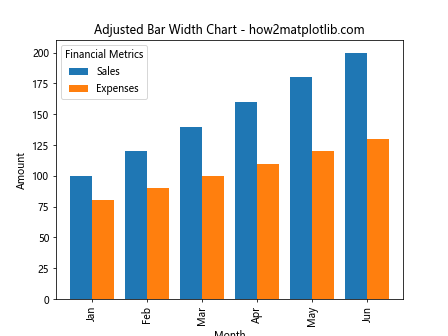
Here, we set the width parameter to 0.8 to make the bars slightly narrower than the default.
Adding Data Labels
Adding data labels to your bars can provide precise values directly on the chart, making it easier for viewers to understand the exact numbers.
import pandas as pd
import matplotlib.pyplot as plt

data = {
    'Category': ['A', 'B', 'C', 'D'],
    'Value1': [10, 20, 15, 25],
    'Value2': [15, 25, 20, 30]
}
df = pd.DataFrame(data)

ax = df.plot(x='Category', y=['Value1', 'Value2'], kind='bar')
for container in ax.containers:
    ax.bar_label(container, label_type='center')
plt.title('Bar Chart with Data Labels - how2matplotlib.com')
plt.xlabel('Categories')
plt.ylabel('Values')
plt.legend(title='Columns')
plt.show()
Output:
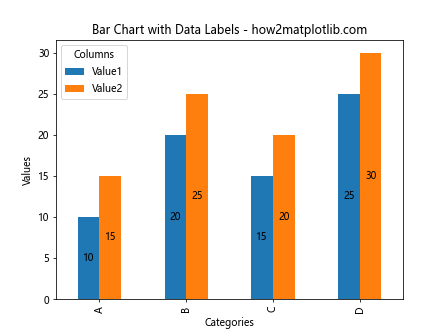
This code adds labels to the center of each bar, displaying the exact value.
Handling Large Datasets
When you plot multiple columns of a Pandas DataFrame on a bar chart with Matplotlib, you may encounter challenges with large datasets. Here are some strategies to handle this:
Filtering Data
If you have too many categories, you might want to filter your data to show only the most relevant information.
import pandas as pd
import matplotlib.pyplot as plt

# Create a large dataset
data = {
    'Category': [f'Cat{i}' for i in range(50)],
    'Value1': [i*2 for i in range(50)],
    'Value2': [i*3 for i in range(50)]
}
df = pd.DataFrame(data)

# Filter to show only top 10 categories by Value1
top_10 = df.nlargest(10, 'Value1')

ax = top_10.plot(x='Category', y=['Value1', 'Value2'], kind='bar')
plt.title('Top 10 Categories - how2matplotlib.com')
plt.xlabel('Categories')
plt.ylabel('Values')
plt.legend(title='Columns')
plt.xticks(rotation=45, ha='right')
plt.tight_layout()
plt.show()
Output:
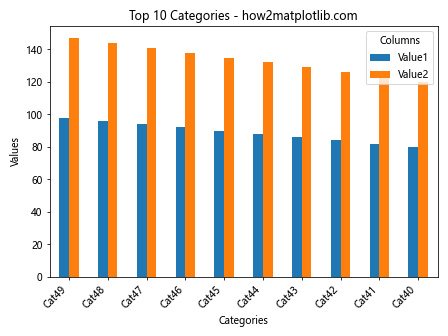
This example filters the dataset to show only the top 10 categories based on ‘Value1’.
Using Subplots
For datasets with many columns, you might want to use subplots to display each column separately.
import pandas as pd
import matplotlib.pyplot as plt

data = {
    'Month': ['Jan', 'Feb', 'Mar', 'Apr', 'May', 'Jun'],
    'Product A': [100, 120, 140, 160, 180, 200],
    'Product B': [80, 90, 100, 110, 120, 130],
    'Product C': [50, 60, 70, 80, 90, 100],
    'Product D': [30, 40, 50, 60, 70, 80]
}
df = pd.DataFrame(data)

fig, axs = plt.subplots(2, 2, figsize=(12, 10))
products = ['Product A', 'Product B', 'Product C', 'Product D']

for i, product in enumerate(products):
    row = i // 2
    col = i % 2
    df.plot(x='Month', y=product, kind='bar', ax=axs[row, col])
    axs[row, col].set_title(f'{product} Sales - how2matplotlib.com')
    axs[row, col].set_xlabel('Month')
    axs[row, col].set_ylabel('Sales')

plt.tight_layout()
plt.show()
Output:
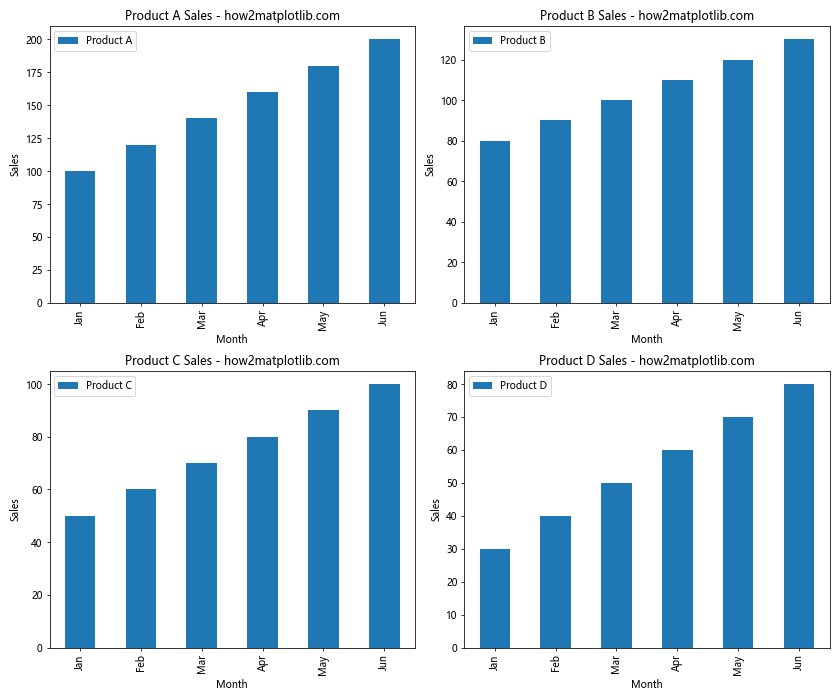
This code creates a 2×2 grid of subplots, each showing the sales for a different product.
Comparing Different Metrics
When you plot multiple columns of a Pandas DataFrame on a bar chart with Matplotlib, you often want to compare different metrics. However, these metrics might have different scales, making direct comparison difficult. Here are some techniques to address this:
Using Secondary Y-axis
When dealing with metrics of different scales, you can use a secondary y-axis to plot them on the same chart.
import pandas as pd
import matplotlib.pyplot as plt

data = {
    'Year': [2018, 2019, 2020, 2021, 2022],
    'Revenue': [1000, 1200, 1400, 1600, 1800],
    'Profit Margin': [10, 12, 15, 14, 16]
}
df = pd.DataFrame(data)

fig, ax1 = plt.subplots()

ax1.bar(df['Year'], df['Revenue'], color='b', alpha=0.7)
ax1.set_xlabel('Year')
ax1.set_ylabel('Revenue', color='b')
ax1.tick_params(axis='y', labelcolor='b')

ax2 = ax1.twinx()
ax2.plot(df['Year'], df['Profit Margin'], color='r', marker='o')
ax2.set_ylabel('Profit Margin (%)', color='r')
ax2.tick_params(axis='y', labelcolor='r')

plt.title('Revenue and Profit Margin Comparison - how2matplotlib.com')
plt.tight_layout()
plt.show()
Output:
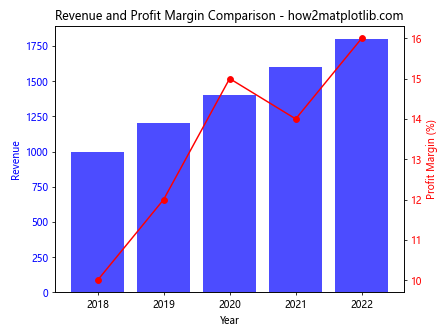
This example plots revenue as bars on the primary y-axis and profit margin as a line on the secondary y-axis.
Normalizing Data
Another approach is to normalize your data so that all metrics are on the same scale.
import pandas as pd
import matplotlib.pyplot as plt

data = {
    'Year': [2018, 2019, 2020, 2021, 2022],
    'Revenue': [1000, 1200, 1400, 1600, 1800],
    'Expenses': [800, 900, 1000, 1100, 1200],
    'Profit': [200, 300, 400, 500, 600]
}
df = pd.DataFrame(data)

# Normalize the data
df_normalized = df.set_index('Year')
df_normalized = df_normalized.apply(lambda x: (x - x.min()) / (x.max() - x.min()))

ax = df_normalized.plot(kind='bar', width=0.8)
plt.title('Normalized Financial Metrics - how2matplotlib.com')
plt.xlabel('Year')
plt.ylabel('Normalized Value')
plt.legend(title='Metrics')
plt.show()
Output:
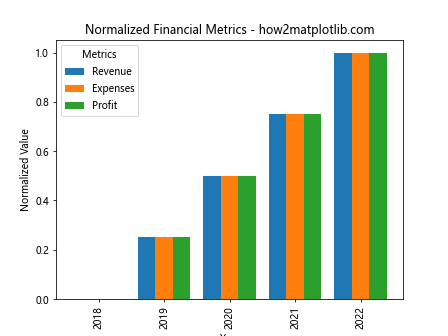
This code normalizes the financial metrics to a 0-1 scale, allowing for easier comparison.
Enhancing Readability
When you plot multiple columns of a Pandas DataFrame on a bar chart with Matplotlib, it’s crucial to ensure that your chart is easy to read and understand. Here are some techniques to enhance readability:
Rotating X-axis Labels
If you have long category names or many categories, rotating the x-axis labels can prevent overlap and improve readability.
import pandas as pd
import matplotlib.pyplot as plt

data = {
    'Product': ['Product A', 'Product B', 'Product C', 'Product D', 'Product E'],
    'Sales 2021': [100, 120, 140, 160, 180],
    'Sales 2022': [110, 130, 150, 170, 190]
}
df = pd.DataFrame(data)

ax = df.plot(x='Product', y=['Sales 2021', 'Sales 2022'], kind='bar')
plt.title('Product Sales Comparison - how2matplotlib.com')
plt.xlabel('Products')
plt.ylabel('Sales')
plt.legend(title='Year')
plt.xticks(rotation=45, ha='right')
plt.tight_layout()
plt.show()
Output:
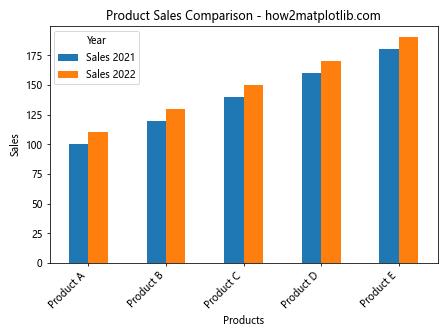
This example rotates the x-axis labels by 45 degrees and aligns them to the right for better readability.
Adding Grid Lines
Grid lines can help viewers more accurately read values from the chart.
import pandas as pd
import matplotlib.pyplot as plt

data = {
    'Month': ['Jan', 'Feb', 'Mar', 'Apr', 'May', 'Jun'],
    'Department A': [50, 60, 70, 80, 90, 100],
    'Department B': [60, 70, 80, 90, 100, 110],
    'Department C': [70, 80, 90, 100, 110, 120]
}
df = pd.DataFrame(data)

ax = df.plot(x='Month', y=['Department A', 'Department B', 'Department C'], kind='bar')
plt.title('Monthly Department Performance - how2matplotlib.com')
plt.xlabel('Month')
plt.ylabel('Performance Score')
plt.legend(title='Departments')
plt.grid(axis='y', linestyle='--', alpha=0.7)
plt.show()
Output:
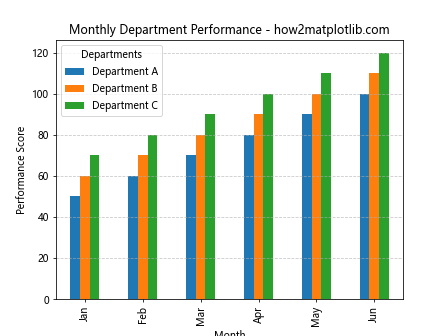
This code adds horizontal grid linesto the chart, making it easier to read the values.
Using a Color Palette
Using a consistent and visually appealing color palette can make your chart more attractive and easier to interpret.
import pandas as pd
import matplotlib.pyplot as plt
import seaborn as sns

data = {
    'Quarter': ['Q1', 'Q2', 'Q3', 'Q4'],
    'Product A': [100, 120, 140, 160],
    'Product B': [90, 110, 130, 150],
    'Product C': [80, 100, 120, 140]
}
df = pd.DataFrame(data)

sns.set_palette("husl")
ax = df.plot(x='Quarter', y=['Product A', 'Product B', 'Product C'], kind='bar')
plt.title('Quarterly Product Sales - how2matplotlib.com')
plt.xlabel('Quarter')
plt.ylabel('Sales')
plt.legend(title='Products')
plt.show()
Output:
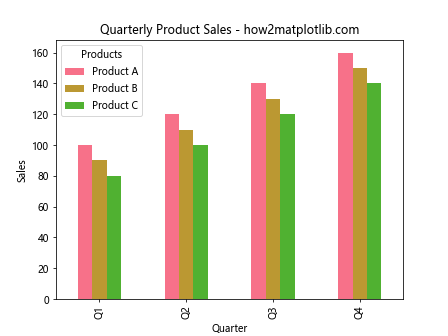
This example uses Seaborn’s “husl” color palette to create a visually appealing chart.
Handling Time Series Data
When you plot multiple columns of a Pandas DataFrame on a bar chart with Matplotlib, you may often deal with time series data. Here are some techniques for effectively visualizing time-based data:
Using DatetimeIndex
If your data has dates, using a DatetimeIndex can provide better formatting and allow for easy resampling.
import pandas as pd
import matplotlib.pyplot as plt

# Create a DataFrame with a DatetimeIndex
dates = pd.date_range(start='2022-01-01', end='2022-12-31', freq='M')
data = {
    'Product A': [100 + i*10 for i in range(12)],
    'Product B': [90 + i*10 for i in range(12)],
    'Product C': [80 + i*10 for i in range(12)]
}
df = pd.DataFrame(data, index=dates)

ax = df.plot(kind='bar', width=0.8)
plt.title('Monthly Product Sales in 2022 - how2matplotlib.com')
plt.xlabel('Month')
plt.ylabel('Sales')
plt.legend(title='Products')
plt.xticks(rotation=45, ha='right')
plt.tight_layout()
plt.show()
Output:
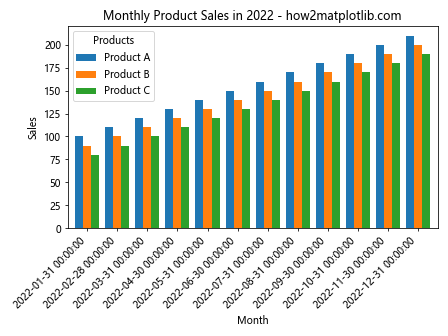
This example creates a bar chart with monthly data, using a DatetimeIndex for better date formatting.
Resampling Data
When dealing with high-frequency data, you might want to resample it to a lower frequency for better visualization.
import pandas as pd
import matplotlib.pyplot as plt
import numpy as np

# Create a DataFrame with daily data
dates = pd.date_range(start='2022-01-01', end='2022-12-31', freq='D')
data = {
    'Product A': np.random.randint(50, 150, size=len(dates)),
    'Product B': np.random.randint(40, 140, size=len(dates)),
    'Product C': np.random.randint(30, 130, size=len(dates))
}
df = pd.DataFrame(data, index=dates)

# Resample to monthly data
df_monthly = df.resample('M').mean()

ax = df_monthly.plot(kind='bar', width=0.8)
plt.title('Monthly Average Product Sales in 2022 - how2matplotlib.com')
plt.xlabel('Month')
plt.ylabel('Average Sales')
plt.legend(title='Products')
plt.xticks(rotation=45, ha='right')
plt.tight_layout()
plt.show()
Output:
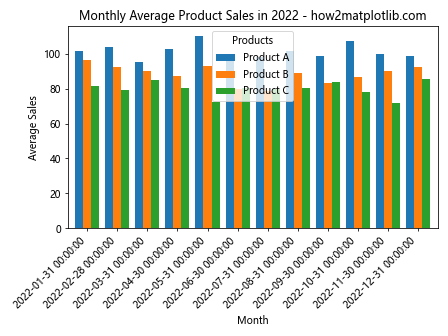
This code resamples daily data to monthly averages before plotting.
Advanced Techniques
When you plot multiple columns of a Pandas DataFrame on a bar chart with Matplotlib, there are several advanced techniques you can use to create more complex and informative visualizations:
Using Annotations
Annotations can be used to highlight specific data points or provide additional context.
import pandas as pd
import matplotlib.pyplot as plt

data = {
    'Quarter': ['Q1', 'Q2', 'Q3', 'Q4'],
    'Revenue': [100, 120, 150, 130],
    'Expenses': [80, 90, 100, 95]
}
df = pd.DataFrame(data)

ax = df.plot(x='Quarter', y=['Revenue', 'Expenses'], kind='bar')
plt.title('Quarterly Financial Performance - how2matplotlib.com')
plt.xlabel('Quarter')
plt.ylabel('Amount')
plt.legend(title='Metrics')

# Add annotation for highest revenue
max_revenue = df['Revenue'].max()
max_quarter = df.loc[df['Revenue'] == max_revenue, 'Quarter'].iloc[0]
plt.annotate(f'Highest Revenue: {max_revenue}',
             xy=(df.index[df['Quarter'] == max_quarter][0], max_revenue),
             xytext=(0, 20), textcoords='offset points',
             ha='center', va='bottom',
             bbox=dict(boxstyle='round,pad=0.5', fc='yellow', alpha=0.5),
             arrowprops=dict(arrowstyle='->', connectionstyle='arc3,rad=0'))

plt.tight_layout()
plt.show()
Output:
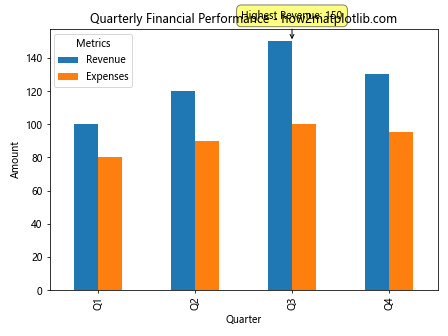
This code adds an annotation to highlight the quarter with the highest revenue.
Best Practices for Plotting Multiple Columns
When you plot multiple columns of a Pandas DataFrame on a bar chart with Matplotlib, it’s important to follow some best practices to ensure your visualizations are effective and informative:
- Choose the Right Chart Type: Decide whether a grouped, stacked, or combination chart best represents your data.
Limit the Number of Categories: Too many categories can make the chart cluttered. Consider grouping less significant categories into an “Other” category.
Use Clear Labels: Ensure all axes, titles, and legends are clearly labeled.
Choose Colors Wisely: Use a color scheme that is both visually appealing and accessible to color-blind viewers.
Provide Context: Use annotations or text to highlight important data points or trends.
Scale Appropriately: If comparing metrics with vastly different scales, consider using secondary axes or normalization.
Order Data Meaningfully: Arrange your data in a logical order (e.g., chronological, ascending, or descending) unless there’s a specific reason not to.
Avoid 3D Charts: While 3D charts might look impressive, they often make it harder to accurately read values.
Here’s an example that incorporates several of these best practices: