How to Plot a Vertical Line in Matplotlib
Plot a vertical line in Matplotlib is an essential skill for data visualization and analysis. This article will provide a detailed exploration of various methods and techniques to plot a vertical line using Matplotlib, one of the most popular plotting libraries in Python. We’ll cover everything from basic vertical line plotting to advanced customization options, ensuring you have a thorough understanding of how to plot a vertical line in Matplotlib.
Introduction to Plotting Vertical Lines in Matplotlib
Before we dive into the specifics of how to plot a vertical line in Matplotlib, let’s briefly discuss why vertical lines are important in data visualization. Vertical lines can be used to highlight specific points on the x-axis, separate different regions of a plot, or indicate thresholds or boundaries. Understanding how to plot a vertical line in Matplotlib is crucial for creating clear and informative visualizations.
To begin, let’s look at the simplest way to plot a vertical line in Matplotlib:
import matplotlib.pyplot as plt

fig, ax = plt.subplots()
ax.axvline(x=5, color='r', linestyle='--')
ax.set_title('How to Plot a Vertical Line in Matplotlib - how2matplotlib.com')
plt.show()
Output:
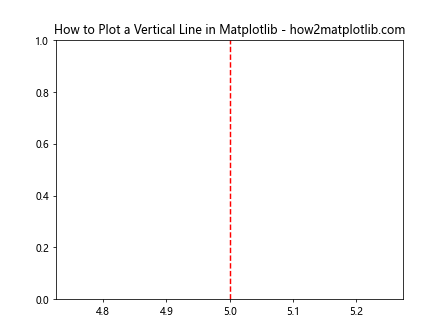
In this example, we use the axvline() function to plot a vertical line at x=5. The color parameter sets the line color to red, and the linestyle parameter makes it a dashed line. This is the most straightforward way to plot a vertical line in Matplotlib.
Using plt.vlines() to Plot Vertical Lines
Another method to plot a vertical line in Matplotlib is using the plt.vlines() function. This function allows you to plot multiple vertical lines at once, which can be useful in certain scenarios. Here’s an example:
import matplotlib.pyplot as plt

fig, ax = plt.subplots()
ax.vlines(x=[2, 4, 6], ymin=0, ymax=10, colors=['r', 'g', 'b'], linestyles=['solid', 'dashed', 'dotted'])
ax.set_title('Multiple Vertical Lines - how2matplotlib.com')
plt.show()
Output:
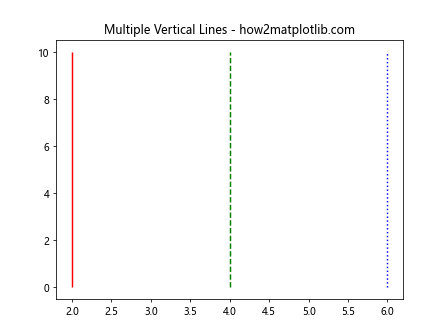
In this example, we plot three vertical lines at x=2, 4, and 6, with different colors and line styles. The ymin and ymax parameters define the range of the vertical lines.
Customizing Vertical Lines in Matplotlib
When you plot a vertical line in Matplotlib, you have various options for customization. Let’s explore some of these options:
Changing Line Width
You can adjust the width of the vertical line using the linewidth parameter:
import matplotlib.pyplot as plt

fig, ax = plt.subplots()
ax.axvline(x=5, color='r', linewidth=3)
ax.set_title('Thick Vertical Line - how2matplotlib.com')
plt.show()
Output:
This code plots a thicker vertical line at x=5.
Adding Labels to Vertical Lines
To make your plot more informative, you can add labels to your vertical lines:
import matplotlib.pyplot as plt

fig, ax = plt.subplots()
ax.axvline(x=5, color='r', label='Threshold')
ax.legend()
ax.set_title('Labeled Vertical Line - how2matplotlib.com')
plt.show()
Output:
This example adds a label to the vertical line and displays a legend.
Using Different Line Styles
Matplotlib offers various line styles for vertical lines. Here’s an example showcasing different styles:
import matplotlib.pyplot as plt

fig, ax = plt.subplots()
ax.axvline(x=2, linestyle='solid', color='r', label='Solid')
ax.axvline(x=4, linestyle='dashed', color='g', label='Dashed')
ax.axvline(x=6, linestyle='dotted', color='b', label='Dotted')
ax.axvline(x=8, linestyle='dashdot', color='m', label='Dash-dot')
ax.legend()
ax.set_title('Different Line Styles - how2matplotlib.com')
plt.show()
Output:
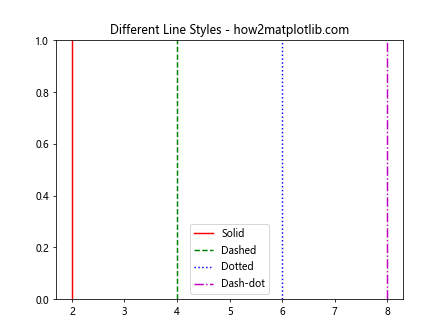
This code demonstrates four different line styles for vertical lines.
Plotting Vertical Lines with Specific Ranges
Sometimes, you may want to plot a vertical line that only spans a specific range of y-values. Here’s how you can achieve this:
import matplotlib.pyplot as plt

fig, ax = plt.subplots()
ax.plot([0, 10], [0, 10])  # Diagonal line for reference
ax.vlines(x=5, ymin=2, ymax=8, colors='r', linestyles='dashed')
ax.set_title('Vertical Line with Specific Range - how2matplotlib.com')
plt.show()
Output:
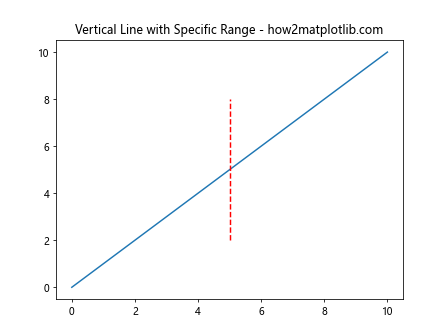
In this example, we plot a vertical line at x=5 that only extends from y=2 to y=8.
Combining Vertical Lines with Other Plot Elements
Vertical lines are often used in combination with other plot elements to create more informative visualizations. Let’s look at some examples:
Vertical Lines with Scatter Plots
import matplotlib.pyplot as plt
import numpy as np

np.random.seed(42)
x = np.random.rand(50)
y = np.random.rand(50)

fig, ax = plt.subplots()
ax.scatter(x, y)
ax.axvline(x=0.5, color='r', linestyle='--')
ax.set_title('Scatter Plot with Vertical Line - how2matplotlib.com')
plt.show()
Output:
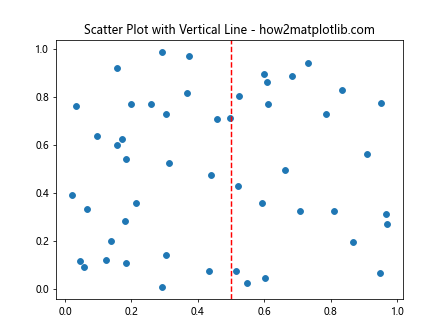
This example combines a scatter plot with a vertical line to highlight a specific x-value.
Vertical Lines with Bar Charts
import matplotlib.pyplot as plt
import numpy as np

categories = ['A', 'B', 'C', 'D', 'E']
values = [3, 7, 2, 5, 8]

fig, ax = plt.subplots()
ax.bar(categories, values)
ax.axvline(x=2, color='r', linestyle='--')
ax.set_title('Bar Chart with Vertical Line - how2matplotlib.com')
plt.show()
Output:
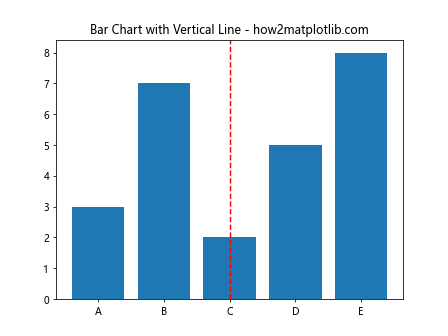
Here, we add a vertical line to a bar chart to emphasize a particular category.
Advanced Techniques for Plotting Vertical Lines
Now that we’ve covered the basics, let’s explore some more advanced techniques for plotting vertical lines in Matplotlib.
Shading Regions with Vertical Lines
You can use vertical lines to shade specific regions of your plot:
import matplotlib.pyplot as plt
import numpy as np

x = np.linspace(0, 10, 100)
y = np.sin(x)

fig, ax = plt.subplots()
ax.plot(x, y)
ax.axvline(x=2, color='r', linestyle='--')
ax.axvline(x=8, color='r', linestyle='--')
ax.axvspan(2, 8, alpha=0.2, color='r')
ax.set_title('Shaded Region with Vertical Lines - how2matplotlib.com')
plt.show()
Output:
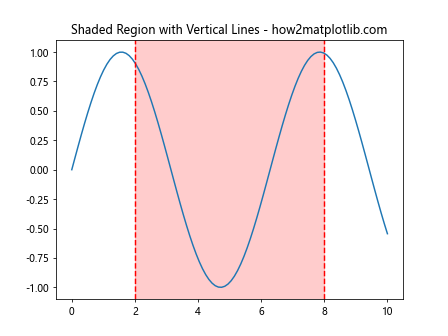
This example uses two vertical lines to define a shaded region in the plot.
Plotting Vertical Lines at Data Points
Sometimes, you may want to plot vertical lines at specific data points. Here’s how you can do that:
import matplotlib.pyplot as plt
import numpy as np

x = np.linspace(0, 10, 10)
y = np.random.rand(10)

fig, ax = plt.subplots()
ax.plot(x, y, 'o-')
for i in range(len(x)):
    ax.axvline(x=x[i], ymin=0, ymax=y[i], color='r', linestyle='--', alpha=0.5)
ax.set_title('Vertical Lines at Data Points - how2matplotlib.com')
plt.show()
Output:
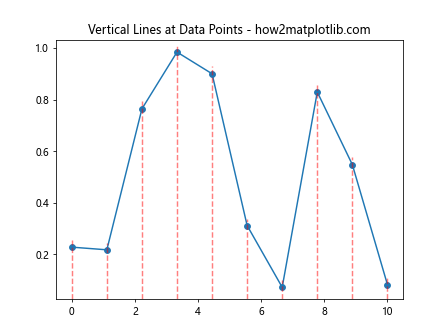
This code plots vertical lines from the x-axis to each data point in the plot.
Creating a Stem Plot with Vertical Lines
Stem plots are essentially a series of vertical lines with markers at the top. Here’s how to create one:
import matplotlib.pyplot as plt
import numpy as np

x = np.linspace(0, 2*np.pi, 10)
y = np.sin(x)

fig, ax = plt.subplots()
ax.stem(x, y)
ax.set_title('Stem Plot (Vertical Lines with Markers) - how2matplotlib.com')
plt.show()
Output:
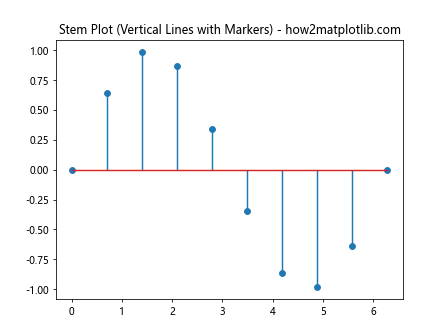
This example creates a stem plot, which uses vertical lines to represent data points.
Handling Multiple Subplots with Vertical Lines
When working with multiple subplots, you might want to add vertical lines to each subplot. Here’s how you can do that:
import matplotlib.pyplot as plt
import numpy as np

x = np.linspace(0, 10, 100)
y1 = np.sin(x)
y2 = np.cos(x)

fig, (ax1, ax2) = plt.subplots(2, 1, sharex=True)
ax1.plot(x, y1)
ax1.axvline(x=5, color='r', linestyle='--')
ax1.set_title('Subplot 1 - how2matplotlib.com')

ax2.plot(x, y2)
ax2.axvline(x=5, color='r', linestyle='--')
ax2.set_title('Subplot 2 - how2matplotlib.com')

plt.tight_layout()
plt.show()
Output:
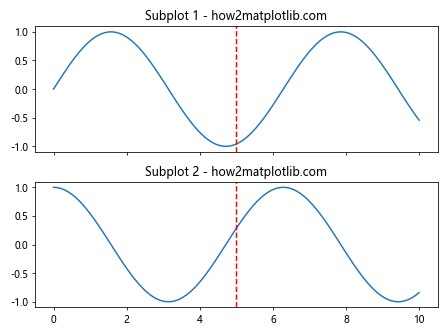
This example creates two subplots and adds a vertical line at x=5 to both of them.
Using Vertical Lines for Time Series Data
Vertical lines can be particularly useful when working with time series data. Here’s an example:
import matplotlib.pyplot as plt
import pandas as pd

# Create a sample time series
dates = pd.date_range(start='2023-01-01', end='2023-12-31', freq='D')
values = pd.Series(range(len(dates)), index=dates)

fig, ax = plt.subplots(figsize=(12, 6))
ax.plot(dates, values)
ax.axvline(x=pd.Timestamp('2023-07-01'), color='r', linestyle='--', label='Mid-year')
ax.legend()
ax.set_title('Time Series with Vertical Line - how2matplotlib.com')
plt.show()
Output:
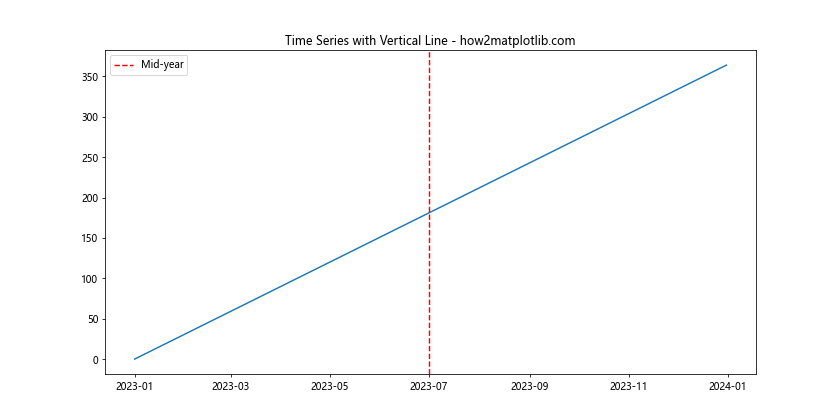
This example plots a time series and adds a vertical line to mark the middle of the year.
Customizing Vertical Lines with Annotations
You can enhance your plots by adding annotations to your vertical lines:
import matplotlib.pyplot as plt
import numpy as np

x = np.linspace(0, 10, 100)
y = np.sin(x)

fig, ax = plt.subplots()
ax.plot(x, y)
ax.axvline(x=5, color='r', linestyle='--')
ax.annotate('Important Point', xy=(5, 0), xytext=(5.5, 0.5),
            arrowprops=dict(facecolor='black', shrink=0.05))
ax.set_title('Vertical Line with Annotation - how2matplotlib.com')
plt.show()
Output:
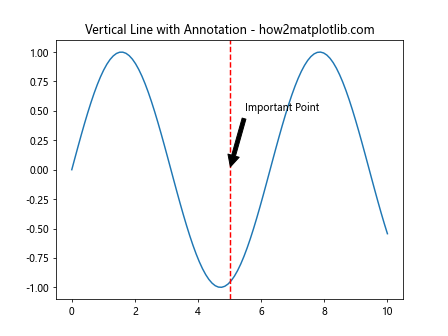
This example adds an annotation to explain the significance of the vertical line.
Using Vertical Lines to Highlight Data Ranges
Vertical lines can be used to highlight specific ranges of data:
import matplotlib.pyplot as plt
import numpy as np

x = np.linspace(0, 10, 100)
y = np.sin(x)

fig, ax = plt.subplots()
ax.plot(x, y)
ax.axvline(x=2, color='r', linestyle='--')
ax.axvline(x=8, color='r', linestyle='--')
ax.axvspan(2, 8, alpha=0.2, color='r')
ax.text(5, 0.5, 'Highlighted Range', ha='center')
ax.set_title('Highlighting Data Range - how2matplotlib.com')
plt.show()
Output:
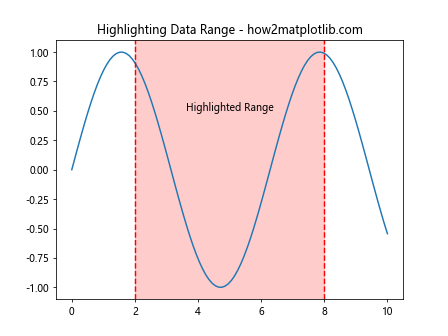
This example uses two vertical lines and a shaded area to highlight a specific range of data.
Combining Horizontal and Vertical Lines
Sometimes, you might want to combine horizontal and vertical lines to create a grid or highlight specific points:
import matplotlib.pyplot as plt
import numpy as np

x = np.linspace(0, 10, 100)
y = np.sin(x)

fig, ax = plt.subplots()
ax.plot(x, y)
ax.axvline(x=5, color='r', linestyle='--')
ax.axhline(y=0, color='g', linestyle='--')
ax.set_title('Combining Vertical and Horizontal Lines - how2matplotlib.com')
plt.show()
Output:
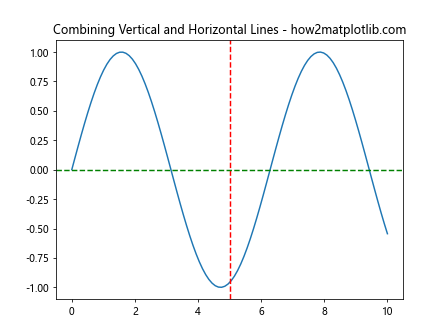
This example combines a vertical line and a horizontal line to highlight a specific point on the plot.
Using Vertical Lines in 3D Plots
Vertical lines can also be used in 3D plots. Here’s an example:
import matplotlib.pyplot as plt
import numpy as np

fig = plt.figure()
ax = fig.add_subplot(111, projection='3d')

x = np.linspace(-5, 5, 100)
y = np.linspace(-5, 5, 100)
X, Y = np.meshgrid(x, y)
Z = np.sin(np.sqrt(X**2 + Y**2))

ax.plot_surface(X, Y, Z, cmap='viridis')
ax.plot([0, 0], [0, 0], [-1, 1], 'r-', linewidth=2)
ax.set_title('3D Plot with Vertical Line - how2matplotlib.com')
plt.show()
Output:
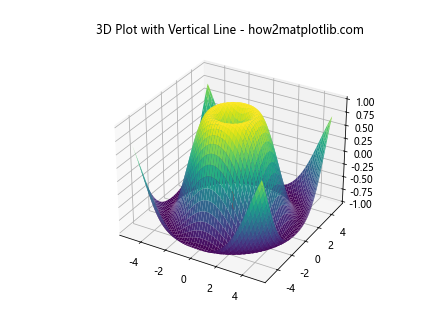
This example creates a 3D surface plot and adds a vertical line at the origin.
Conclusion
In this comprehensive guide, we’ve explored numerous ways to plot a vertical line in Matplotlib. From basic techniques to advanced customizations, we’ve covered a wide range of methods to help you effectively use vertical lines in your data visualizations. Remember, the key to mastering how to plot a vertical line in Matplotlib is practice and experimentation. Try out these examples, modify them, and incorporate vertical lines into your own plots to enhance their clarity and informativeness.
Whether you’re using vertical lines to highlight specific data points, separate regions of a plot, or create more complex visualizations, Matplotlib provides a flexible and powerful set of tools to help you achieve your goals. By understanding how to plot a vertical line in Matplotlib and combining this knowledge with other plotting techniques, you’ll be well-equipped to create compelling and insightful data visualizations.