How to Plot a Point or a Line on an Image with Matplotlib
Plot a Point or a Line on an Image with Matplotlib is a powerful technique that allows you to enhance your data visualization by overlaying points or lines on existing images. This article will provide a detailed exploration of various methods to plot points and lines on images using Matplotlib, one of the most popular plotting libraries in Python. We’ll cover everything from basic concepts to advanced techniques, ensuring you have a thorough understanding of how to plot a point or a line on an image with Matplotlib.
Understanding the Basics of Plotting Points and Lines on Images with Matplotlib
Before we dive into the specifics of how to plot a point or a line on an image with Matplotlib, it’s essential to understand the fundamental concepts. Matplotlib is a versatile library that allows you to create a wide range of visualizations, including plotting points and lines on images. When you plot a point or a line on an image with Matplotlib, you’re essentially overlaying graphical elements on top of an existing image.
To get started with plotting points and lines on images, you’ll need to import the necessary libraries and load an image. Here’s a basic example to illustrate this:
import matplotlib.pyplot as plt
import numpy as np
from PIL import Image

# Load the image
image = Image.open("how2matplotlib.com_sample_image.jpg")

# Convert the image to a numpy array
img_array = np.array(image)

# Create a figure and axis
fig, ax = plt.subplots()

# Display the image
ax.imshow(img_array)

# Show the plot
plt.show()
Output:

In this example, we’ve loaded an image and displayed it using Matplotlib. This serves as the foundation for plotting points and lines on the image.
Plotting a Single Point on an Image with Matplotlib
Now that we understand the basics, let’s explore how to plot a point or a line on an image with Matplotlib, starting with plotting a single point. To plot a point on an image, we use the plot() function with specific coordinates. Here’s an example:
import matplotlib.pyplot as plt
import numpy as np
from PIL import Image

# Load the image
image = Image.open("how2matplotlib.com_sample_image.jpg")
img_array = np.array(image)

# Create a figure and axis
fig, ax = plt.subplots()

# Display the image
ax.imshow(img_array)

# Plot a single point
ax.plot(100, 100, 'ro', markersize=10)

# Add a title
plt.title("Plot a Point on an Image with Matplotlib")

# Show the plot
plt.show()
Output:

In this example, we’ve plotted a single red point at coordinates (100, 100) on the image. The ‘ro’ argument specifies a red circle marker, and markersize=10 sets the size of the point.
Plotting Multiple Points on an Image with Matplotlib
When you want to plot a point or a line on an image with Matplotlib, you’re not limited to just one point. You can plot multiple points simultaneously. Here’s how you can plot multiple points on an image:
import matplotlib.pyplot as plt
import numpy as np
from PIL import Image

# Load the image
image = Image.open("how2matplotlib.com_sample_image.jpg")
img_array = np.array(image)

# Create a figure and axis
fig, ax = plt.subplots()

# Display the image
ax.imshow(img_array)

# Plot multiple points
x_coords = [50, 100, 150, 200]
y_coords = [50, 100, 150, 200]
ax.plot(x_coords, y_coords, 'bo', markersize=8)

# Add a title
plt.title("Plot Multiple Points on an Image with Matplotlib")

# Show the plot
plt.show()
Output:
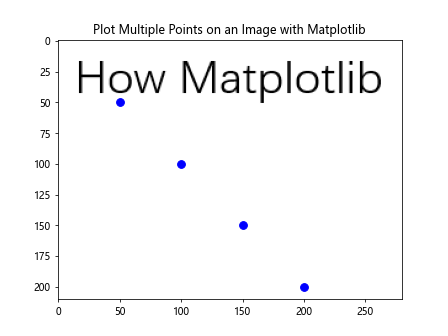
In this example, we’ve plotted four blue points on the image using lists of x and y coordinates. This technique is useful when you need to plot a point or a line on an image with Matplotlib at multiple locations.
Customizing Point Appearance when Plotting on an Image with Matplotlib
When you plot a point or a line on an image with Matplotlib, you have various options to customize the appearance of the points. Let’s explore some of these customization options:
import matplotlib.pyplot as plt
import numpy as np
from PIL import Image

# Load the image
image = Image.open("how2matplotlib.com_sample_image.jpg")
img_array = np.array(image)

# Create a figure and axis
fig, ax = plt.subplots()

# Display the image
ax.imshow(img_array)

# Plot points with different colors, sizes, and shapes
ax.plot(50, 50, 'ro', markersize=15)  # Red circle
ax.plot(100, 100, 'g^', markersize=12)  # Green triangle
ax.plot(150, 150, 'bs', markersize=10)  # Blue square
ax.plot(200, 200, 'y*', markersize=14)  # Yellow star

# Add a title
plt.title("Customized Points on an Image with Matplotlib")

# Show the plot
plt.show()
Output:
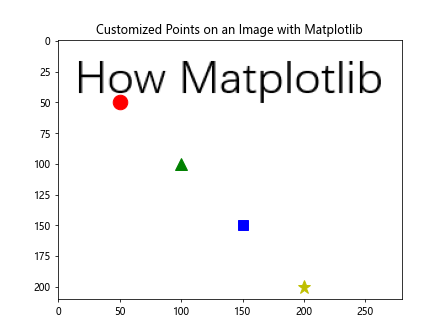
In this example, we’ve demonstrated how to plot a point or a line on an image with Matplotlib using different colors, sizes, and shapes. This level of customization allows you to create visually distinct points on your image.
Plotting a Single Line on an Image with Matplotlib
Now that we’ve covered plotting points, let’s move on to plotting lines on images. To plot a line on an image with Matplotlib, you need to specify the start and end coordinates of the line. Here’s an example:
import matplotlib.pyplot as plt
import numpy as np
from PIL import Image

# Load the image
image = Image.open("how2matplotlib.com_sample_image.jpg")
img_array = np.array(image)

# Create a figure and axis
fig, ax = plt.subplots()

# Display the image
ax.imshow(img_array)

# Plot a single line
ax.plot([50, 200], [50, 200], 'r-', linewidth=2)

# Add a title
plt.title("Plot a Line on an Image with Matplotlib")

# Show the plot
plt.show()
Output:
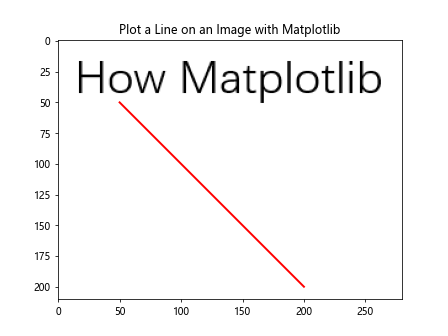
In this example, we’ve plotted a single red line from coordinates (50, 50) to (200, 200) on the image. The ‘r-‘ argument specifies a red solid line, and linewidth=2 sets the thickness of the line.
Plotting Multiple Lines on an Image with Matplotlib
When you plot a point or a line on an image with Matplotlib, you can also plot multiple lines simultaneously. Here’s how you can achieve this:
import matplotlib.pyplot as plt
import numpy as np
from PIL import Image

# Load the image
image = Image.open("how2matplotlib.com_sample_image.jpg")
img_array = np.array(image)

# Create a figure and axis
fig, ax = plt.subplots()

# Display the image
ax.imshow(img_array)

# Plot multiple lines
ax.plot([50, 200], [50, 200], 'r-', linewidth=2)
ax.plot([50, 200], [200, 50], 'b-', linewidth=2)
ax.plot([100, 150], [100, 150], 'g-', linewidth=2)

# Add a title
plt.title("Plot Multiple Lines on an Image with Matplotlib")

# Show the plot
plt.show()
Output:
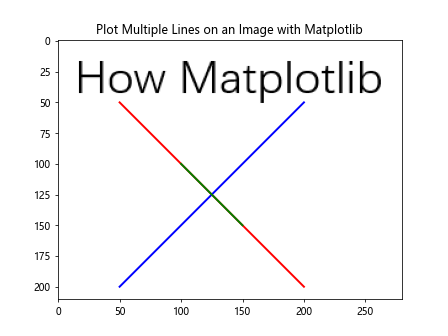
In this example, we’ve plotted three lines of different colors on the image. This technique is useful when you need to plot a point or a line on an image with Matplotlib to show multiple relationships or paths.
Customizing Line Appearance when Plotting on an Image with Matplotlib
Just as with points, you have various options to customize the appearance of lines when you plot a point or a line on an image with Matplotlib. Let’s explore some of these customization options:
import matplotlib.pyplot as plt
import numpy as np
from PIL import Image

# Load the image
image = Image.open("how2matplotlib.com_sample_image.jpg")
img_array = np.array(image)

# Create a figure and axis
fig, ax = plt.subplots()

# Display the image
ax.imshow(img_array)

# Plot lines with different styles, colors, and widths
ax.plot([50, 200], [50, 50], 'r-', linewidth=2)  # Solid red line
ax.plot([50, 200], [100, 100], 'b--', linewidth=3)  # Dashed blue line
ax.plot([50, 200], [150, 150], 'g:', linewidth=4)  # Dotted green line
ax.plot([50, 200], [200, 200], 'y-.', linewidth=2)  # Dash-dot yellow line

# Add a title
plt.title("Customized Lines on an Image with Matplotlib")

# Show the plot
plt.show()
Output:
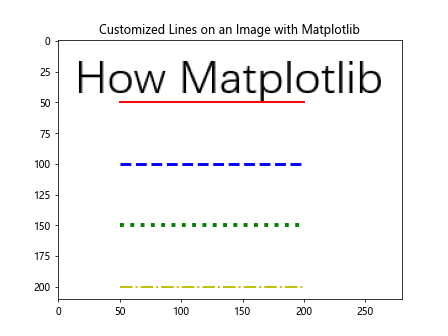
In this example, we’ve demonstrated how to plot a point or a line on an image with Matplotlib using different line styles, colors, and widths. This level of customization allows you to create visually distinct lines on your image.
Combining Points and Lines on an Image with Matplotlib
One of the powerful features when you plot a point or a line on an image with Matplotlib is the ability to combine both points and lines in a single visualization. This can be particularly useful for highlighting specific locations along a path or showing the relationship between discrete points and continuous lines. Here’s an example of how to combine points and lines:
import matplotlib.pyplot as plt
import numpy as np
from PIL import Image

# Load the image
image = Image.open("how2matplotlib.com_sample_image.jpg")
img_array = np.array(image)

# Create a figure and axis
fig, ax = plt.subplots()

# Display the image
ax.imshow(img_array)

# Plot a line
ax.plot([50, 200], [50, 200], 'r-', linewidth=2)

# Plot points along the line
ax.plot([50, 125, 200], [50, 125, 200], 'bo', markersize=8)

# Add a title
plt.title("Combining Points and Lines on an Image with Matplotlib")

# Show the plot
plt.show()
Output:
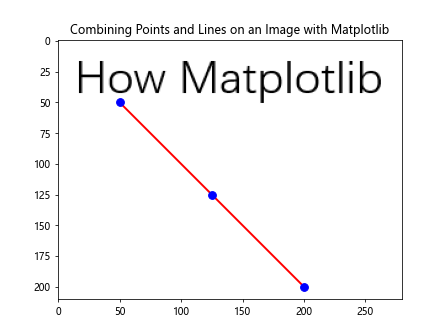
In this example, we’ve plotted a red line and then added blue points along the line. This technique allows you to emphasize specific locations along a path when you plot a point or a line on an image with Matplotlib.
Adding Annotations when Plotting Points or Lines on an Image with Matplotlib
When you plot a point or a line on an image with Matplotlib, adding annotations can provide additional context or information about specific points or lines. Matplotlib offers various ways to add text annotations to your plots. Here’s an example:
import matplotlib.pyplot as plt
import numpy as np
from PIL import Image

# Load the image
image = Image.open("how2matplotlib.com_sample_image.jpg")
img_array = np.array(image)

# Create a figure and axis
fig, ax = plt.subplots()

# Display the image
ax.imshow(img_array)

# Plot a point and a line
ax.plot(100, 100, 'ro', markersize=10)
ax.plot([50, 200], [150, 150], 'b-', linewidth=2)

# Add annotations
ax.annotate('Important Point', xy=(100, 100), xytext=(120, 80),
            arrowprops=dict(facecolor='black', shrink=0.05))
ax.text(125, 160, 'Significant Line', fontsize=10, color='blue')

# Add a title
plt.title("Annotated Points and Lines on an Image with Matplotlib")

# Show the plot
plt.show()
Output:

In this example, we’ve added an annotation with an arrow pointing to the red point and a text label for the blue line. This technique enhances the information conveyed when you plot a point or a line on an image with Matplotlib.
Using Different Coordinate Systems when Plotting on an Image with Matplotlib
When you plot a point or a line on an image with Matplotlib, it’s important to understand that you can work with different coordinate systems. By default, Matplotlib uses pixel coordinates, where (0, 0) is the top-left corner of the image. However, you can also use data coordinates or normalized coordinates. Here’s an example demonstrating the use of different coordinate systems:
import matplotlib.pyplot as plt
import numpy as np
from PIL import Image

# Load the image
image = Image.open("how2matplotlib.com_sample_image.jpg")
img_array = np.array(image)

# Create a figure and axis
fig, ax = plt.subplots()

# Display the image
ax.imshow(img_array)

# Plot points using different coordinate systems
ax.plot(100, 100, 'ro', markersize=10)  # Pixel coordinates
ax.plot(0.5, 0.5, 'bo', markersize=10, transform=ax.transAxes)  # Normalized coordinates

# Add a title
plt.title("Different Coordinate Systems on an Image with Matplotlib")

# Show the plot
plt.show()
Output:

In this example, we’ve plotted two points: one using pixel coordinates and another using normalized coordinates. Understanding these coordinate systems is crucial when you plot a point or a line on an image with Matplotlib, especially when working with images of different sizes.
Handling Image Aspect Ratio when Plotting Points or Lines
When you plot a point or a line on an image with Matplotlib, it’s important to consider the aspect ratio of the image to ensure that your points and lines appear correctly positioned. Matplotlib provides ways to handle this. Here’s an example:
import matplotlib.pyplot as plt
import numpy as np
from PIL import Image

# Load the image
image = Image.open("how2matplotlib.com_sample_image.jpg")
img_array = np.array(image)

# Create a figure and axis
fig, ax = plt.subplots()

# Display the image and set aspect ratio
ax.imshow(img_array, aspect='equal')

# Plot points and lines
ax.plot(100, 100, 'ro', markersize=10)
ax.plot([50, 200], [50, 200], 'b-', linewidth=2)

# Add a title
plt.title("Handling Aspect Ratio when Plotting on an Image with Matplotlib")

# Show the plot
plt.show()
Output:
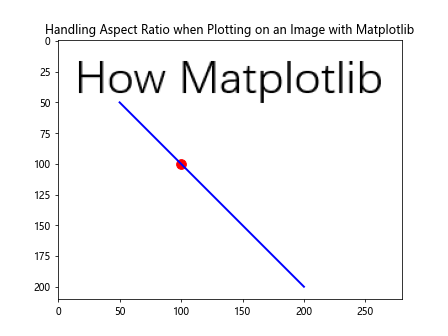
In this example, we’ve used aspect='equal' to ensure that the aspect ratio of the image is preserved when we plot a point or a line on an image with Matplotlib. This is particularly important for maintaining the correct positioning and proportions of your plotted elements.
Creating Interactive Plots when Adding Points or Lines to Images
When you plot a point or a line on an image with Matplotlib, you can enhance the user experience by making your plots interactive. Matplotlib provides tools for creating interactive plots that allow users to zoom, pan, and get more information about specific points or lines. Here’s an example of how to create an interactive plot:
import matplotlib.pyplot as plt
import numpy as np
from PIL import Image
from matplotlib.widgets import Button

# Load the image
image = Image.open("how2matplotlib.com_sample_image.jpg")
img_array = np.array(image)

# Create a figure and axis
fig, ax = plt.subplots()

# Display the image
ax.imshow(img_array)

# Initialize an empty list to store points
points = []

# Function to add points on click
def onclick(event):
    if event.inaxes == ax:
        x, y = event.xdata, event.ydata
        points.append((x, y))
        ax.plot(x, y, 'ro', markersize=8)
        fig.canvas.draw()

# Connect the click event to the function
fig.canvas.mpl_connect('button_press_event', onclick)

# Add a title
plt.title("Interactive Point Plotting on an Image with Matplotlib")

# Show the plot
plt.show()
Output:

In this example, we’ve created an interactive plot where users can click on the image to add points. This level of interactivity can be very useful when you need to manually plot a point or a line on an image with Matplotlib.