Comprehensive Guide to Matplotlib.axis.Axis.get_snap() Function in Python
Matplotlib.axis.Axis.get_snap() function in Python is an essential tool for managing the snapping behavior of axis ticks in Matplotlib plots. This function is part of the Matplotlib library, which is widely used for creating static, animated, and interactive visualizations in Python. In this comprehensive guide, we’ll explore the Matplotlib.axis.Axis.get_snap() function in detail, covering its usage, parameters, return values, and practical applications. We’ll also provide numerous examples to help you understand how to effectively use this function in your data visualization projects.
Understanding the Matplotlib.axis.Axis.get_snap() Function
The Matplotlib.axis.Axis.get_snap() function is a method of the Axis class in Matplotlib. Its primary purpose is to retrieve the current snapping setting for the axis ticks. Snapping refers to the behavior where tick locations are adjusted to fall on exact pixel boundaries, which can result in cleaner and more visually appealing plots.
Let’s start with a simple example to demonstrate how to use the Matplotlib.axis.Axis.get_snap() function:
import matplotlib.pyplot as plt

# Create a figure and axis
fig, ax = plt.subplots()

# Get the current snap setting for the x-axis
snap_setting = ax.xaxis.get_snap()

# Print the snap setting
print(f"Current snap setting for x-axis: {snap_setting}")

plt.title("Matplotlib.axis.Axis.get_snap() Example - how2matplotlib.com")
plt.show()
Output:
In this example, we create a simple plot and use the get_snap() function to retrieve the current snap setting for the x-axis. The function returns a boolean value indicating whether snapping is enabled (True) or disabled (False).
The Importance of Matplotlib.axis.Axis.get_snap() in Data Visualization
The Matplotlib.axis.Axis.get_snap() function plays a crucial role in creating precise and visually appealing plots. By understanding and controlling the snapping behavior of axis ticks, you can ensure that your visualizations are rendered accurately and consistently across different devices and display resolutions.
Here’s an example that demonstrates the importance of snap settings:
import matplotlib.pyplot as plt
import numpy as np

# Create sample data
x = np.linspace(0, 10, 100)
y = np.sin(x)

# Create a figure and axis
fig, (ax1, ax2) = plt.subplots(1, 2, figsize=(12, 5))

# Plot with default snap setting
ax1.plot(x, y)
ax1.set_title(f"Default Snap: {ax1.xaxis.get_snap()} - how2matplotlib.com")

# Plot with snap disabled
ax2.plot(x, y)
ax2.xaxis.set_snap(False)
ax2.set_title(f"Snap Disabled: {ax2.xaxis.get_snap()} - how2matplotlib.com")

plt.tight_layout()
plt.show()
Output:
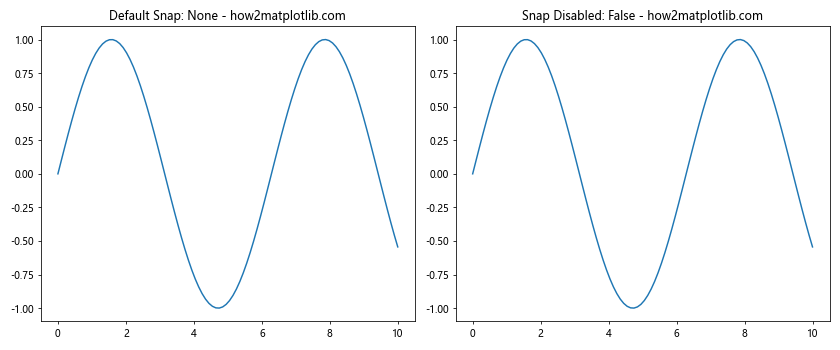
In this example, we create two subplots: one with the default snap setting and another with snap disabled. By comparing the two plots, you can observe the difference in tick placement and overall visual appearance.
Exploring the Return Value of Matplotlib.axis.Axis.get_snap()
The Matplotlib.axis.Axis.get_snap() function returns a boolean value that indicates the current snap setting for the axis. Let’s examine the possible return values and their meanings:
- True: Snapping is enabled, and tick locations will be adjusted to fall on exact pixel boundaries.
- False: Snapping is disabled, and tick locations will be placed at their exact mathematical positions.
Here’s an example that demonstrates how to interpret the return value:
import matplotlib.pyplot as plt

# Create a figure and axis
fig, ax = plt.subplots()

# Get the current snap setting for both x and y axes
x_snap = ax.xaxis.get_snap()
y_snap = ax.yaxis.get_snap()

# Print the snap settings
print(f"X-axis snap setting: {x_snap}")
print(f"Y-axis snap setting: {y_snap}")

# Interpret the results
if x_snap and y_snap:
    print("Both axes have snapping enabled.")
elif x_snap:
    print("Only the x-axis has snapping enabled.")
elif y_snap:
    print("Only the y-axis has snapping enabled.")
else:
    print("Snapping is disabled for both axes.")

plt.title("Interpreting get_snap() Return Values - how2matplotlib.com")
plt.show()
Output:

This example retrieves the snap settings for both the x and y axes and interprets the results to provide a clear understanding of the current snapping behavior.
Using Matplotlib.axis.Axis.get_snap() with Different Plot Types
The Matplotlib.axis.Axis.get_snap() function can be used with various plot types in Matplotlib. Let’s explore how to use this function with different visualization styles:
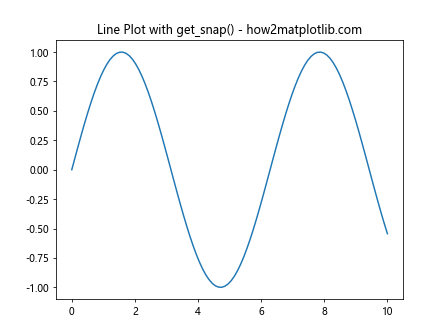
Line Plots
import matplotlib.pyplot as plt
import numpy as np

# Create sample data
x = np.linspace(0, 10, 100)
y = np.sin(x)

# Create a figure and axis
fig, ax = plt.subplots()

# Create a line plot
ax.plot(x, y)

# Get and print the snap setting
snap_setting = ax.xaxis.get_snap()
print(f"Snap setting for line plot: {snap_setting}")

plt.title("Line Plot with get_snap() - how2matplotlib.com")
plt.show()
Output:
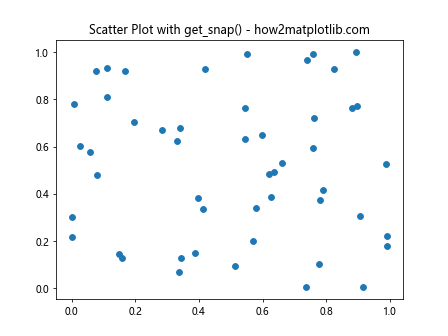
Scatter Plots
import matplotlib.pyplot as plt
import numpy as np

# Create sample data
x = np.random.rand(50)
y = np.random.rand(50)

# Create a figure and axis
fig, ax = plt.subplots()

# Create a scatter plot
ax.scatter(x, y)

# Get and print the snap setting
snap_setting = ax.xaxis.get_snap()
print(f"Snap setting for scatter plot: {snap_setting}")

plt.title("Scatter Plot with get_snap() - how2matplotlib.com")
plt.show()
Output:
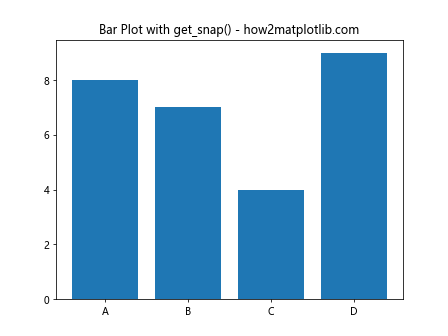
Bar Plots
import matplotlib.pyplot as plt
import numpy as np

# Create sample data
categories = ['A', 'B', 'C', 'D']
values = np.random.randint(1, 10, len(categories))

# Create a figure and axis
fig, ax = plt.subplots()

# Create a bar plot
ax.bar(categories, values)

# Get and print the snap setting
snap_setting = ax.xaxis.get_snap()
print(f"Snap setting for bar plot: {snap_setting}")

plt.title("Bar Plot with get_snap() - how2matplotlib.com")
plt.show()
Output:
Combining Matplotlib.axis.Axis.get_snap() with Other Axis Methods
The Matplotlib.axis.Axis.get_snap() function can be used in conjunction with other axis methods to create more complex and customized visualizations. Let’s explore some examples:
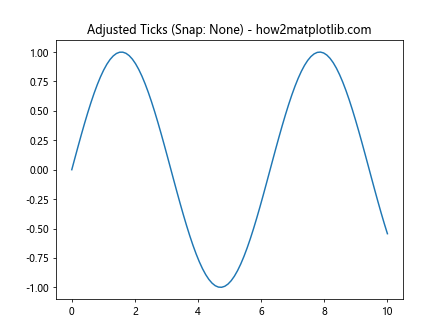
Adjusting Tick Locations
import matplotlib.pyplot as plt
import numpy as np

# Create sample data
x = np.linspace(0, 10, 100)
y = np.sin(x)

# Create a figure and axis
fig, ax = plt.subplots()

# Plot the data
ax.plot(x, y)

# Get the current snap setting
snap_setting = ax.xaxis.get_snap()

# Adjust tick locations based on snap setting
if snap_setting:
    ax.xaxis.set_major_locator(plt.MultipleLocator(1))
else:
    ax.xaxis.set_major_locator(plt.AutoLocator())

plt.title(f"Adjusted Ticks (Snap: {snap_setting}) - how2matplotlib.com")
plt.show()
Output:
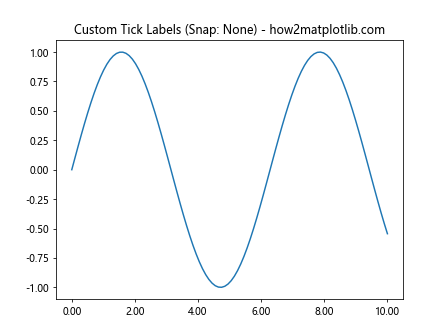
Customizing Tick Labels
import matplotlib.pyplot as plt
import numpy as np

# Create sample data
x = np.linspace(0, 10, 100)
y = np.sin(x)

# Create a figure and axis
fig, ax = plt.subplots()

# Plot the data
ax.plot(x, y)

# Get the current snap setting
snap_setting = ax.xaxis.get_snap()

# Customize tick labels based on snap setting
if snap_setting:
    ax.xaxis.set_major_formatter(plt.FuncFormatter(lambda x, p: f"{x:.1f}"))
else:
    ax.xaxis.set_major_formatter(plt.FuncFormatter(lambda x, p: f"{x:.2f}"))

plt.title(f"Custom Tick Labels (Snap: {snap_setting}) - how2matplotlib.com")
plt.show()
Output:
Advanced Applications of Matplotlib.axis.Axis.get_snap()
Now that we’ve covered the basics of the Matplotlib.axis.Axis.get_snap() function, let’s explore some advanced applications and techniques:
Dynamic Snap Adjustment
import matplotlib.pyplot as plt
import numpy as np

# Create sample data
x = np.linspace(0, 10, 100)
y = np.sin(x)

# Create a figure and axis
fig, ax = plt.subplots()

# Plot the data
line, = ax.plot(x, y)

# Function to toggle snap and update plot
def toggle_snap(event):
    current_snap = ax.xaxis.get_snap()
    ax.xaxis.set_snap(not current_snap)
    ax.set_title(f"Snap: {not current_snap} - how2matplotlib.com")
    fig.canvas.draw()

# Connect the toggle function to a key press event
fig.canvas.mpl_connect('key_press_event', toggle_snap)

plt.title(f"Press any key to toggle snap - how2matplotlib.com")
plt.show()
Output:
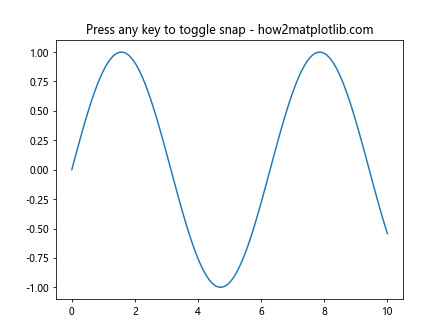
This example demonstrates how to create an interactive plot where the user can toggle the snap setting by pressing any key.
Snap-Aware Annotations
import matplotlib.pyplot as plt
import numpy as np

# Create sample data
x = np.linspace(0, 10, 100)
y = np.sin(x)

# Create a figure and axis
fig, ax = plt.subplots()

# Plot the data
ax.plot(x, y)

# Get the current snap setting
snap_setting = ax.xaxis.get_snap()

# Add snap-aware annotations
if snap_setting:
    ax.annotate("Snapped", xy=(5, 0), xytext=(5, 0.5),
                arrowprops=dict(arrowstyle="->"))
else:
    ax.annotate("Not Snapped", xy=(5, 0), xytext=(5, 0.5),
                arrowprops=dict(arrowstyle="->", linestyle="--"))

plt.title(f"Snap-Aware Annotations - how2matplotlib.com")
plt.show()
Output:
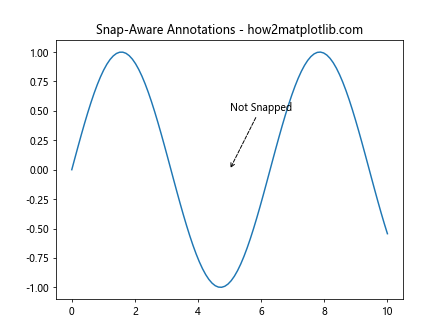
This example shows how to create annotations that adapt to the current snap setting, providing visual cues about the plot’s behavior.
Best Practices for Using Matplotlib.axis.Axis.get_snap()
When working with the Matplotlib.axis.Axis.get_snap() function, it’s important to follow some best practices to ensure optimal results:
- Check snap settings before making axis adjustments
- Use snap settings consistently across related plots
- Consider the impact of snap settings on data accuracy
- Document snap settings in plot metadata or captions
Here’s an example that demonstrates these best practices:
import matplotlib.pyplot as plt
import numpy as np

def create_plot(ax, data, title):
    ax.plot(data)
    snap_setting = ax.xaxis.get_snap()
    ax.set_title(f"{title} (Snap: {snap_setting}) - how2matplotlib.com")

    # Adjust ticks based on snap setting
    if snap_setting:
        ax.xaxis.set_major_locator(plt.MultipleLocator(1))
    else:
        ax.xaxis.set_major_locator(plt.AutoLocator())

    # Add metadata about snap setting
    ax.text(0.5, -0.1, f"Snap: {snap_setting}", transform=ax.transAxes, ha='center')

# Create sample data
data1 = np.random.randn(100).cumsum()
data2 = np.random.randn(100).cumsum()

# Create a figure with two subplots
fig, (ax1, ax2) = plt.subplots(1, 2, figsize=(12, 5))

# Create plots with consistent snap settings
create_plot(ax1, data1, "Plot 1")
create_plot(ax2, data2, "Plot 2")

plt.tight_layout()
plt.show()
Output:
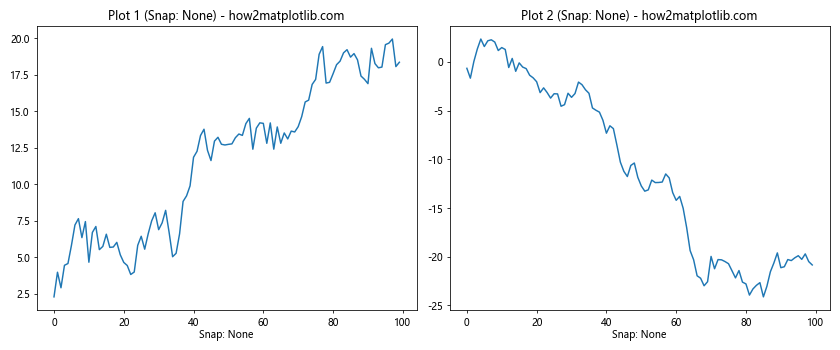
This example demonstrates how to create multiple plots with consistent snap settings, adjust ticks accordingly, and document the snap settings in the plot metadata.
Troubleshooting Common Issues with Matplotlib.axis.Axis.get_snap()
When working with the Matplotlib.axis.Axis.get_snap() function, you may encounter some common issues. Here are some troubleshooting tips:
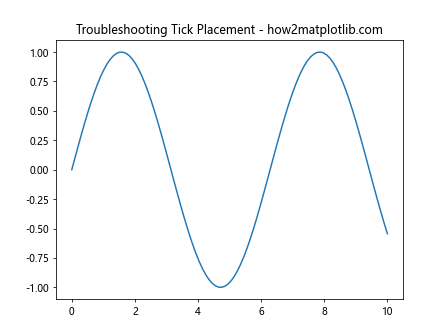
Issue 1: Unexpected Tick Placement
If you notice that ticks are not placed where you expect them to be, it could be due to the current snap setting. Here’s how to diagnose and fix this issue:
import matplotlib.pyplot as plt
import numpy as np

# Create sample data
x = np.linspace(0, 10, 100)
y = np.sin(x)

# Create a figure and axis
fig, ax = plt.subplots()

# Plot the data
ax.plot(x, y)

# Check the current snap setting
snap_setting = ax.xaxis.get_snap()
print(f"Current snap setting: {snap_setting}")

# If ticks are not placed as expected, try toggling the snap setting
if snap_setting:
    ax.xaxis.set_snap(False)
else:
    ax.xaxis.set_snap(True)

print(f"New snap setting: {ax.xaxis.get_snap()}")

plt.title("Troubleshooting Tick Placement - how2matplotlib.com")
plt.show()
Output:
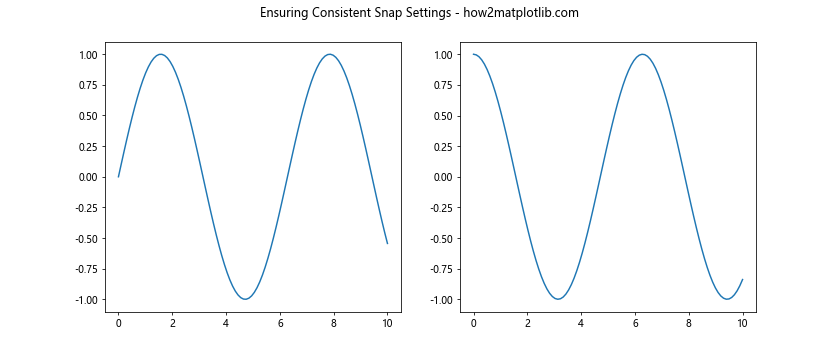
Issue 2: Inconsistent Appearance Across Subplots
If you have multiple subplots with inconsistent appearances, it could be due to different snap settings. Here’s how to ensure consistency:
import matplotlib.pyplot as plt
import numpy as np

# Create sample data
x = np.linspace(0, 10, 100)
y1 = np.sin(x)
y2 = np.cos(x)

# Create a figure with two subplots
fig, (ax1, ax2) = plt.subplots(1, 2, figsize=(12, 5))

# Plot the data
ax1.plot(x, y1)
ax2.plot(x, y2)

# Check and align snap settings
snap1 = ax1.xaxis.get_snap()
snap2 = ax2.xaxis.get_snap()

if snap1 != snap2:
    print("Inconsistent snap settings detected. Aligning...")
    ax2.xaxis.set_snap(snap1)

print(f"Subplot 1 snap: {ax1.xaxis.get_snap()}")
print(f"Subplot 2 snap: {ax2.xaxis.get_snap()}")

plt.suptitle("Ensuring Consistent Snap Settings - how2matplotlib.com")
plt.show()
Output:
Comparing Matplotlib.axis.Axis.get_snap() with Other Axis Methods
To fully understand the Matplotlib.axis.Axis.get_snap() function, it’s helpful to compare it with other related axis methods. Let’s explore some comparisons:
get_snap() vs. set_snap()
While get_snap() retrieves the current snap setting, set_snap() allows you to change it. Here’s an example comparing these two methods:
import matplotlib.pyplot as plt
import numpy as np

# Create sample data
x = np.linspace(0, 10, 100)
y = np.sin(x)

# Create a figure and axis
fig,ax = plt.subplots()

# Plot the data
ax.plot(x, y)

# Get the current snap setting
current_snap = ax.xaxis.get_snap()
print(f"Current snap setting: {current_snap}")

# Change the snap setting
new_snap = not current_snap
ax.xaxis.set_snap(new_snap)

# Verify the new setting
updated_snap = ax.xaxis.get_snap()
print(f"Updated snap setting: {updated_snap}")

plt.title("get_snap() vs. set_snap() - how2matplotlib.com")
plt.show()
Output:
This example demonstrates how to use get_snap() to retrieve the current setting and set_snap() to change it.
get_snap() vs. get_tick_params()
The get_tick_params() method provides information about various tick parameters, including the snap setting. Here’s a comparison:
import matplotlib.pyplot as plt
import numpy as np

# Create sample data
x = np.linspace(0, 10, 100)
y = np.sin(x)

# Create a figure and axis
fig, ax = plt.subplots()

# Plot the data
ax.plot(x, y)

# Get snap setting using get_snap()
snap_setting = ax.xaxis.get_snap()
print(f"Snap setting from get_snap(): {snap_setting}")

# Get tick parameters using get_tick_params()
tick_params = ax.xaxis.get_tick_params(which='major')
print(f"Snap setting from get_tick_params(): {tick_params.get('snap', None)}")

plt.title("get_snap() vs. get_tick_params() - how2matplotlib.com")
plt.show()
Output:
This example shows how to retrieve the snap setting using both get_snap() and get_tick_params(), highlighting the differences between these methods.
Integrating Matplotlib.axis.Axis.get_snap() with Other Libraries
The Matplotlib.axis.Axis.get_snap() function can be integrated with other popular data science and visualization libraries to create more complex and informative visualizations. Here are some examples:
Integration with Pandas
import matplotlib.pyplot as plt
import pandas as pd
import numpy as np

# Create a sample DataFrame
df = pd.DataFrame({
    'Date': pd.date_range(start='2023-01-01', periods=100),
    'Value': np.random.randn(100).cumsum()
})

# Create a figure and axis
fig, ax = plt.subplots(figsize=(10, 5))

# Plot the data
df.plot(x='Date', y='Value', ax=ax)

# Get and display the snap setting
snap_setting = ax.xaxis.get_snap()
ax.set_title(f"Pandas Plot with Snap: {snap_setting} - how2matplotlib.com")

plt.show()
Output:
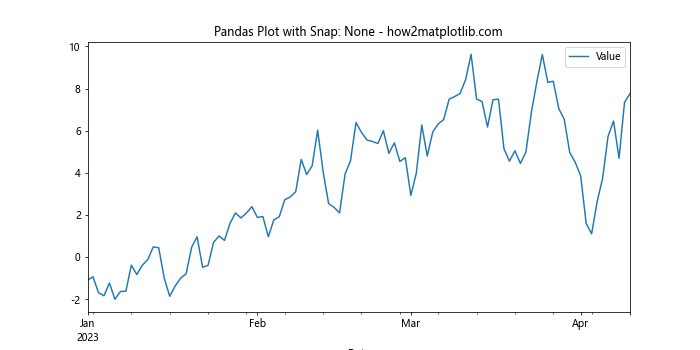
This example demonstrates how to use Matplotlib.axis.Axis.get_snap() with a Pandas DataFrame plot.
Integration with Seaborn
import matplotlib.pyplot as plt
import seaborn as sns
import numpy as np

# Set the Seaborn style
sns.set_style("whitegrid")

# Create sample data
x = np.linspace(0, 10, 100)
y = np.sin(x) + np.random.normal(0, 0.1, 100)

# Create a figure and axis
fig, ax = plt.subplots(figsize=(10, 5))

# Create a Seaborn plot
sns.scatterplot(x=x, y=y, ax=ax)

# Get and display the snap setting
snap_setting = ax.xaxis.get_snap()
ax.set_title(f"Seaborn Plot with Snap: {snap_setting} - how2matplotlib.com")

plt.show()
Output:
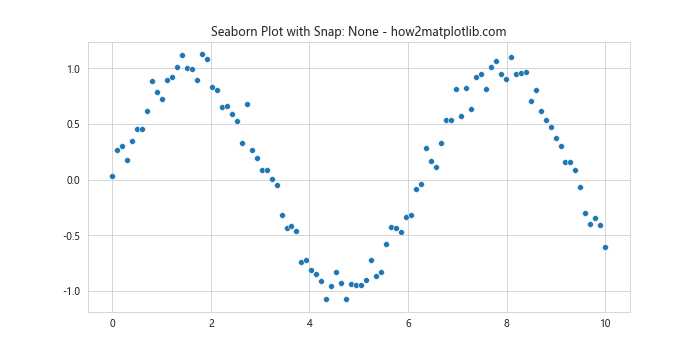
This example shows how to integrate Matplotlib.axis.Axis.get_snap() with a Seaborn plot.
Future Developments and Alternatives to Matplotlib.axis.Axis.get_snap()
While the Matplotlib.axis.Axis.get_snap() function is a useful tool for managing axis tick snapping, it’s important to stay informed about future developments and alternative approaches. Here are some considerations:
- Future Matplotlib versions may introduce new methods or properties for managing snap settings.
- Other plotting libraries, such as Plotly or Bokeh, may offer different approaches to tick snapping and positioning.
- Custom tick locators and formatters can be used to achieve similar results without relying on snap settings.
Here’s an example demonstrating a custom approach to tick positioning:
import matplotlib.pyplot as plt
import numpy as np

class CustomLocator(plt.Locator):
    def __init__(self, num_ticks):
        self.num_ticks = num_ticks

    def __call__(self):
        vmin, vmax = self.axis.get_view_interval()
        return np.linspace(vmin, vmax, self.num_ticks)

# Create sample data
x = np.linspace(0, 10, 100)
y = np.sin(x)

# Create a figure and axis
fig, ax = plt.subplots(figsize=(10, 5))

# Plot the data
ax.plot(x, y)

# Use a custom locator instead of relying on snap settings
ax.xaxis.set_major_locator(CustomLocator(6))

plt.title("Custom Tick Positioning - how2matplotlib.com")
plt.show()
Output:
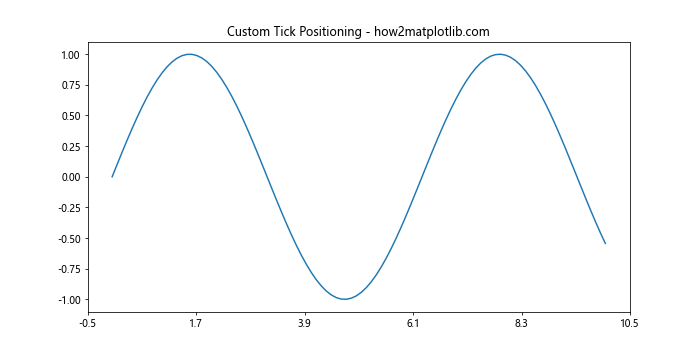
This example demonstrates how to use a custom tick locator to achieve precise tick positioning without relying on snap settings.
Conclusion
In this comprehensive guide, we’ve explored the Matplotlib.axis.Axis.get_snap() function in great detail. We’ve covered its basic usage, importance in data visualization, return values, and applications with different plot types. We’ve also discussed advanced techniques, best practices, troubleshooting tips, and comparisons with other axis methods.
The Matplotlib.axis.Axis.get_snap() function is a valuable tool for managing the visual precision of your plots. By understanding and effectively using this function, you can create more accurate and visually appealing data visualizations.