Comprehensive Guide to Matplotlib.axis.Axis.get_transform() Function in Python
Matplotlib.axis.Axis.get_transform() function in Python is an essential method for working with coordinate transformations in Matplotlib plots. This function is part of the Matplotlib library, which is widely used for creating static, animated, and interactive visualizations in Python. The get_transform() function specifically belongs to the Axis class within Matplotlib’s axis module. It plays a crucial role in retrieving the transformation object associated with an axis, allowing developers to manipulate and understand the coordinate system of their plots.
In this comprehensive guide, we’ll explore the Matplotlib.axis.Axis.get_transform() function in depth, covering its usage, applications, and providing numerous examples to illustrate its functionality. By the end of this article, you’ll have a thorough understanding of how to leverage this function to enhance your data visualization projects.
Understanding the Basics of Matplotlib.axis.Axis.get_transform()
Before diving into the specifics of the Matplotlib.axis.Axis.get_transform() function, it’s essential to grasp the concept of transformations in Matplotlib. Transformations are mathematical operations that convert coordinates from one system to another. In the context of Matplotlib, these transformations are crucial for mapping data points to their correct positions on a plot.
The get_transform() function returns the transformation object associated with an axis. This object encapsulates the mathematical operations required to convert between data coordinates and display coordinates. Understanding and manipulating these transformations can be particularly useful when working with complex plots or when you need to perform custom coordinate conversions.
Let’s start with a simple example to illustrate how to access the get_transform() function:
import matplotlib.pyplot as plt

# Create a figure and axis
fig, ax = plt.subplots()

# Get the transform object for the x-axis
x_transform = ax.xaxis.get_transform()

# Print information about the transform
print(f"Transform for x-axis: {x_transform}")

plt.title("How2matplotlib.com - Basic Transform Example")
plt.show()
Output:
In this example, we create a simple plot and retrieve the transform object for the x-axis using the get_transform() function. The resulting transform object contains information about how data coordinates are mapped to display coordinates for the x-axis.
Exploring the Return Value of Matplotlib.axis.Axis.get_transform()
The Matplotlib.axis.Axis.get_transform() function returns a Transform object, which is an instance of one of Matplotlib’s transformation classes. These classes are defined in the matplotlib.transforms module and include various types of transformations such as Affine2D, BlendedGenericTransform, and CompositeGenericTransform.
To better understand the return value, let’s examine the properties of the transform object:
import matplotlib.pyplot as plt

fig, ax = plt.subplots()

# Get the transform object for the y-axis
y_transform = ax.yaxis.get_transform()

# Print the type and properties of the transform
print(f"Type of transform: {type(y_transform)}")
print(f"Is the transform affine? {y_transform.is_affine}")
print(f"Is the transform separable? {y_transform.is_separable}")

plt.title("How2matplotlib.com - Transform Properties Example")
plt.show()
Output:
This example demonstrates how to retrieve and inspect the properties of the transform object returned by get_transform(). Understanding these properties can be helpful when working with custom transformations or when debugging coordinate-related issues in your plots.
Using Matplotlib.axis.Axis.get_transform() with Different Plot Types
The Matplotlib.axis.Axis.get_transform() function can be used with various types of plots in Matplotlib. Let’s explore how to use it with different plot types and understand its behavior in each context.
Line Plots
For line plots, the get_transform() function can be useful when you need to perform custom coordinate transformations. Here’s an example:
import matplotlib.pyplot as plt
import numpy as np

# Create data
x = np.linspace(0, 10, 100)
y = np.sin(x)

# Create a figure and axis
fig, ax = plt.subplots()

# Plot the data
ax.plot(x, y)

# Get the transform for the x-axis
x_transform = ax.xaxis.get_transform()

# Convert data coordinates to display coordinates
display_coords = x_transform.transform([(5, 0)])

print(f"Data coordinate (5, 0) in display coordinates: {display_coords}")

plt.title("How2matplotlib.com - Line Plot Transform Example")
plt.show()
Output:
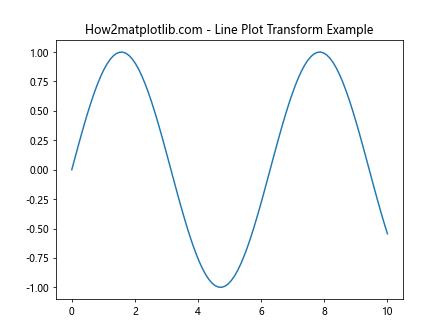
In this example, we create a simple sine wave plot and use the get_transform() function to convert a data coordinate to display coordinates. This can be particularly useful when you need to position annotations or custom elements on your plot.
Scatter Plots
The Matplotlib.axis.Axis.get_transform() function can also be applied to scatter plots. Here’s an example that demonstrates its use:
import matplotlib.pyplot as plt
import numpy as np

# Create random data
np.random.seed(42)
x = np.random.rand(50)
y = np.random.rand(50)

# Create a figure and axis
fig, ax = plt.subplots()

# Create a scatter plot
scatter = ax.scatter(x, y, c=y, cmap='viridis')

# Get the transform for the y-axis
y_transform = ax.yaxis.get_transform()

# Convert a range of data coordinates to display coordinates
data_coords = np.array([(0, 0), (0, 0.5), (0, 1)])
display_coords = y_transform.transform(data_coords)

print("Data coordinates to display coordinates:")
for data, display in zip(data_coords, display_coords):
    print(f"{data} -> {display}")

plt.title("How2matplotlib.com - Scatter Plot Transform Example")
plt.colorbar(scatter)
plt.show()
Output:
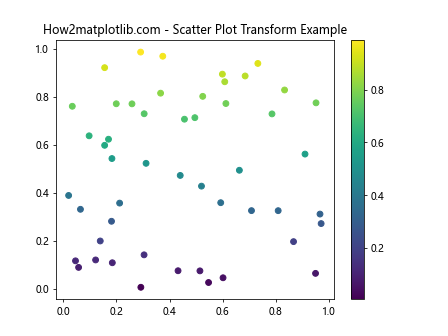
This example creates a scatter plot with random data points and demonstrates how to use the get_transform() function to convert multiple data coordinates to display coordinates simultaneously.
Bar Plots
The Matplotlib.axis.Axis.get_transform() function can be particularly useful when working with bar plots, especially when you need to add custom annotations or elements. Here’s an example:
import matplotlib.pyplot as plt
import numpy as np

# Create data
categories = ['A', 'B', 'C', 'D']
values = [3, 7, 2, 5]

# Create a figure and axis
fig, ax = plt.subplots()

# Create a bar plot
bars = ax.bar(categories, values)

# Get the transform for the x-axis
x_transform = ax.xaxis.get_transform()

# Add labels above each bar
for i, (cat, val) in enumerate(zip(categories, values)):
    # Convert data coordinates to display coordinates
    display_coords = x_transform.transform([(i, 0)])

    # Add text annotation
    ax.annotate(f'{val}', xy=(display_coords[0][0], val), xytext=(0, 3),
                textcoords='offset points', ha='center', va='bottom')

plt.title("How2matplotlib.com - Bar Plot Transform Example")
plt.show()
Output:
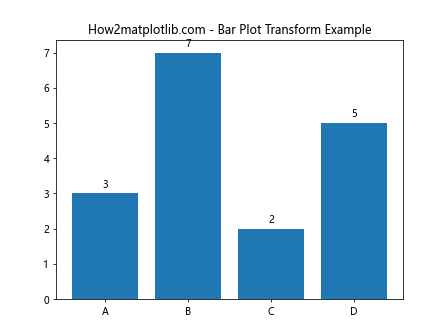
In this example, we create a bar plot and use the get_transform() function to help position text annotations above each bar. This demonstrates how the function can be used to achieve precise positioning of elements in your plots.
Advanced Applications of Matplotlib.axis.Axis.get_transform()
Now that we’ve covered the basics and usage with different plot types, let’s explore some more advanced applications of the Matplotlib.axis.Axis.get_transform() function.
Custom Coordinate Systems
One powerful application of the get_transform() function is creating custom coordinate systems. This can be particularly useful when working with specialized data or when you need to represent information in a non-standard way.
Here’s an example that demonstrates how to create a custom polar coordinate system using get_transform():
import matplotlib.pyplot as plt
import numpy as np
from matplotlib.transforms import Affine2D

# Create data in polar coordinates
theta = np.linspace(0, 2*np.pi, 100)
r = 1 + 0.5 * np.sin(5 * theta)

# Create a figure and axis
fig, ax = plt.subplots()

# Get the transform for the data coordinate system
data_transform = ax.transData

# Create a custom polar transform
polar_transform = Affine2D().scale(np.pi/180, 1).translate(0, 0)

# Combine the transforms
transform = polar_transform + data_transform

# Plot the data using the custom transform
ax.plot(theta, r, transform=transform)

# Set the limits and aspect ratio
ax.set_xlim(-1.5, 1.5)
ax.set_ylim(-1.5, 1.5)
ax.set_aspect('equal')

plt.title("How2matplotlib.com - Custom Polar Coordinate System")
plt.show()
Output:
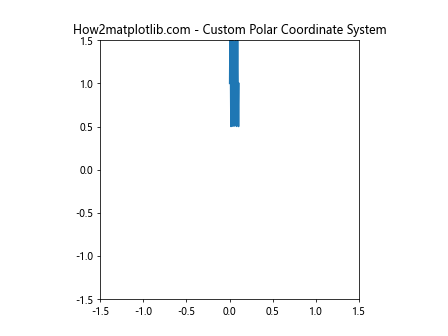
In this example, we use the get_transform() function indirectly by accessing the transData attribute of the axis. We then combine this with a custom Affine2D transform to create a polar coordinate system. This demonstrates the flexibility and power of working with transforms in Matplotlib.
Working with Matplotlib.axis.Axis.get_transform() in 3D Plots
While the Matplotlib.axis.Axis.get_transform() function is commonly used with 2D plots, it can also be applied to 3D plots. However, working with transforms in 3D space requires some additional considerations.
Here’s an example that demonstrates how to use get_transform() with a 3D plot:
import matplotlib.pyplot as plt
import numpy as np
from mpl_toolkits.mplot3d import Axes3D

# Create data
x = np.linspace(-5, 5, 100)
y = np.linspace(-5, 5, 100)
X, Y = np.meshgrid(x, y)
Z = np.sin(np.sqrt(X**2 + Y**2))

# Create a figure and 3D axis
fig = plt.figure()
ax = fig.add_subplot(111, projection='3d')

# Plot the surface
surf = ax.plot_surface(X, Y, Z, cmap='viridis')

# Get the transform for the z-axis
z_transform = ax.zaxis.get_transform()

# Convert a point from data coordinates to display coordinates
data_point = (0, 0, 1)
display_point = z_transform.transform(data_point)

print(f"Data point {data_point} in display coordinates: {display_point}")

plt.title("How2matplotlib.com - 3D Plot Transform Example")
plt.colorbar(surf)
plt.show()
Output:
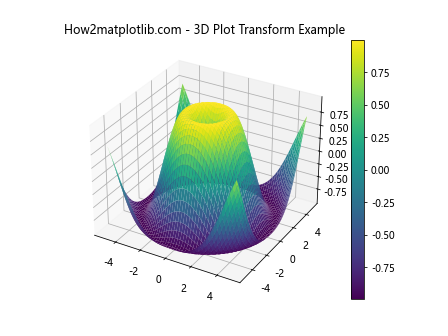
In this example, we create a 3D surface plot and use the get_transform() function to convert a point from data coordinates to display coordinates. This can be useful when you need to position annotations or custom elements in 3D space.
Handling Axis Limits and Scales with Matplotlib.axis.Axis.get_transform()
The Matplotlib.axis.Axis.get_transform() function is closely related to axis limits and scales. Understanding how these elements interact can help you create more sophisticated and accurate visualizations.
Axis Limits
When you change the axis limits using functions like set_xlim() or set_ylim(), the transformation returned by get_transform() is updated accordingly. Here’s an example that demonstrates this behavior:
import matplotlib.pyplot as plt
import numpy as np

# Create data
x = np.linspace(0, 10, 100)
y = np.sin(x)

# Create a figure and axis
fig, ax = plt.subplots()

# Plot the data
ax.plot(x, y)

# Get the initial transform
initial_transform = ax.xaxis.get_transform()

# Convert a point from data to display coordinates
initial_point = initial_transform.transform([(5, 0)])
print(f"Initial data point (5, 0) in display coordinates: {initial_point}")

# Change the x-axis limits
ax.set_xlim(0, 5)

# Get the updated transform
updated_transform = ax.xaxis.get_transform()

# Convert the same point using the updated transform
updated_point = updated_transform.transform([(5, 0)])
print(f"Updated data point (5, 0) in display coordinates: {updated_point}")

plt.title("How2matplotlib.com - Axis Limits and Transforms")
plt.show()
Output:
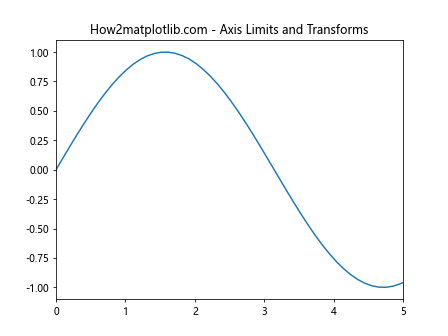
This example shows how changing the axis limits affects the transformation returned by get_transform(). Understanding this relationship is crucial when working with custom annotations or when you need precise control over element positioning in your plots.
Axis Scales
The Matplotlib.axis.Axis.get_transform() function is also affected by changes in axis scales. When you switch between linear, logarithmic, or other scale types, the transformation object is updated to reflect the new scale.
Here’s an example that demonstrates how get_transform() behaves with different axis scales:
import matplotlib.pyplot as plt
import numpy as np

# Create data
x = np.logspace(0, 2, 100)
y = x**2

# Create a figure and axis
fig, (ax1, ax2) = plt.subplots(1, 2, figsize=(12, 5))

# Plot with linear scale
ax1.plot(x, y)
ax1.set_title("Linear Scale")

# Get the transform for linear scale
linear_transform = ax1.xaxis.get_transform()

# Plot with log scale
ax2.plot(x, y)
ax2.set_xscale('log')
ax2.set_title("Log Scale")

# Get the transform for log scale
log_transform = ax2.xaxis.get_transform()

# Convert a point from data to display coordinates for both scales
data_point = (10, 0)
linear_display = linear_transform.transform([data_point])
log_display = log_transform.transform([data_point])

print(f"Data point {data_point} in linear display coordinates: {linear_display}")
print(f"Data point {data_point} in log display coordinates: {log_display}")

plt.suptitle("How2matplotlib.com - Axis Scales and Transforms")
plt.tight_layout()
plt.show()
Output:
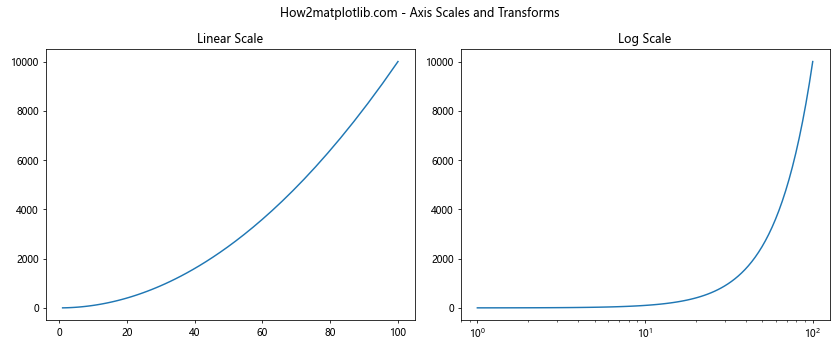
This example illustrates how the transformation returned by get_transform() differs between linear and logarithmic scales. Understanding these differences is essential when working with data that spans multiple orders of magnitude or when you need to combine different scale types in a single plot.
Error Handling and Best Practices with Matplotlib.axis.Axis.get_transform()
When working with the Matplotlib.axis.Axis.get_transform() function, it’s important to be aware of potential errors and follow best practicesto ensure your code is robust and efficient. Here are some key points to consider:
Error Handling
While the get_transform() function itself doesn’t typically raise errors, issues can arise when working with the returned transform object. Here’s an example that demonstrates how to handle potential errors:
import matplotlib.pyplot as plt
import numpy as np

# Create a figure and axis
fig, ax = plt.subplots()

# Get the transform for the x-axis
x_transform = ax.xaxis.get_transform()

# Define a point to transform
data_point = (5, 0)

try:
    # Attempt to transform the point
    display_point = x_transform.transform([data_point])
    print(f"Data point {data_point} in display coordinates: {display_point}")
except ValueError as e:
    print(f"Error transforming point: {e}")
except Exception as e:
    print(f"An unexpected error occurred: {e}")

plt.title("How2matplotlib.com - Error Handling Example")
plt.show()
Output:
This example demonstrates how to use try-except blocks to handle potential errors when working with transforms. It’s a good practice to anticipate and handle errors gracefully, especially when working with user input or dynamic data.
Best Practices
- Cache transforms when possible: If you’re applying the same transform multiple times, it’s more efficient to store the transform object and reuse it rather than calling get_transform() repeatedly.
Use the appropriate transform: Make sure you’re using the correct transform for your needs. For example, use ax.transData for data coordinates, ax.transAxes for axes coordinates, and fig.transFigure for figure coordinates.
Be aware of the coordinate system: Always keep in mind which coordinate system you’re working in (data, axes, or figure) to avoid confusion and errors.
Update transforms when necessary: If you modify the plot (e.g., change limits or scales), remember to update any stored transform objects.
Here’s an example that demonstrates some of these best practices: