How to Master Positioning the Colorbar in Matplotlib
Positioning the colorbar in Matplotlib is an essential skill for creating informative and visually appealing data visualizations. This comprehensive guide will explore various techniques and best practices for positioning the colorbar in Matplotlib, providing you with the knowledge and tools to enhance your data visualization projects.
Understanding the Importance of Positioning the Colorbar in Matplotlib
Positioning the colorbar in Matplotlib is crucial for creating clear and effective visualizations. A well-positioned colorbar can provide valuable context and information about the data being displayed, making it easier for viewers to interpret the plot. In this section, we’ll discuss why proper colorbar positioning is important and how it can impact the overall effectiveness of your visualizations.
When positioning the colorbar in Matplotlib, consider the following factors:
- Readability: The colorbar should be easily visible and not obstruct the main plot.
- Proximity: The colorbar should be close enough to the plot for easy reference.
- Size: The colorbar should be appropriately sized to show the full range of values.
- Orientation: Choose between vertical and horizontal colorbars based on your plot layout.
- Alignment: Ensure the colorbar is aligned with the plot for a professional appearance.
Let’s start with a basic example of positioning the colorbar in Matplotlib:
import matplotlib.pyplot as plt
import numpy as np

# Create sample data
data = np.random.rand(10, 10)

# Create a figure and axis
fig, ax = plt.subplots(figsize=(8, 6))

# Create a heatmap
im = ax.imshow(data, cmap='viridis')

# Add a colorbar
cbar = plt.colorbar(im)

# Set labels and title
ax.set_title('Positioning the Colorbar in Matplotlib - how2matplotlib.com')
cbar.set_label('Values')

plt.show()
Output:
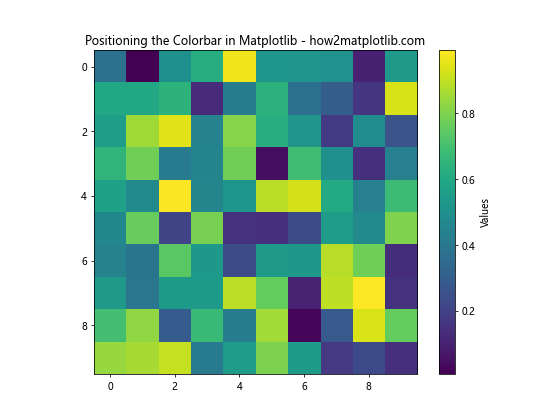
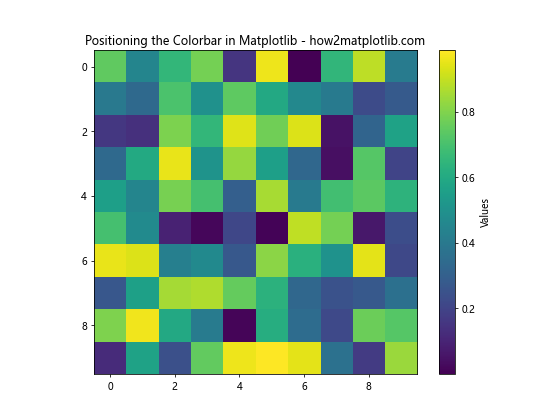
In this example, we create a simple heatmap and add a colorbar using the default positioning. The plt.colorbar() function automatically positions the colorbar to the right of the plot. This default positioning works well for many visualizations, but there are times when you may want more control over the colorbar’s position.
Customizing Colorbar Position with the ax Parameter
One way to control the positioning of the colorbar in Matplotlib is by using the ax parameter in the colorbar() function. This parameter allows you to specify which axes the colorbar should be associated with, giving you more control over its placement.
Here’s an example of positioning the colorbar in Matplotlib using the ax parameter:
import matplotlib.pyplot as plt
import numpy as np

# Create sample data
data = np.random.rand(10, 10)

# Create a figure and axes
fig, (ax1, ax2) = plt.subplots(1, 2, figsize=(12, 5))

# Create a heatmap in the first axis
im1 = ax1.imshow(data, cmap='viridis')

# Add a colorbar to the first axis
cbar1 = plt.colorbar(im1, ax=ax1)

# Create another heatmap in the second axis
im2 = ax2.imshow(data, cmap='plasma')

# Add a colorbar to the second axis
cbar2 = plt.colorbar(im2, ax=ax2)

# Set labels and title
fig.suptitle('Positioning the Colorbar in Matplotlib - how2matplotlib.com')
ax1.set_title('Viridis Colormap')
ax2.set_title('Plasma Colormap')
cbar1.set_label('Values')
cbar2.set_label('Values')

plt.tight_layout()
plt.show()
Output:
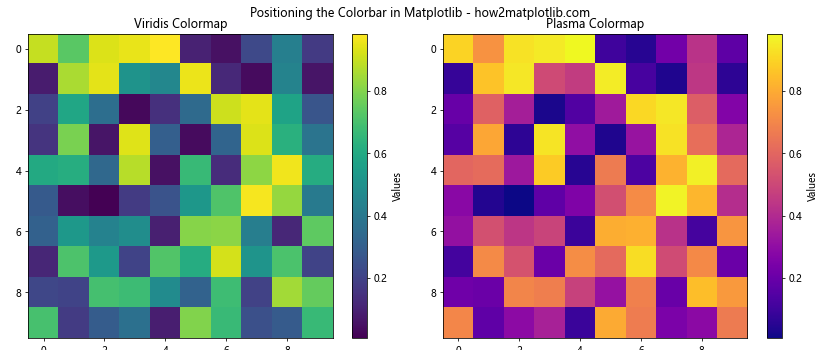
In this example, we create two subplots and add a colorbar to each one using the ax parameter. This allows us to position the colorbar next to its corresponding plot, making it clear which colorbar belongs to which visualization.
Using make_axes_locatable for Precise Colorbar Positioning
For more precise control over positioning the colorbar in Matplotlib, you can use the make_axes_locatable function from mpl_toolkits.axes_grid1. This function allows you to create a new axes for the colorbar and specify its size and position relative to the main plot.
Here’s an example of positioning the colorbar in Matplotlib using make_axes_locatable:
import matplotlib.pyplot as plt
import numpy as np
from mpl_toolkits.axes_grid1 import make_axes_locatable

# Create sample data
data = np.random.rand(10, 10)

# Create a figure and axis
fig, ax = plt.subplots(figsize=(8, 6))

# Create a heatmap
im = ax.imshow(data, cmap='viridis')

# Create an axes divider
divider = make_axes_locatable(ax)

# Add a colorbar axis
cax = divider.append_axes("right", size="5%", pad=0.1)

# Add a colorbar to the new axis
cbar = plt.colorbar(im, cax=cax)

# Set labels and title
ax.set_title('Positioning the Colorbar in Matplotlib - how2matplotlib.com')
cbar.set_label('Values')

plt.show()
Output:
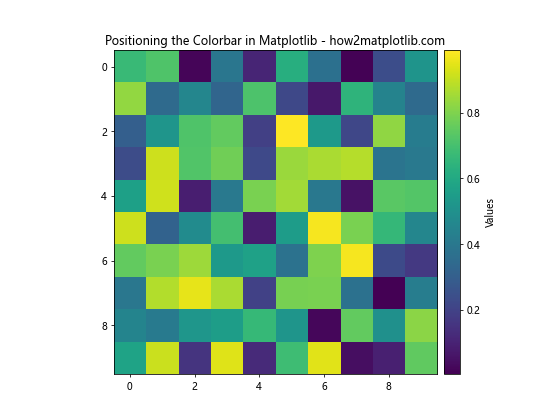
In this example, we use make_axes_locatable to create a new axis for the colorbar. We specify that the colorbar should be positioned to the right of the main plot, with a width of 5% of the main plot’s width and a padding of 0.1 inches. This gives us precise control over the colorbar’s size and position.
Adjusting Colorbar Orientation
When positioning the colorbar in Matplotlib, you can choose between vertical and horizontal orientations. The choice of orientation can depend on the layout of your plot and the available space. Let’s explore how to change the colorbar orientation:
import matplotlib.pyplot as plt
import numpy as np

# Create sample data
data = np.random.rand(10, 10)

# Create a figure and axes
fig, (ax1, ax2) = plt.subplots(2, 1, figsize=(8, 10))

# Create a heatmap in the first axis with vertical colorbar
im1 = ax1.imshow(data, cmap='viridis')
cbar1 = plt.colorbar(im1, ax=ax1, orientation='vertical')

# Create a heatmap in the second axis with horizontal colorbar
im2 = ax2.imshow(data, cmap='plasma')
cbar2 = plt.colorbar(im2, ax=ax2, orientation='horizontal')

# Set labels and title
fig.suptitle('Positioning the Colorbar in Matplotlib - how2matplotlib.com')
ax1.set_title('Vertical Colorbar')
ax2.set_title('Horizontal Colorbar')
cbar1.set_label('Values')
cbar2.set_label('Values')

plt.tight_layout()
plt.show()
Output:
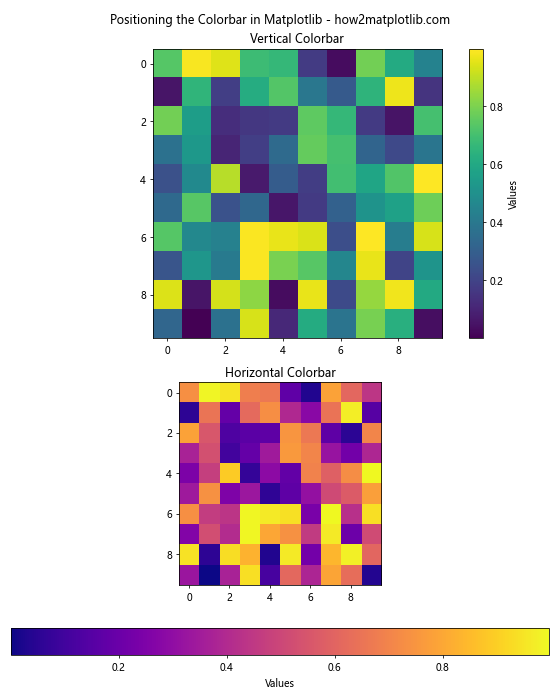
In this example, we create two subplots: one with a vertical colorbar and another with a horizontal colorbar. The orientation is specified using the orientation parameter in the colorbar() function. Vertical colorbars are often used when there’s more vertical space available, while horizontal colorbars can be useful when there’s limited vertical space or when you want to emphasize the range of values along the x-axis.
Positioning Multiple Colorbars
When working with multiple plots or subplots, you may need to position multiple colorbars in Matplotlib. This can be challenging, but with the right techniques, you can create clear and informative visualizations. Let’s look at an example of positioning multiple colorbars:
import matplotlib.pyplot as plt
import numpy as np
from mpl_toolkits.axes_grid1 import make_axes_locatable

# Create sample data
data1 = np.random.rand(10, 10)
data2 = np.random.rand(10, 10)

# Create a figure and axes
fig, (ax1, ax2) = plt.subplots(1, 2, figsize=(12, 5))

# Create heatmaps
im1 = ax1.imshow(data1, cmap='viridis')
im2 = ax2.imshow(data2, cmap='plasma')

# Create axes dividers
divider1 = make_axes_locatable(ax1)
divider2 = make_axes_locatable(ax2)

# Add colorbar axes
cax1 = divider1.append_axes("right", size="5%", pad=0.1)
cax2 = divider2.append_axes("right", size="5%", pad=0.1)

# Add colorbars
cbar1 = plt.colorbar(im1, cax=cax1)
cbar2 = plt.colorbar(im2, cax=cax2)

# Set labels and title
fig.suptitle('Positioning the Colorbar in Matplotlib - how2matplotlib.com')
ax1.set_title('Viridis Colormap')
ax2.set_title('Plasma Colormap')
cbar1.set_label('Values 1')
cbar2.set_label('Values 2')

plt.tight_layout()
plt.show()
Output:
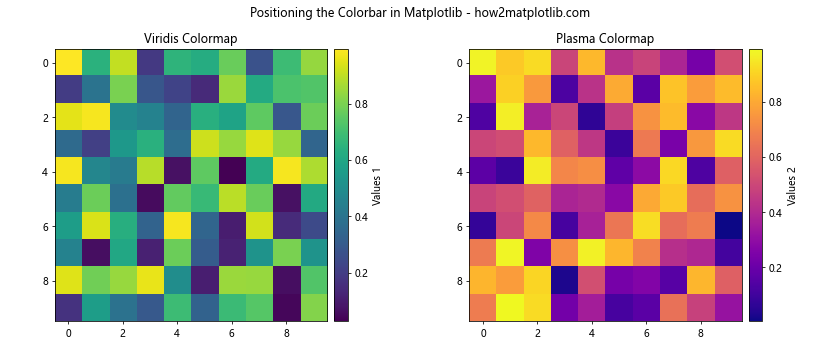
In this example, we create two subplots, each with its own heatmap and colorbar. We use make_axes_locatable to create separate axes for each colorbar, ensuring that they are properly aligned with their respective plots. This technique allows for precise positioning of multiple colorbars in Matplotlib.
Adjusting Colorbar Size and Aspect Ratio
When positioning the colorbar in Matplotlib, you may want to adjust its size and aspect ratio to better fit your visualization. This can be achieved by modifying the size parameter when creating the colorbar axis. Let’s explore how to adjust the colorbar size:
import matplotlib.pyplot as plt
import numpy as np
from mpl_toolkits.axes_grid1 import make_axes_locatable

# Create sample data
data = np.random.rand(10, 10)

# Create a figure and axes
fig, (ax1, ax2) = plt.subplots(1, 2, figsize=(12, 5))

# Create heatmaps
im1 = ax1.imshow(data, cmap='viridis')
im2 = ax2.imshow(data, cmap='plasma')

# Create axes dividers
divider1 = make_axes_locatable(ax1)
divider2 = make_axes_locatable(ax2)

# Add colorbar axes with different sizes
cax1 = divider1.append_axes("right", size="5%", pad=0.1)
cax2 = divider2.append_axes("right", size="10%", pad=0.1)

# Add colorbars
cbar1 = plt.colorbar(im1, cax=cax1)
cbar2 = plt.colorbar(im2, cax=cax2)

# Set labels and title
fig.suptitle('Positioning the Colorbar in Matplotlib - how2matplotlib.com')
ax1.set_title('Normal Colorbar')
ax2.set_title('Wide Colorbar')
cbar1.set_label('Values')
cbar2.set_label('Values')

plt.tight_layout()
plt.show()
Output:
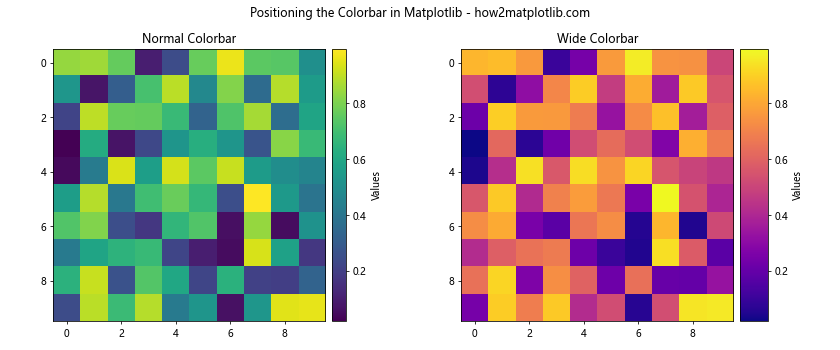
In this example, we create two subplots with different colorbar sizes. The first colorbar has a width of 5% of the main plot’s width, while the second colorbar has a width of 10%. By adjusting the size parameter, you can control the width (for vertical colorbars) or height (for horizontal colorbars) of the colorbar.
Positioning the Colorbar Outside the Plot Area
Sometimes, you may want to position the colorbar outside the main plot area to maximize the space available for your data visualization. This can be achieved by adjusting the subplot parameters and using make_axes_locatable. Here’s an example of positioning the colorbar outside the plot area:
import matplotlib.pyplot as plt
import numpy as np
from mpl_toolkits.axes_grid1 import make_axes_locatable

# Create sample data
data = np.random.rand(20, 20)

# Create a figure and axis
fig, ax = plt.subplots(figsize=(8, 6))

# Adjust subplot parameters to make room for the colorbar
plt.subplots_adjust(right=0.8)

# Create a heatmap
im = ax.imshow(data, cmap='viridis')

# Create an axes divider
divider = make_axes_locatable(ax)

# Add a colorbar axis outside the plot area
cax = divider.new_horizontal(size="5%", pad=0.1, pack_start=True)

# Add the colorbar axis to the figure
fig.add_axes(cax)

# Add a colorbar to the new axis
cbar = plt.colorbar(im, cax=cax)

# Set labels and title
ax.set_title('Positioning the Colorbar in Matplotlib - how2matplotlib.com')
cbar.set_label('Values')

plt.show()
Output:
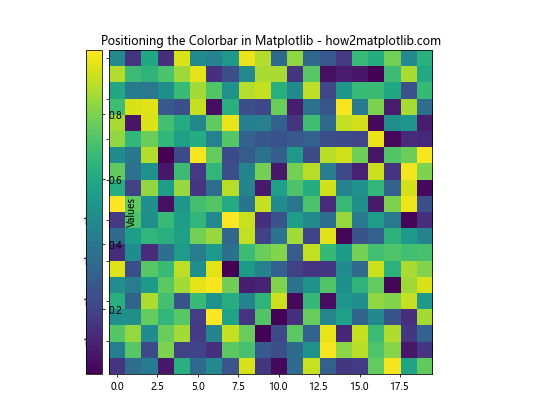
In this example, we use plt.subplots_adjust() to create space on the right side of the figure for the colorbar. We then use make_axes_locatable to create a new horizontal axis for the colorbar outside the main plot area. This technique allows you to position the colorbar in Matplotlib without reducing the size of your main plot.
Customizing Colorbar Ticks and Labels
When positioning the colorbar in Matplotlib, you may want to customize the ticks and labels to better represent your data. This can include changing the number of ticks, adjusting their positions, or modifying the label format. Let’s explore how to customize colorbar ticks and labels:
import matplotlib.pyplot as plt
import numpy as np

# Create sample data
data = np.random.rand(10, 10) * 100

# Create a figure and axis
fig, ax = plt.subplots(figsize=(8, 6))

# Create a heatmap
im = ax.imshow(data, cmap='viridis')

# Add a colorbar
cbar = plt.colorbar(im)

# Customize colorbar ticks and labels
cbar.set_ticks([0, 25, 50, 75, 100])
cbar.set_ticklabels(['0%', '25%', '50%', '75%', '100%'])

# Set labels and title
ax.set_title('Positioning the Colorbar in Matplotlib - how2matplotlib.com')
cbar.set_label('Percentage')

plt.show()
Output:
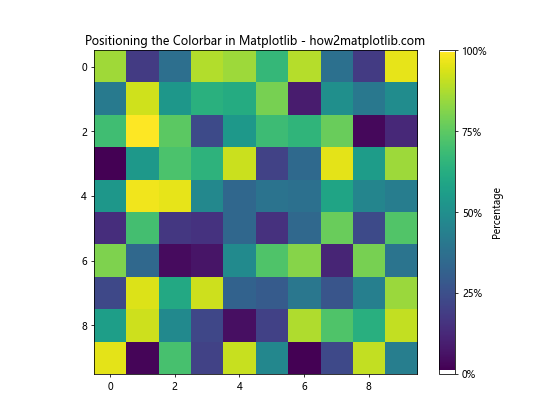
In this example, we customize the colorbar ticks and labels to display percentages. We use set_ticks() to specify the positions of the ticks and set_ticklabels() to set custom labels for each tick. This technique allows you to create more informative and context-specific colorbars when positioning them in Matplotlib.
Positioning the Colorbar for 3D Plots
Positioning the colorbar in Matplotlib for 3D plots requires a slightly different approach. When working with 3D plots, you’ll need to use the add_axes() method to create a new axis for the colorbar. Here’s an example of positioning the colorbar for a 3D surface plot:
import matplotlib.pyplot as plt
import numpy as np
from mpl_toolkits.mplot3d import Axes3D

# Create sample data
x = np.linspace(-5, 5, 100)
y = np.linspace(-5, 5, 100)
X, Y = np.meshgrid(x, y)
Z = np.sin(np.sqrt(X**2 + Y**2))

# Create a figure and 3D axis
fig = plt.figure(figsize=(10, 8))
ax = fig.add_subplot(111, projection='3d')

# Create a surface plot
surf = ax.plot_surface(X, Y, Z, cmap='viridis')

# Add a colorbar
cbar_ax = fig.add_axes([0.85, 0.15, 0.05, 0.7])
cbar = fig.colorbar(surf, cax=cbar_ax)

# Set labels and title
ax.set_title('Positioning theColorbar in Matplotlib - how2matplotlib.com')
ax.set_xlabel('X')
ax.set_ylabel('Y')
ax.set_zlabel('Z')
cbar.set_label('Values')

plt.show()
Output:
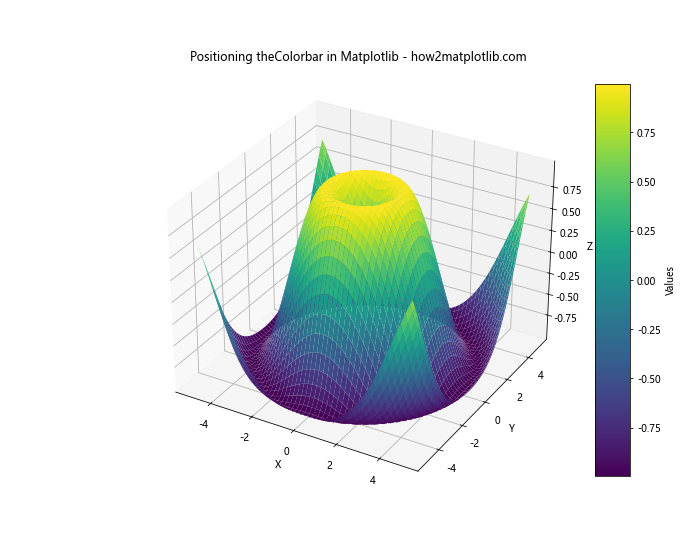
In this example, we create a 3D surface plot and add a colorbar to the right side of the figure. We use fig.add_axes() to create a new axis for the colorbar, specifying its position and size as a fraction of the figure dimensions. This technique allows you to position the colorbar in Matplotlib for 3D plots while maintaining control over its placement and size.
Positioning the Colorbar for Polar Plots
Positioning the colorbar in Matplotlib for polar plots presents unique challenges due to the circular nature of the plot. Here’s an example of how to add a colorbar to a polar plot:
import matplotlib.pyplot as plt
import numpy as np

# Create sample data
r = np.linspace(0, 2, 100)
theta = np.linspace(0, 2*np.pi, 100)
R, Theta = np.meshgrid(r, theta)
Z = R**2 * (1 - R/2) * np.cos(5*Theta)

# Create a figure and polar axis
fig, ax = plt.subplots(subplot_kw=dict(projection='polar'), figsize=(8, 6))

# Create a polar contour plot
im = ax.contourf(Theta, R, Z, cmap='viridis')

# Add a colorbar
cbar = plt.colorbar(im, ax=ax, pad=0.1)

# Set labels and title
ax.set_title('Positioning the Colorbar in Matplotlib - how2matplotlib.com')
cbar.set_label('Values')

plt.show()
Output:
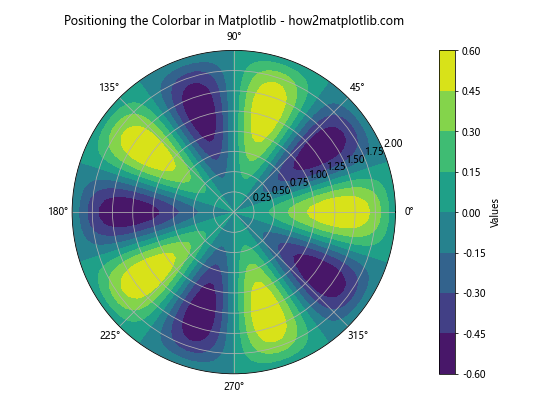
In this example, we create a polar contour plot and add a colorbar to the right side. The pad parameter in the colorbar() function is used to adjust the distance between the plot and the colorbar. This technique allows you to position the colorbar in Matplotlib for polar plots while maintaining the circular layout of the main plot.
Positioning the Colorbar for Subplots with Different Scales
When working with subplots that have different scales or ranges, positioning the colorbar in Matplotlib can be challenging. In such cases, you may want to use separate colorbars for each subplot. Here’s an example of how to achieve this:
import matplotlib.pyplot as plt
import numpy as np
from mpl_toolkits.axes_grid1 import make_axes_locatable

# Create sample data
data1 = np.random.rand(10, 10)
data2 = np.random.rand(10, 10) * 100

# Create a figure and axes
fig, (ax1, ax2) = plt.subplots(1, 2, figsize=(12, 5))

# Create heatmaps
im1 = ax1.imshow(data1, cmap='viridis')
im2 = ax2.imshow(data2, cmap='plasma')

# Create axes dividers
divider1 = make_axes_locatable(ax1)
divider2 = make_axes_locatable(ax2)

# Add colorbar axes
cax1 = divider1.append_axes("right", size="5%", pad=0.1)
cax2 = divider2.append_axes("right", size="5%", pad=0.1)

# Add colorbars
cbar1 = plt.colorbar(im1, cax=cax1)
cbar2 = plt.colorbar(im2, cax=cax2)

# Set labels and title
fig.suptitle('Positioning the Colorbar in Matplotlib - how2matplotlib.com')
ax1.set_title('Data Range: 0-1')
ax2.set_title('Data Range: 0-100')
cbar1.set_label('Values')
cbar2.set_label('Values')

plt.tight_layout()
plt.show()
Output:
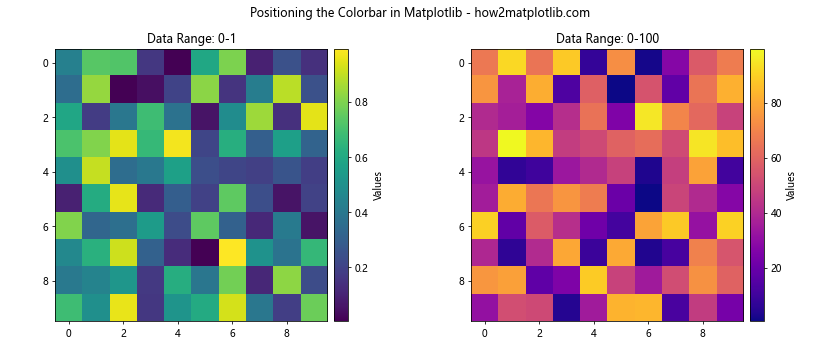
In this example, we create two subplots with different data ranges. We use make_axes_locatable to create separate colorbar axes for each subplot, allowing us to position the colorbars in Matplotlib with different scales for each plot.
Using Colorbar Normalization for Better Visualization
When positioning the colorbar in Matplotlib, you may encounter situations where your data has extreme values or is not evenly distributed. In such cases, using colorbar normalization can help improve the visualization. Let’s explore how to use different normalization techniques:
import matplotlib.pyplot as plt
import numpy as np
from matplotlib.colors import LogNorm, SymLogNorm

# Create sample data with a large range of values
data = np.random.rand(10, 10) * 1000000

# Create a figure and axes
fig, (ax1, ax2, ax3) = plt.subplots(1, 3, figsize=(15, 5))

# Linear normalization
im1 = ax1.imshow(data, cmap='viridis')
cbar1 = plt.colorbar(im1, ax=ax1)
ax1.set_title('Linear Normalization')

# Log normalization
im2 = ax2.imshow(data, cmap='viridis', norm=LogNorm())
cbar2 = plt.colorbar(im2, ax=ax2)
ax2.set_title('Log Normalization')

# Symmetric log normalization
im3 = ax3.imshow(data, cmap='viridis', norm=SymLogNorm(linthresh=1000, linscale=1))
cbar3 = plt.colorbar(im3, ax=ax3)
ax3.set_title('Symmetric Log Normalization')

# Set main title
fig.suptitle('Positioning the Colorbar in Matplotlib - how2matplotlib.com')

plt.tight_layout()
plt.show()
Output:
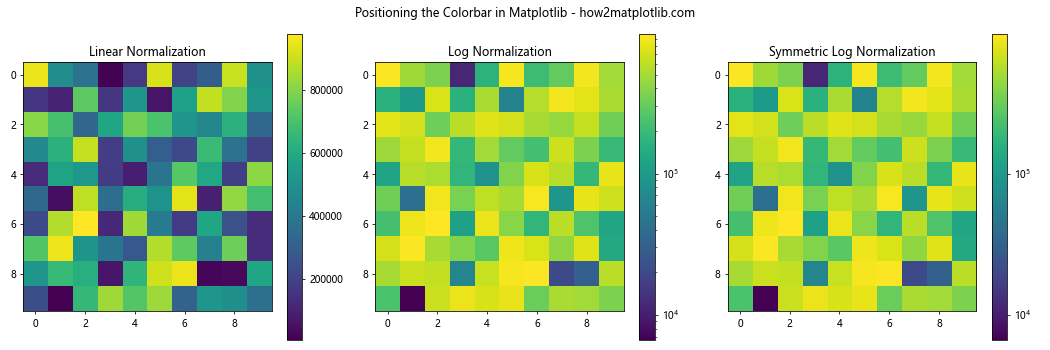
In this example, we demonstrate three different normalization techniques for positioning the colorbar in Matplotlib:
- Linear normalization (default)
- Log normalization
- Symmetric log normalization
Each normalization technique can be useful for different types of data distributions, allowing you to create more informative visualizations when positioning the colorbar in Matplotlib.
Positioning the Colorbar for Animations
When creating animations with Matplotlib, positioning the colorbar can be a bit tricky. You’ll need to ensure that the colorbar updates correctly with each frame of the animation. Here’s an example of how to position the colorbar in an animated plot:
import matplotlib.pyplot as plt
import numpy as np
from matplotlib.animation import FuncAnimation

# Create sample data
def generate_data(frame):
    return np.random.rand(10, 10) * (frame + 1)

# Create a figure and axis
fig, ax = plt.subplots(figsize=(8, 6))

# Initialize the plot
im = ax.imshow(generate_data(0), cmap='viridis', animated=True)
cbar = plt.colorbar(im)

# Update function for the animation
def update(frame):
    data = generate_data(frame)
    im.set_array(data)
    im.set_clim(data.min(), data.max())
    cbar.update_normal(im)
    return [im]

# Create the animation
anim = FuncAnimation(fig, update, frames=50, interval=200, blit=True)

# Set labels and title
ax.set_title('Positioning the Colorbar in Matplotlib - how2matplotlib.com')
cbar.set_label('Values')

plt.show()
Output:
In this example, we create an animated heatmap with a colorbar. The update function is responsible for updating both the heatmap and the colorbar in each frame. By calling cbar.update_normal(im), we ensure that the colorbar updates its range to match the current data. This technique allows you to position the colorbar in Matplotlib for animated plots while maintaining proper synchronization with the changing data.
Best Practices for Positioning the Colorbar in Matplotlib
When positioning the colorbar in Matplotlib, it’s important to follow some best practices to ensure your visualizations are clear, informative, and visually appealing. Here are some key guidelines to keep in mind:
- Consistency: Maintain consistent colorbar positioning across related plots for easier comparison.
Readability: Ensure the colorbar is easily readable by using appropriate font sizes and color contrasts.
Size: Make the colorbar large enough to be easily visible, but not so large that it overshadows the main plot.
Alignment: Align the colorbar with the main plot for a professional appearance.
Labels: Always include clear labels for the colorbar to explain what the colors represent.
Ticks: Use an appropriate number of ticks on the colorbar to provide sufficient detail without cluttering.
Normalization: Choose the appropriate normalization technique (linear, log, etc.) based on your data distribution.
Orientation: Select vertical or horizontal orientation based on the available space and plot layout.
Multiple colorbars: When using multiple colorbars, ensure they are clearly associated with their respective plots.
Accessibility: Consider color vision deficiencies when choosing colormaps and ensure sufficient contrast in the colorbar.
By following these best practices, you can effectively position the colorbar in Matplotlib to create clear, informative, and visually appealing data visualizations.